Introduction
In trading, candle anatomy tells a deeper story than most traders realize. Wick size and location can reveal whether a market is primed for expansion or signaling a reversal. By studying the relationship between wick formation, body size, and time usage within a candle, we can anticipate which moves have the momentum to continue and which are likely to reverse.
This guide breaks down the logic behind wick behavior, shows how to identify expansion versus reversal candles, and explains how to adjust trade targets accordingly across different timeframes.
Expansion vs. Reversal Candles
An expansion candle represents continuation and strength in one direction, while a reversal candle signals exhaustion and the likelihood of a shift or retracement.
Expansion Candle Traits:
-
Small wicks and a large body
-
The high or low forms early in the candle
-
Price uses minimal range for the opposing move (the “shallow run”)
-
Candle closes near its high (in bullish moves) or near its low (in bearish moves)
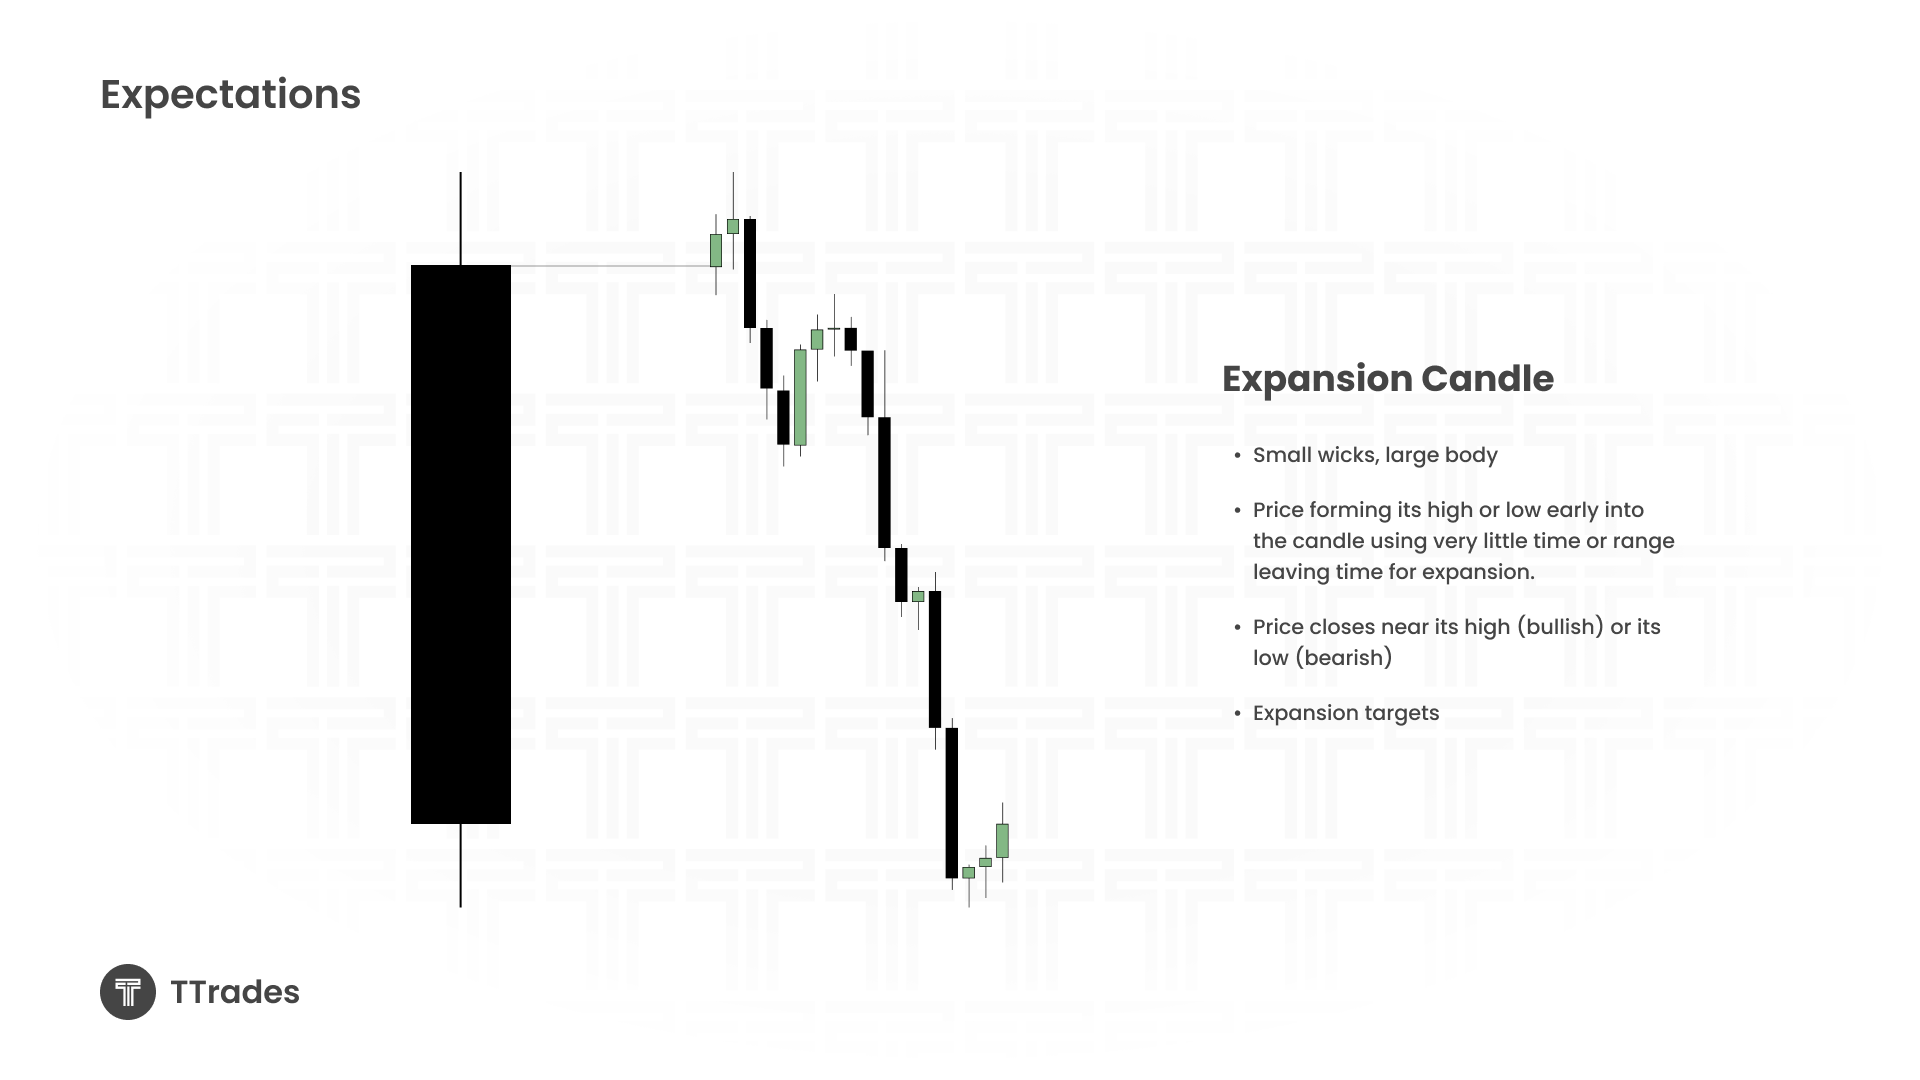
This candle supports expansion because it is efficient, directional, and indicates dominance by one side of the market.
Reversal Candle Traits:
A large opposing wick with a smaller body
Price spends most of the time forming the wick
The candle often closes near the opening price
It indicates exhaustion or a transition between market phases
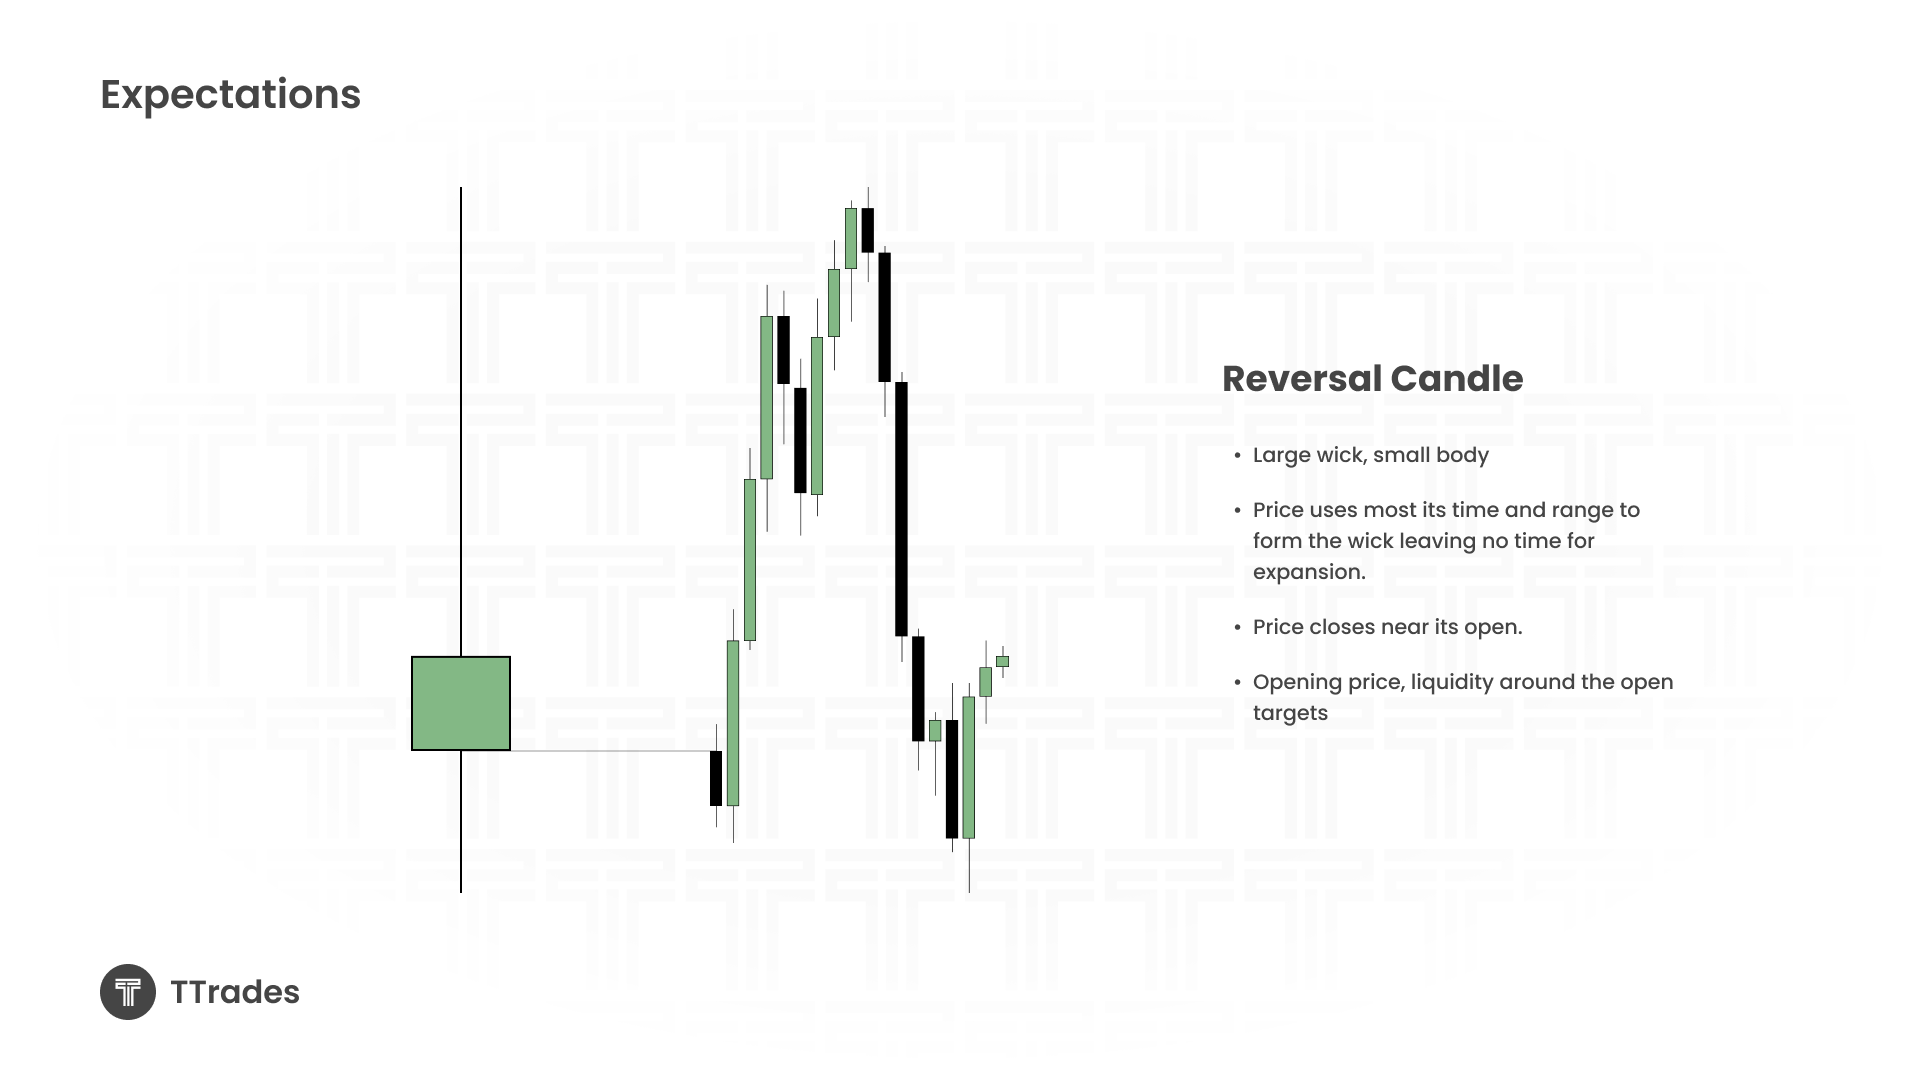
This type does not support expansion. Instead, it often signals that price will revert toward its opening price or nearby liquidity points.
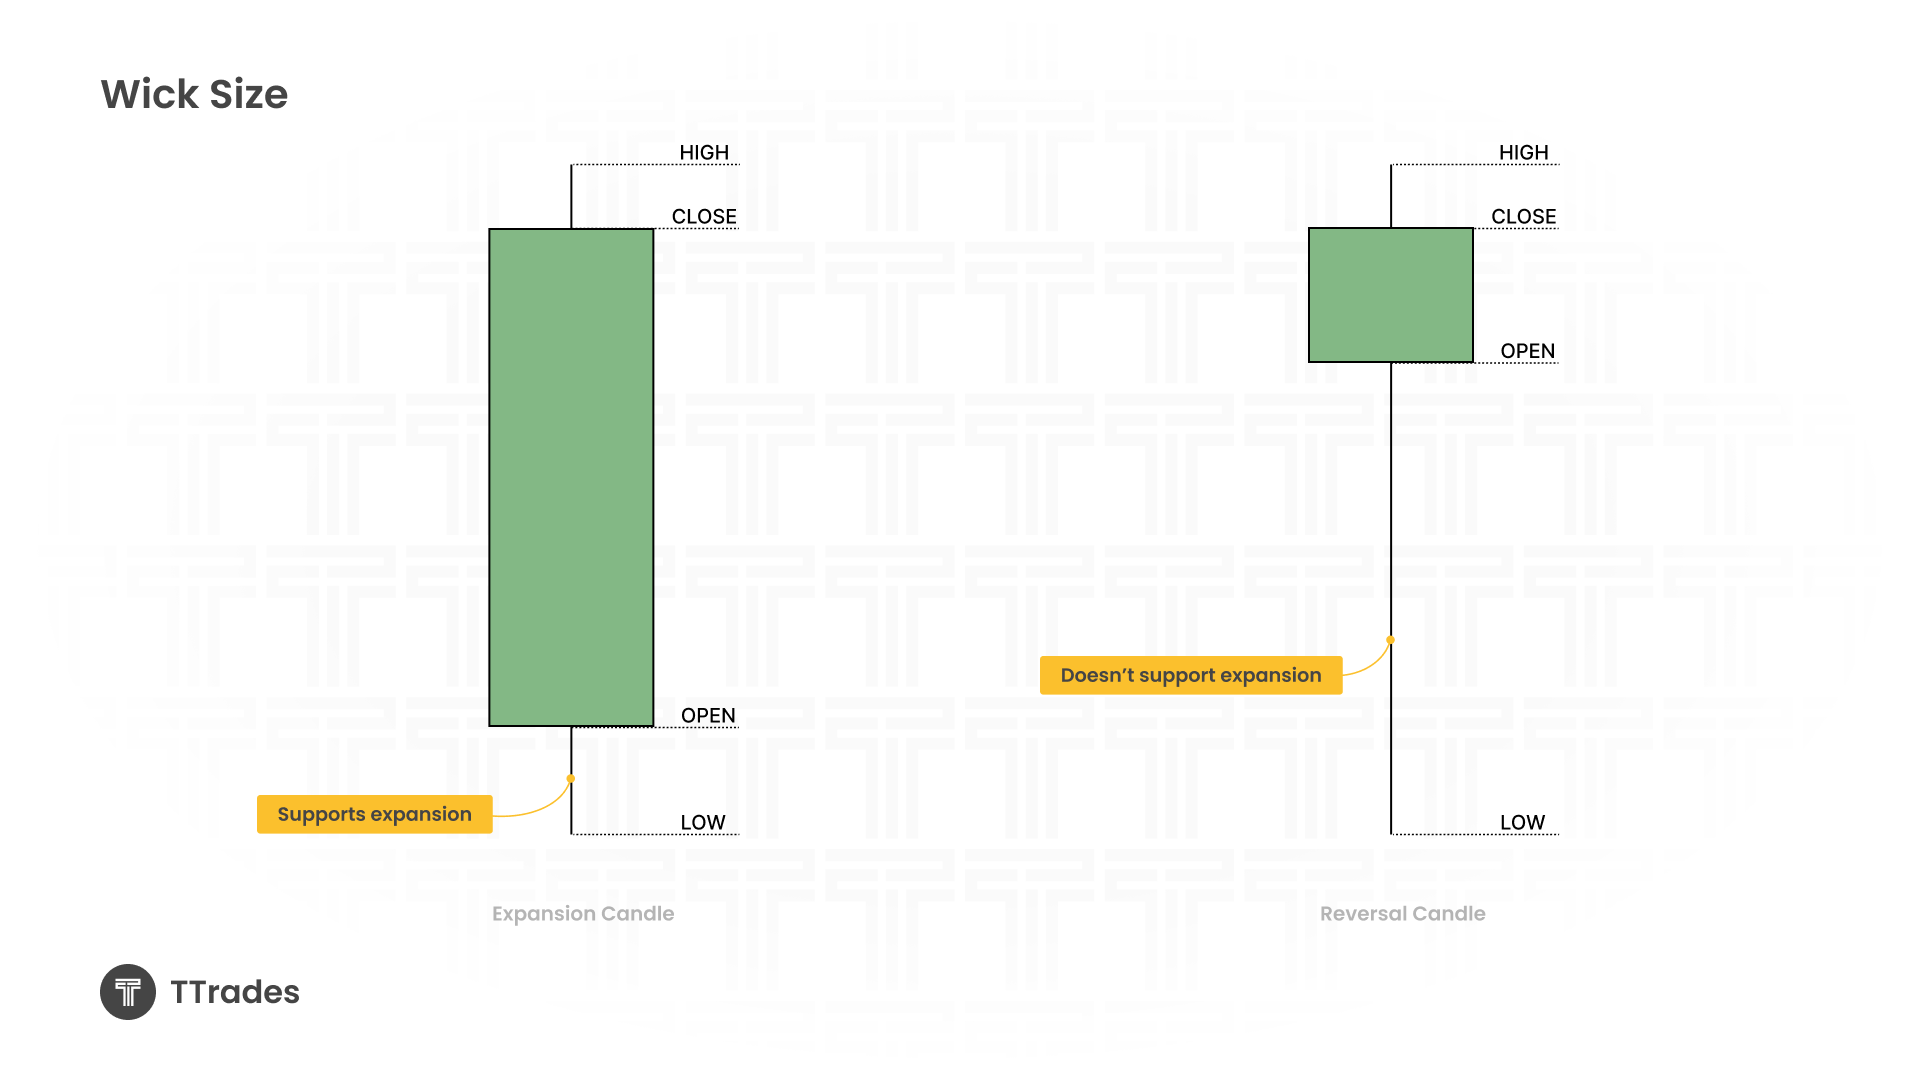
How Wick Size Affects Expansion
The size of the opposing run, which is the wick opposite your bias, determines expansion potential.
-
A small opposing run supports expansion since there’s ample time left in the candle for price to trend further in your direction.
-
A large opposing run suggests reversal since most of the time and range have already been consumed forming the wick, leaving limited room for expansion.
Example:
If price opens, dips slightly (forming a small lower wick), and then rallies for most of the time period, that’s expansion behavior.
If price opens, falls deeply (forming a large lower wick), and then goes back towards the open, that’s reversal behavior.
Adjusting Targets Based on Candle Behavior
Your targeting logic changes depending on the candle type.
Expansion Candle Targets:
-
Expansion points or continuation zones
-
Liquidity resting beyond highs or lows
-
Average candle range
Reversal Candle Targets:
-
The opening price
-
Nearby liquidity around the reversal area
This shift in expectation keeps trades realistic and risk-aware, helping you avoid chasing moves that the market structure does not support.
Using Timeframe Alignment
The most powerful insights come from higher-timeframe candles. When analyzing a 5-minute chart, for instance, look at the 1-hour candle it belongs to. The wick behavior on the hourly often governs what the lower timeframe structure will deliver.
A shallow opposing run early in the higher-timeframe candle means you can expect expansion on lower timeframes. A large opposing run means you should anticipate a reversal setup or range-bound conditions.
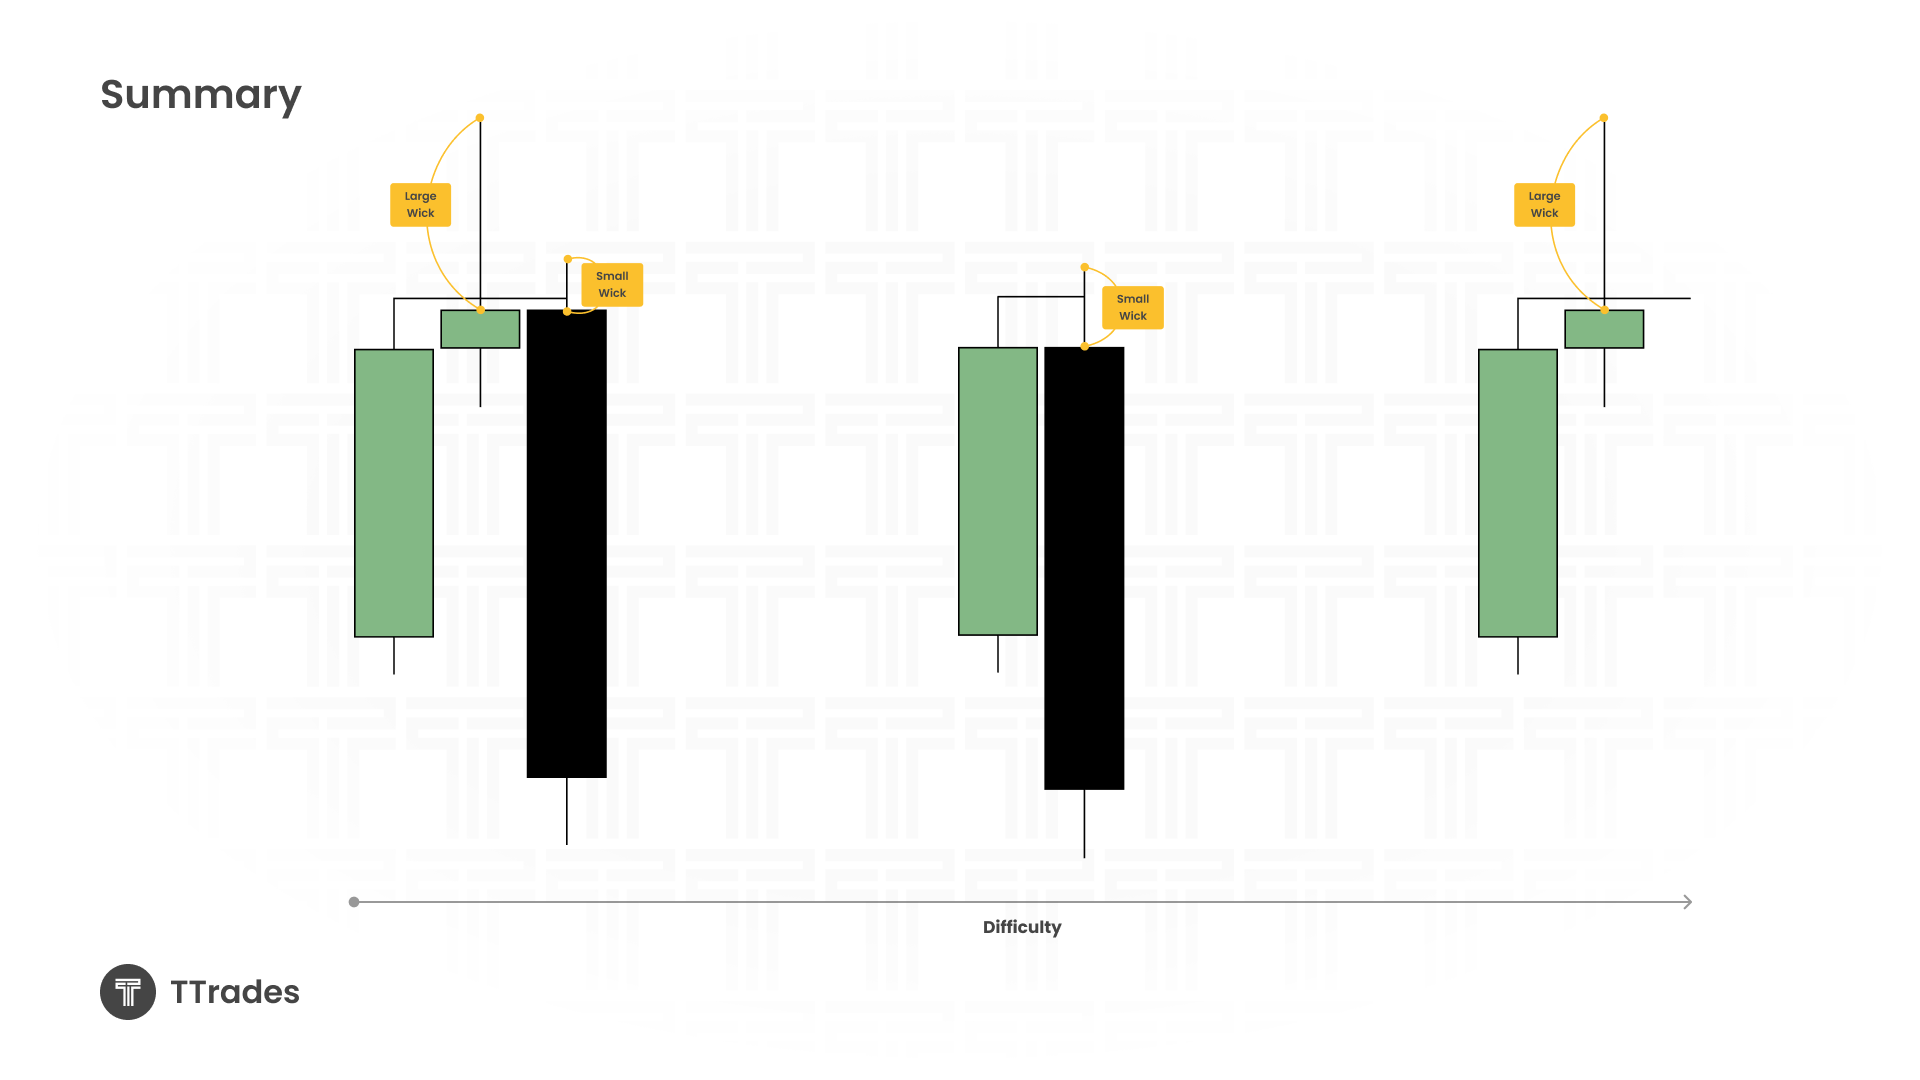
The Three Trading Scenarios
-
Continuation After Reversal (Candle 3 Trade):
Wait for the reversal candle with the large wick to close, then trade the next candle that forms a small wick supporting expansion. This is the most reliable setup. -
Reversal to Expansion in the Same Candle:
This setup requires identifying a shallow opposing run and a clear Change in State of Delivery (CISD) mid-candle. It is moderately difficult but can offer strong reward when timed correctly. -
Large Wick Reversal Trade:
Trading the reversal candle itself carries higher risk. It is best used on higher timeframes, such as the daily chart, with targets back toward the open.
Key Points
Across multiple examples from markets like silver, oil, and indices, the logic remains consistent:
-
A small opposing run indicates that the market can expand strongly in that direction.
-
A large opposing run suggests that price will likely revert to its open or consolidate.
-
CISD confirmation adds conviction that the wick is complete and expansion is probable.
-
SMT divergence strengthens reversal confidence by showing internal weakness or strength across correlated pairs.
Example
-
A large opposing run suggests that price is unlikely to expand lower.
-
Focus on the opening price or liquidity around the opening price for targets.
Example
-
A small opposing run suggests that price is likely to expand lower.
-
Focus on the liquidity targets or average daily range.
Every candle is part of a fractal model, meaning the same logic applies from the one-minute chart to the daily timeframe.
Key Takeaways
Small wicks indicate expansion potential
Large wicks suggest reversal or a return to the open
Early wick formation leaves more time for expansion
CISD and SMT provide valuable confirmation
Align lower timeframes with higher-timeframe candle structure for consistency
Let the market reveal whether a candle supports expansion before committing to bias