

Introduction
This trading model is designed for beginners, but it also works well for experienced traders who want a structured framework for intraday trading. The core idea is simple: align multiple timeframes in the same direction and trade expansion candles using confirmed swing points.
The strategy revolves around three key concepts:
- Daily bias
- Candle 2 and Candle 3 closures
- Change in the state of delivery (CISD)
Once those align, the trader drills down through the timeframes to find precise intraday entries.
Understanding Daily Bias
The entire model starts with establishing a daily bias.
The goal is to anticipate a daily expansion candle, a strong directional candle likely to continue higher or lower throughout the session.
This is done using either:
- A Candle 2 Closure
- A Candle 3 Closure
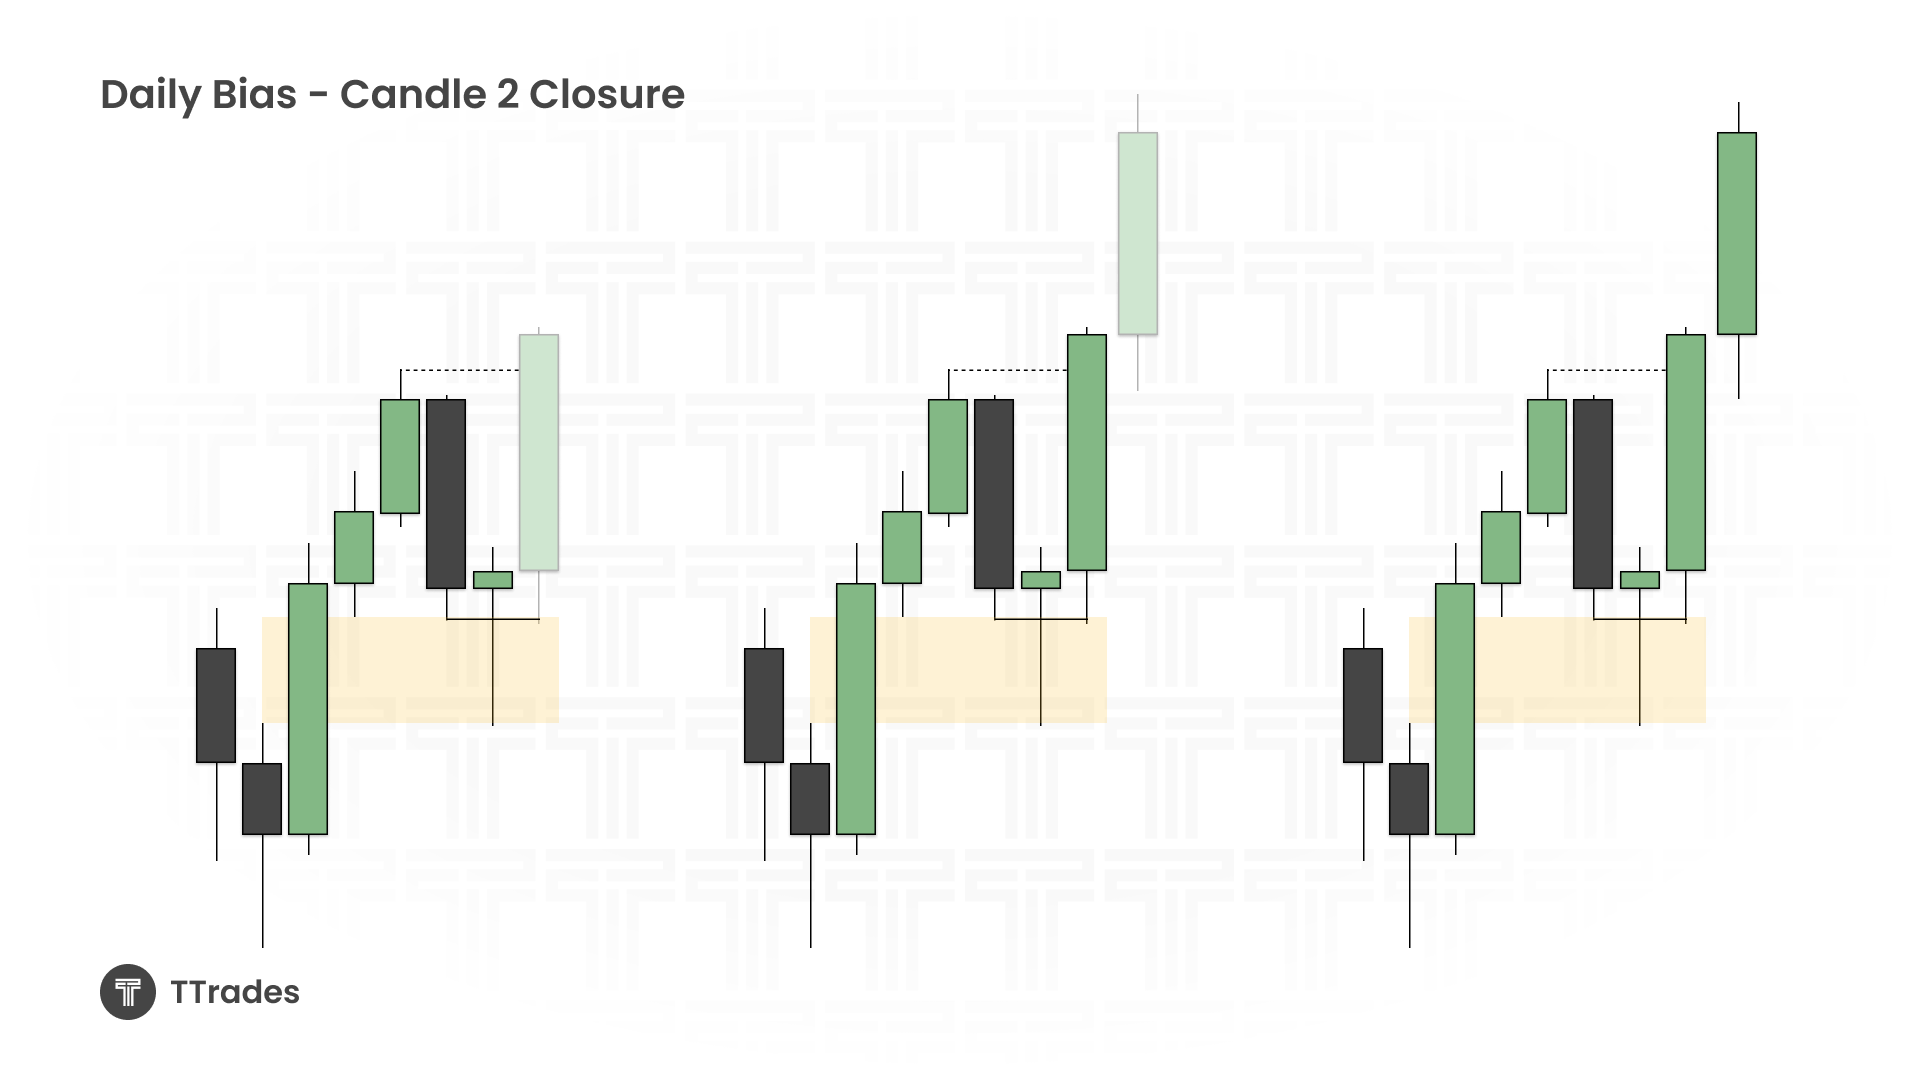
A Candle 2 closure happens when price:
- Sweeps the previous candle’s low or high
- Then closes back inside the previous candle’s range.
This indicates a reversal followed by potential expansion.
If Candle 2 closes strongly, traders can anticipate Candle 3 expansion. If Candle 3 closes above Candle 2’s high, then Candle 4 continuation becomes possible as well.
Why Change in State of Delivery Matters
A Candle 2 closure alone is not enough.
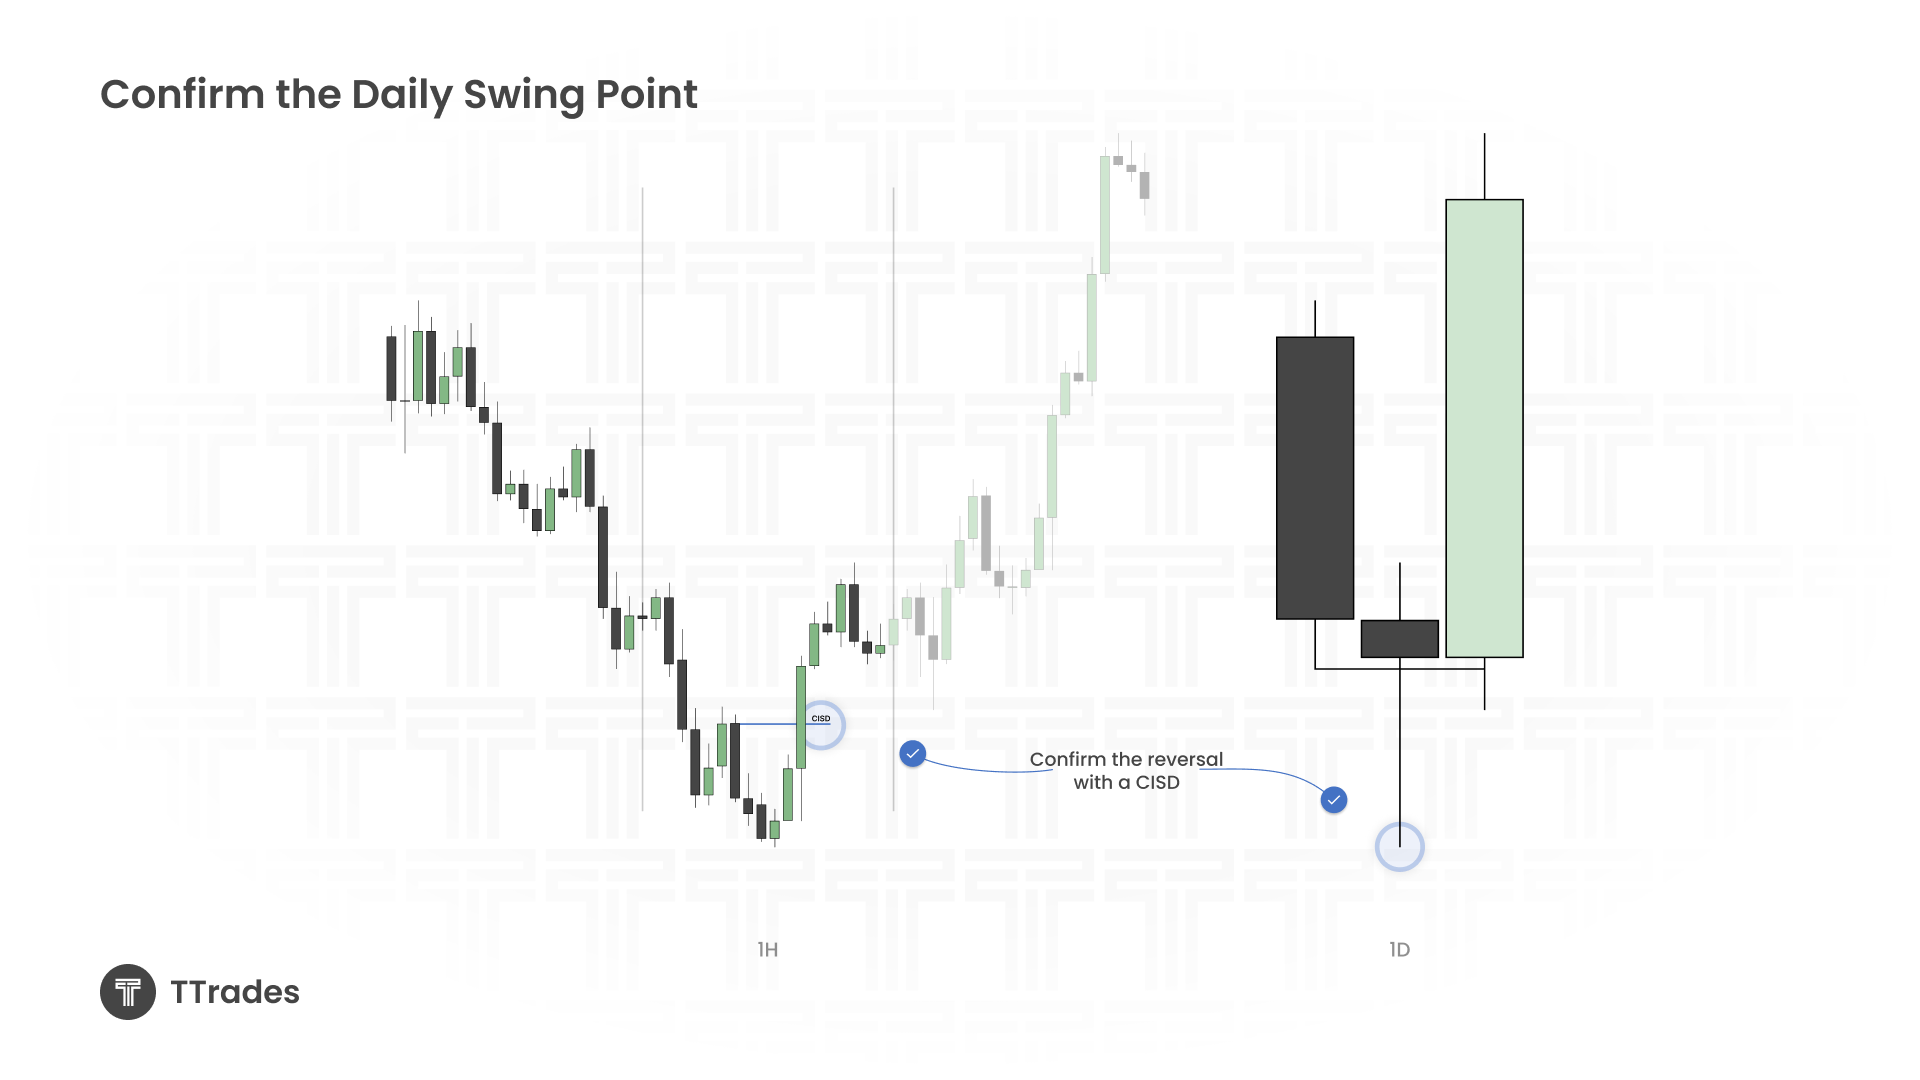
Before taking a trade, the model requires confirmation through a Change in the State of Delivery (CISD).
This confirms that market structure is reversing.
The process is:
- Identify the low or high
- Find the series of candles responsible for creating that swing
- Wait for price to close through that series of candles
Once price closes through it, the swing point becomes confirmed and protected.
Without this confirmation, the setup is considered invalid.
What Is a Candle 3 Closure?
Sometimes Candle 2 fails to close properly.
In that case, traders wait for the next candle.
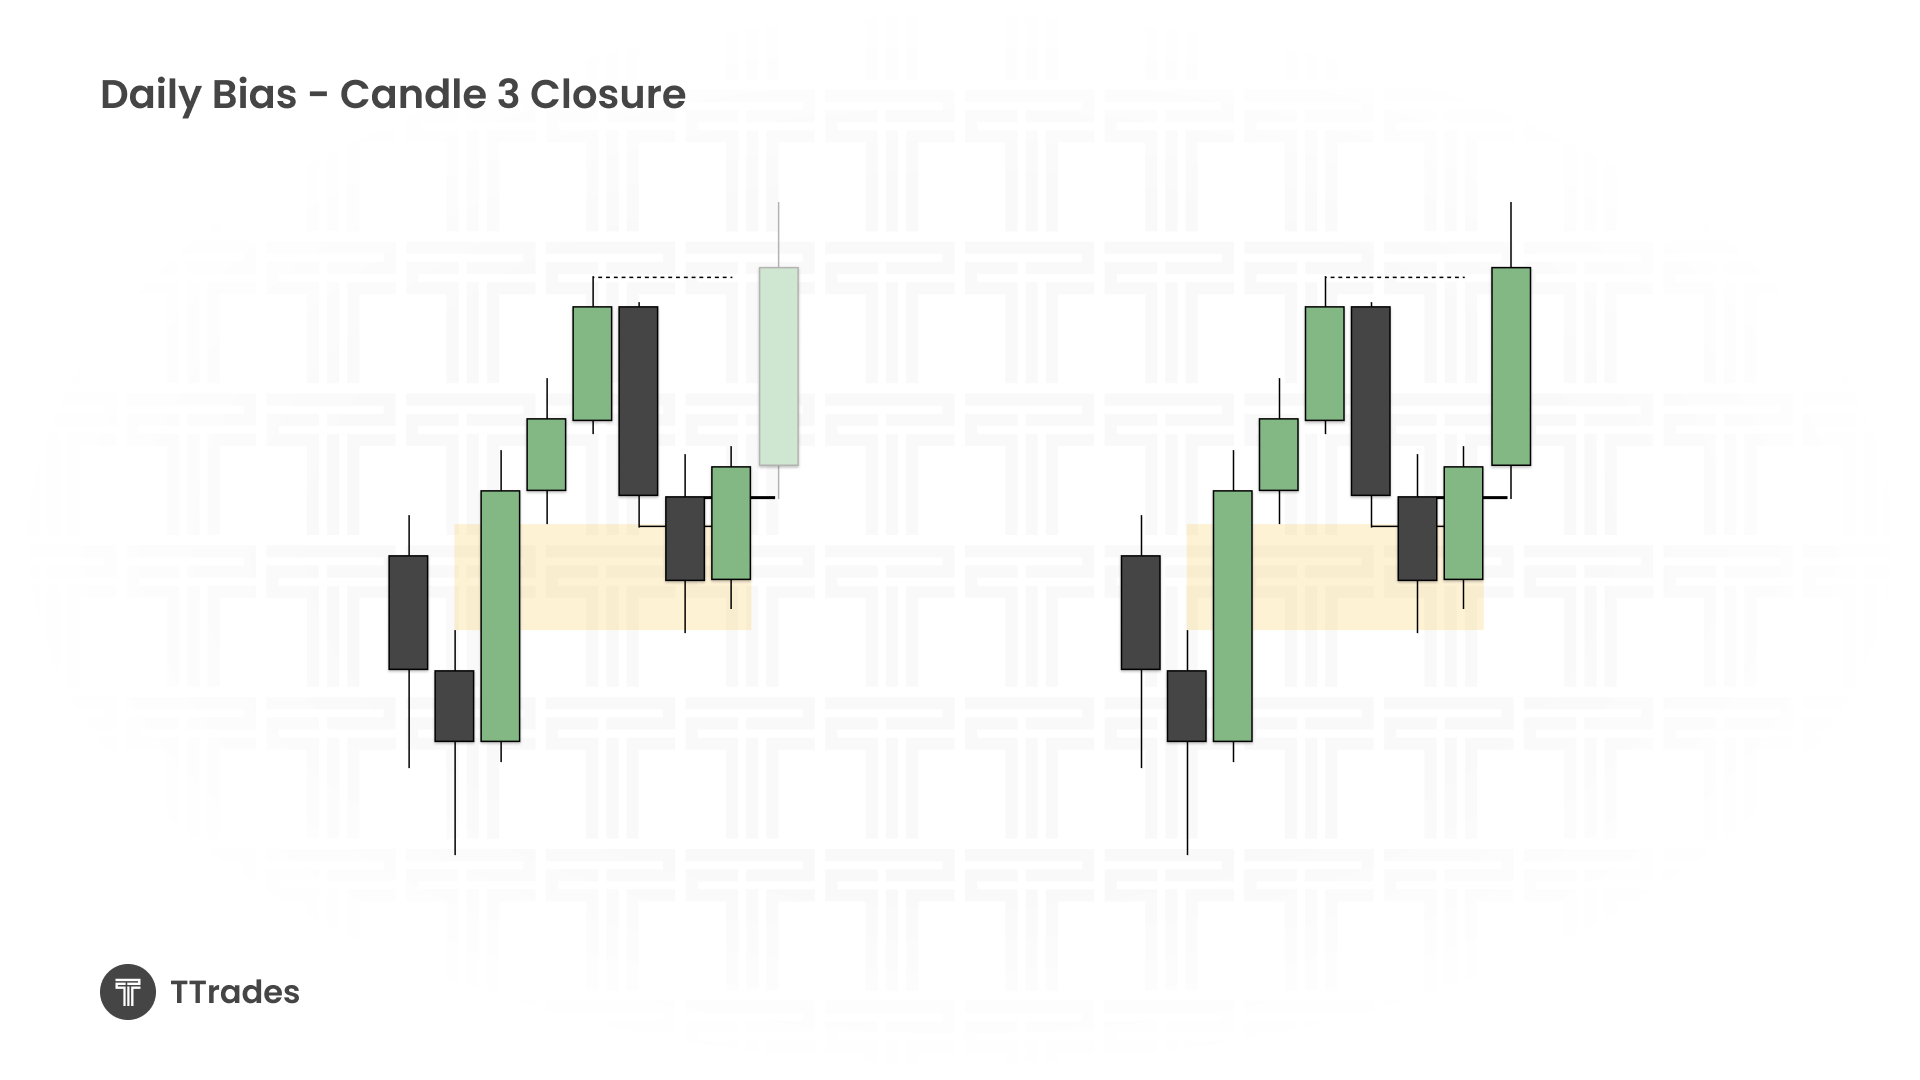
A Candle 3 closure occurs when:
- Candle 2 sweeps liquidity but fails to close inside the previous candle
- Candle 3 engulfs Candle 2 and closes strongly through its body
This gives confirmation of reversal and continuation.
With a Candle 3 closure, traders typically look to trade Candle 4 expansion.
Again, CISD confirmation is required before entering.
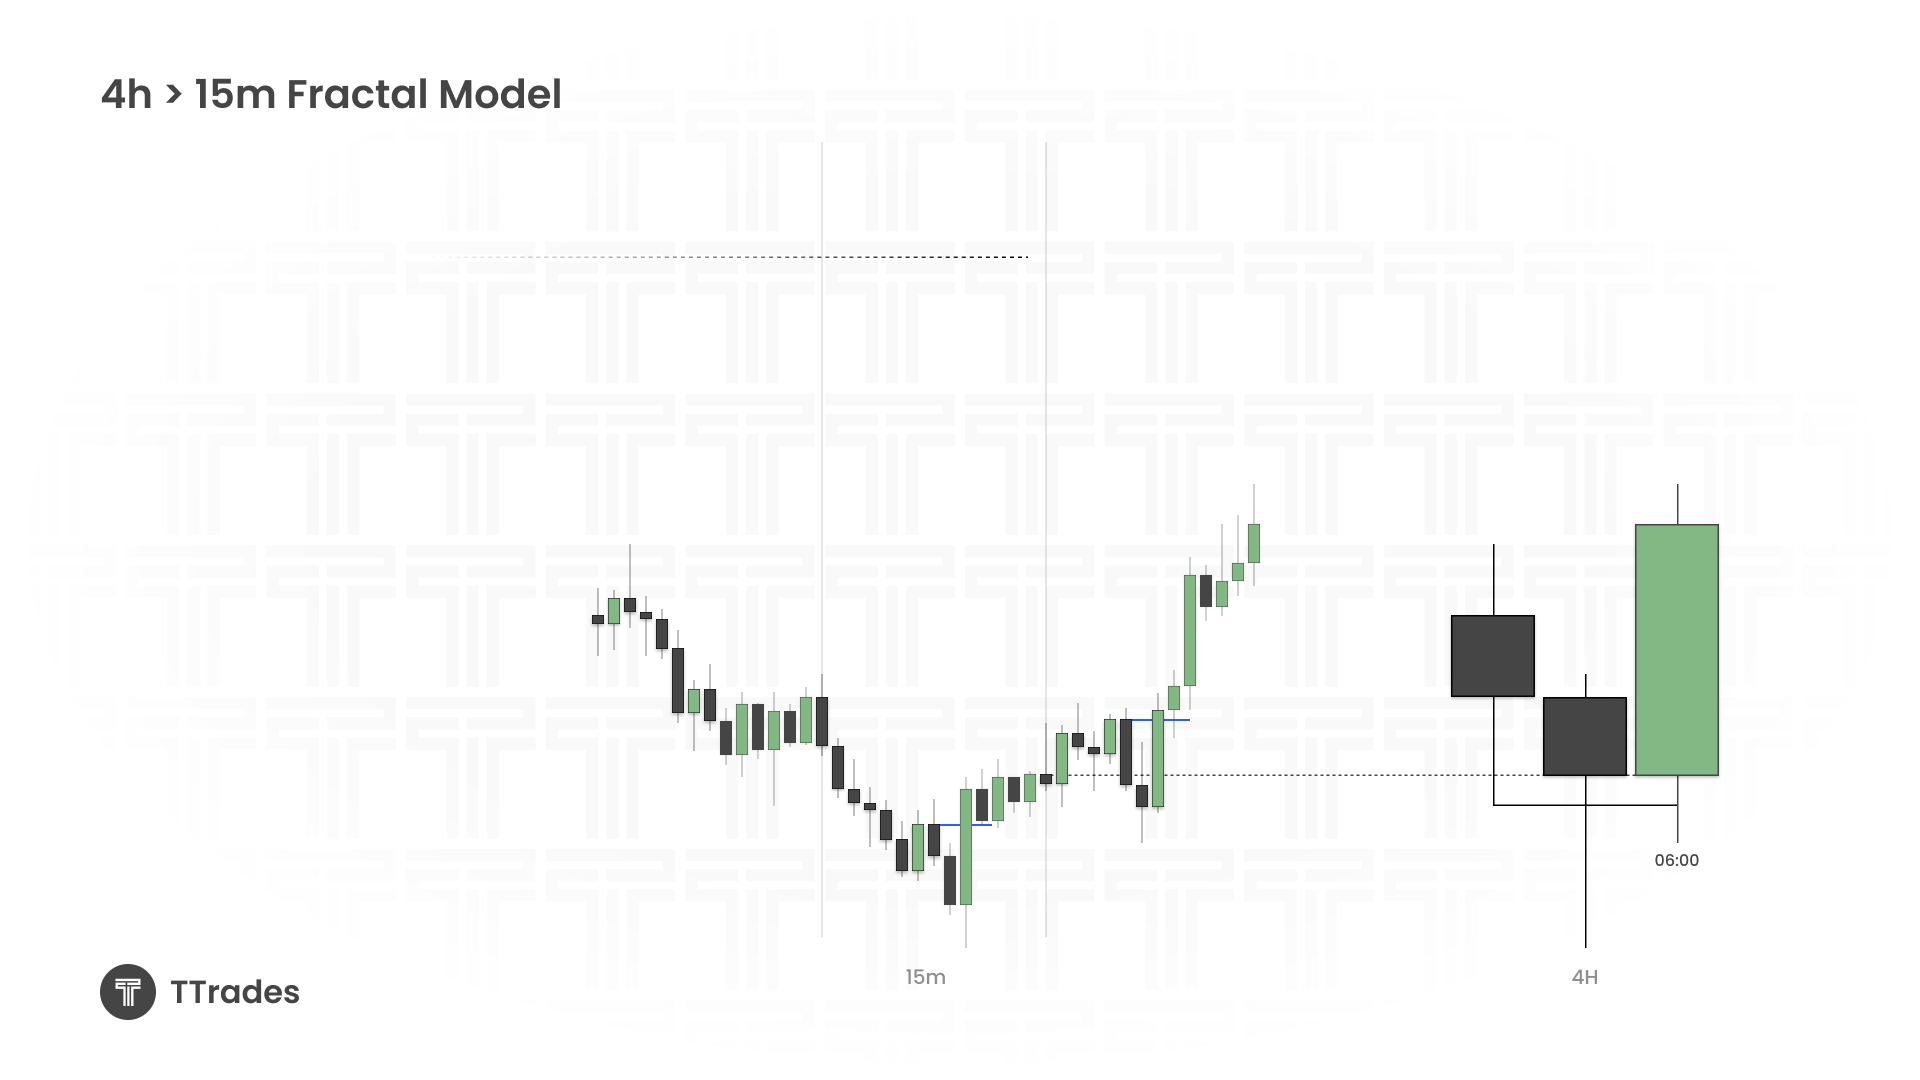
Multiple Timeframe Fractal Analysis
Once the daily bias is established, the trader moves down to the 4-hour chart.
The same exact logic is repeated.
The process becomes:
- Daily expansion bias
- 4-hour Candle 2 or Candle 3 setup
- 15-minute continuation entry
The strategy is essentially aligning the fractal model across timeframes.
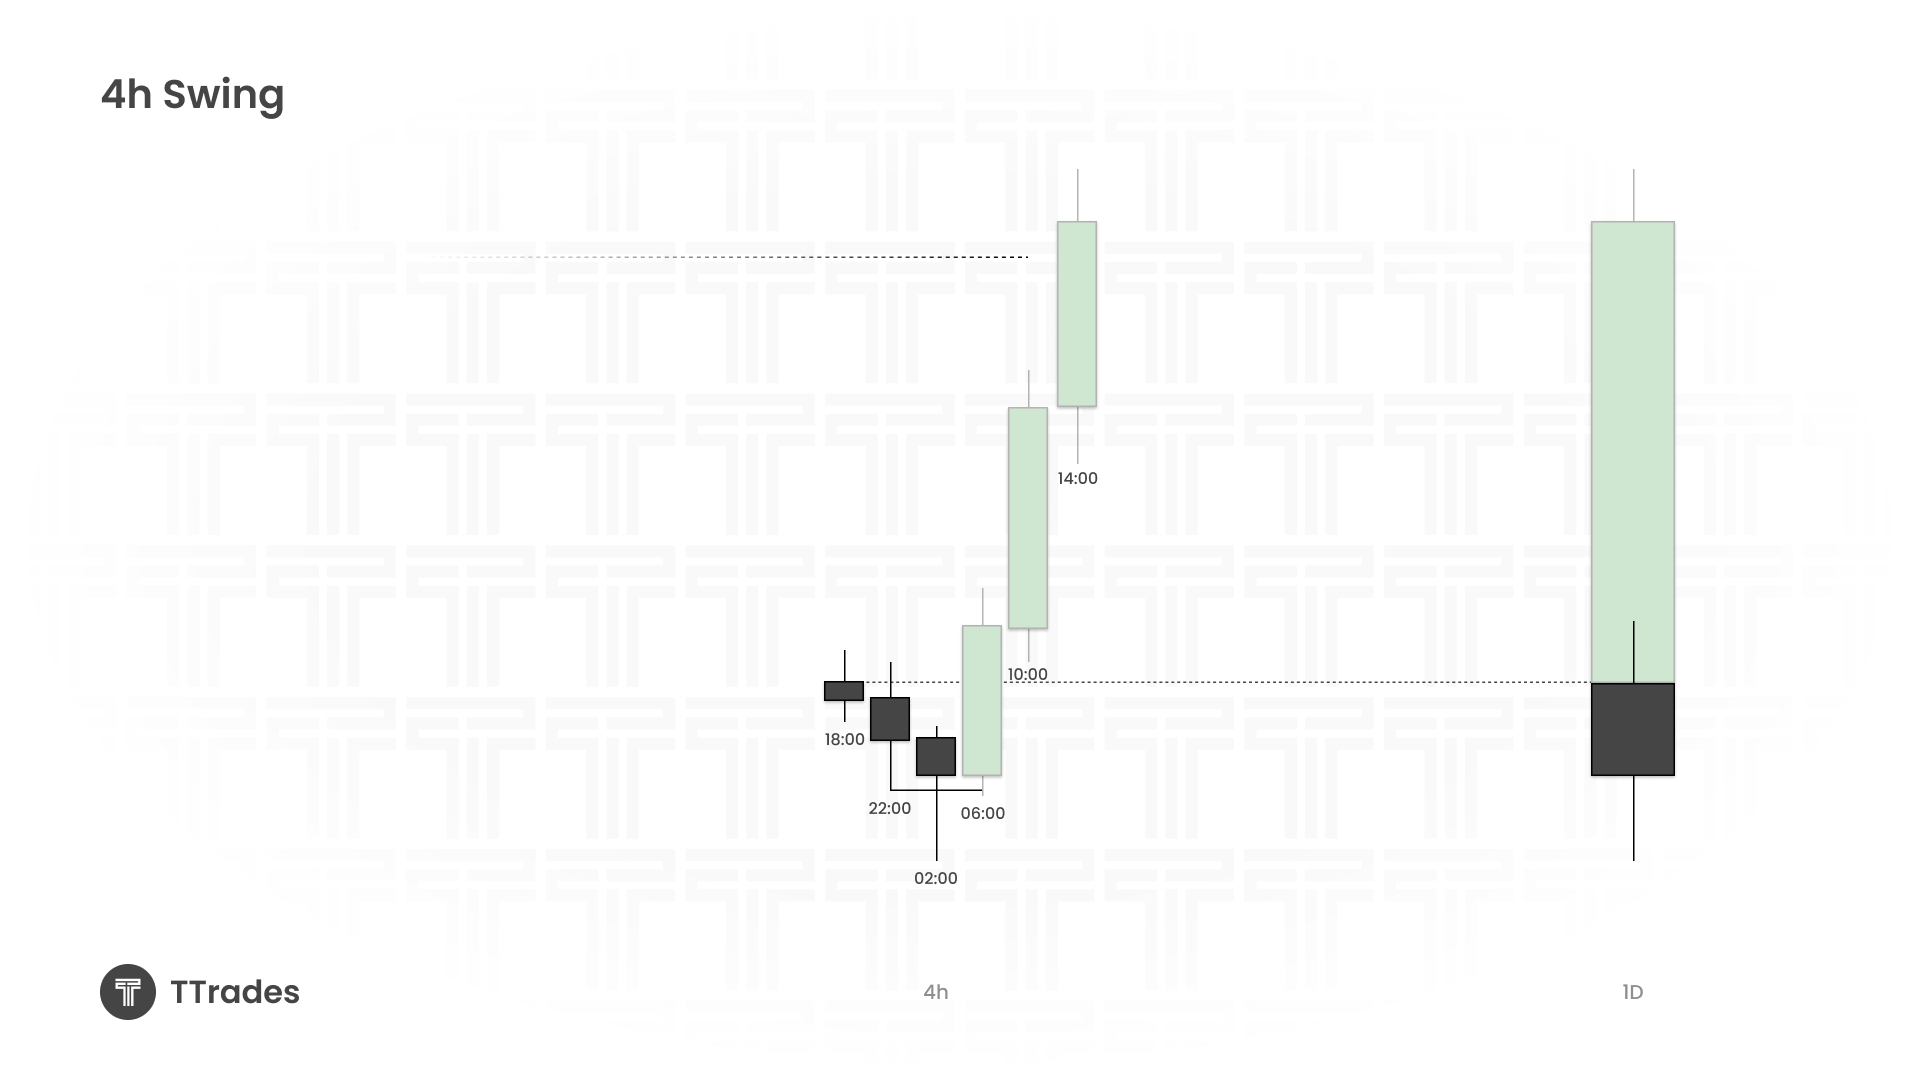
For bullish setups, the ideal sequence is:
- Daily candle opens
- Price trades lower first
- Lower wick forms
- Market begins expanding higher
The 4-hour timeframe is used to identify the swing point forming that wick.
Finding the Protected Swing
Once a 4-hour setup forms, traders move down to the 15-minute chart.
A protected swing forms when:
- Price sweeps highs/lows or enters a point of interest
- Then closes above the down-close candle series
Typical points of interest include:
- Fair Value Gaps
- Previous highs/lows
- Equal highs/lows
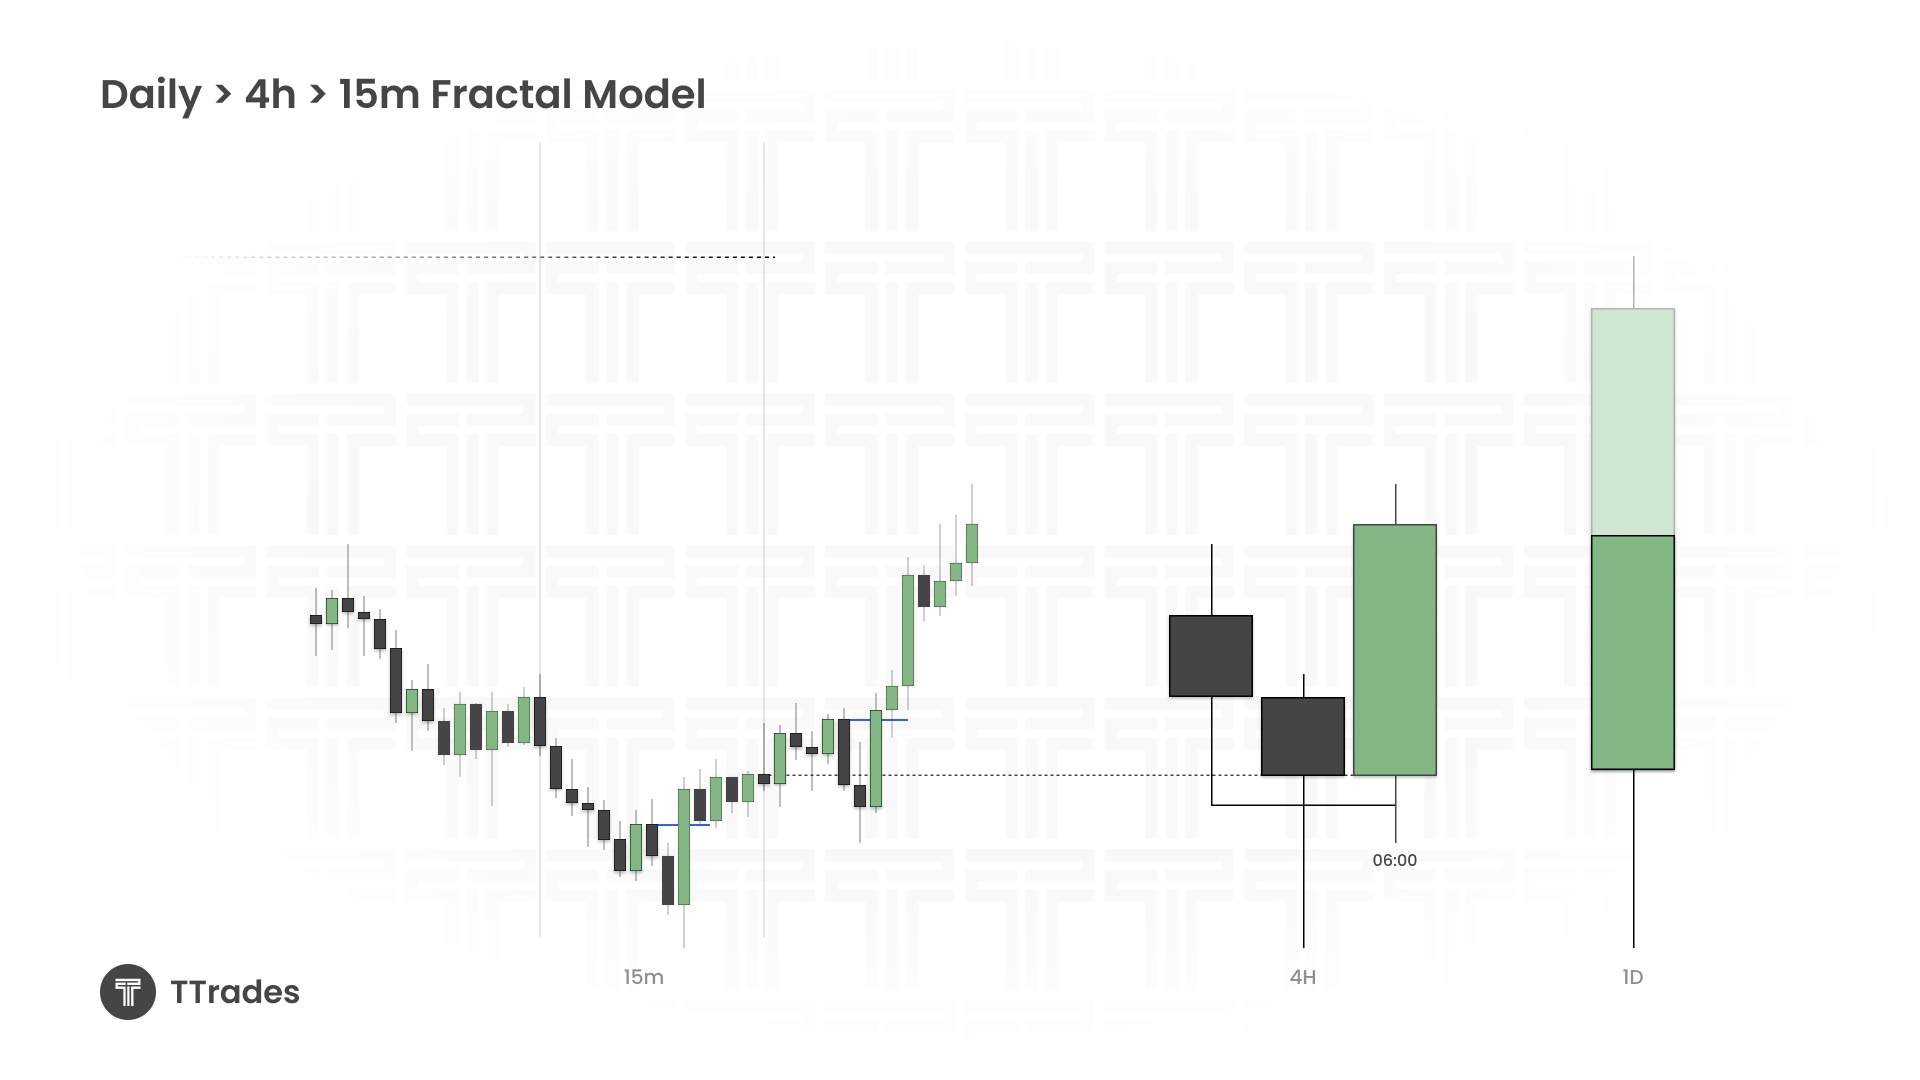
The Goal of the Entire Model
The objective is to align expansion across multiple timeframes.
The ideal setup looks like this:
- Daily Candle 3 expansion
- 4-hour Candle 3 expansion
- 15-minute continuation entry
When all timeframes align, price tends to trend cleanly with displacement.
This creates opportunities for:
- Tight stop losses
- High reward-to-risk trades
- Positional entries that can run throughout the day
Understanding Continuation Entries
There are generally two ways to enter.
The first is the reversal entry:
- Enter directly after liquidity sweep
- Wider stop loss
- Earlier participation
The second is the continuation entry:
- Wait for structure confirmation
- Smaller stop loss
- Better confirmation
- Usually cleaner execution
Continuation entries are often preferred because they align with confirmed market structure.
Why the Daily Candle Is So Important
One of the biggest concepts in this model is understanding how a daily candle forms.
A bullish daily candle often follows this sequence:
- Open
- Sweep lower
- Form low of day
- Expand higher
- Close near highs
The trader’s job is to identify when the lower wick is likely complete.
The 4-hour swing helps confirm this.
Then the 15-minute chart provides the actual execution.
Final Thoughts
This model is essentially about trading expansion after confirmed swing points.
The structure is straightforward:
- Establish daily bias
- Confirm CISD
- Find 4-hour swing points
- Execute on the 15-minute continuation
Instead of chasing entries, the trader waits for all timeframes to align together.
Sometimes the daily setup exists, but the 4-hour swing never forms. In those cases, the correct trade is no trade at all.
The cleanest setups happen when:
- Daily expansion
- 4-hour expansion
- 15-minute continuation
all align in the same direction.
That alignment is what creates the strongest intraday opportunities.