
Introduction
If you want to improve your market timing, you need to stop treating every high and low as equal. Not every swing point matters. Some are noise and some are true decision points where reversals are likely to form.
In this guide, we will break down what a swing point is, how to distinguish a failure swing from a relevant swing, what valid separation looks like, and how to apply a fractal lookback period to any timeframe. By the end, you will know exactly where to focus when price approaches key levels.
What Is a Swing Point
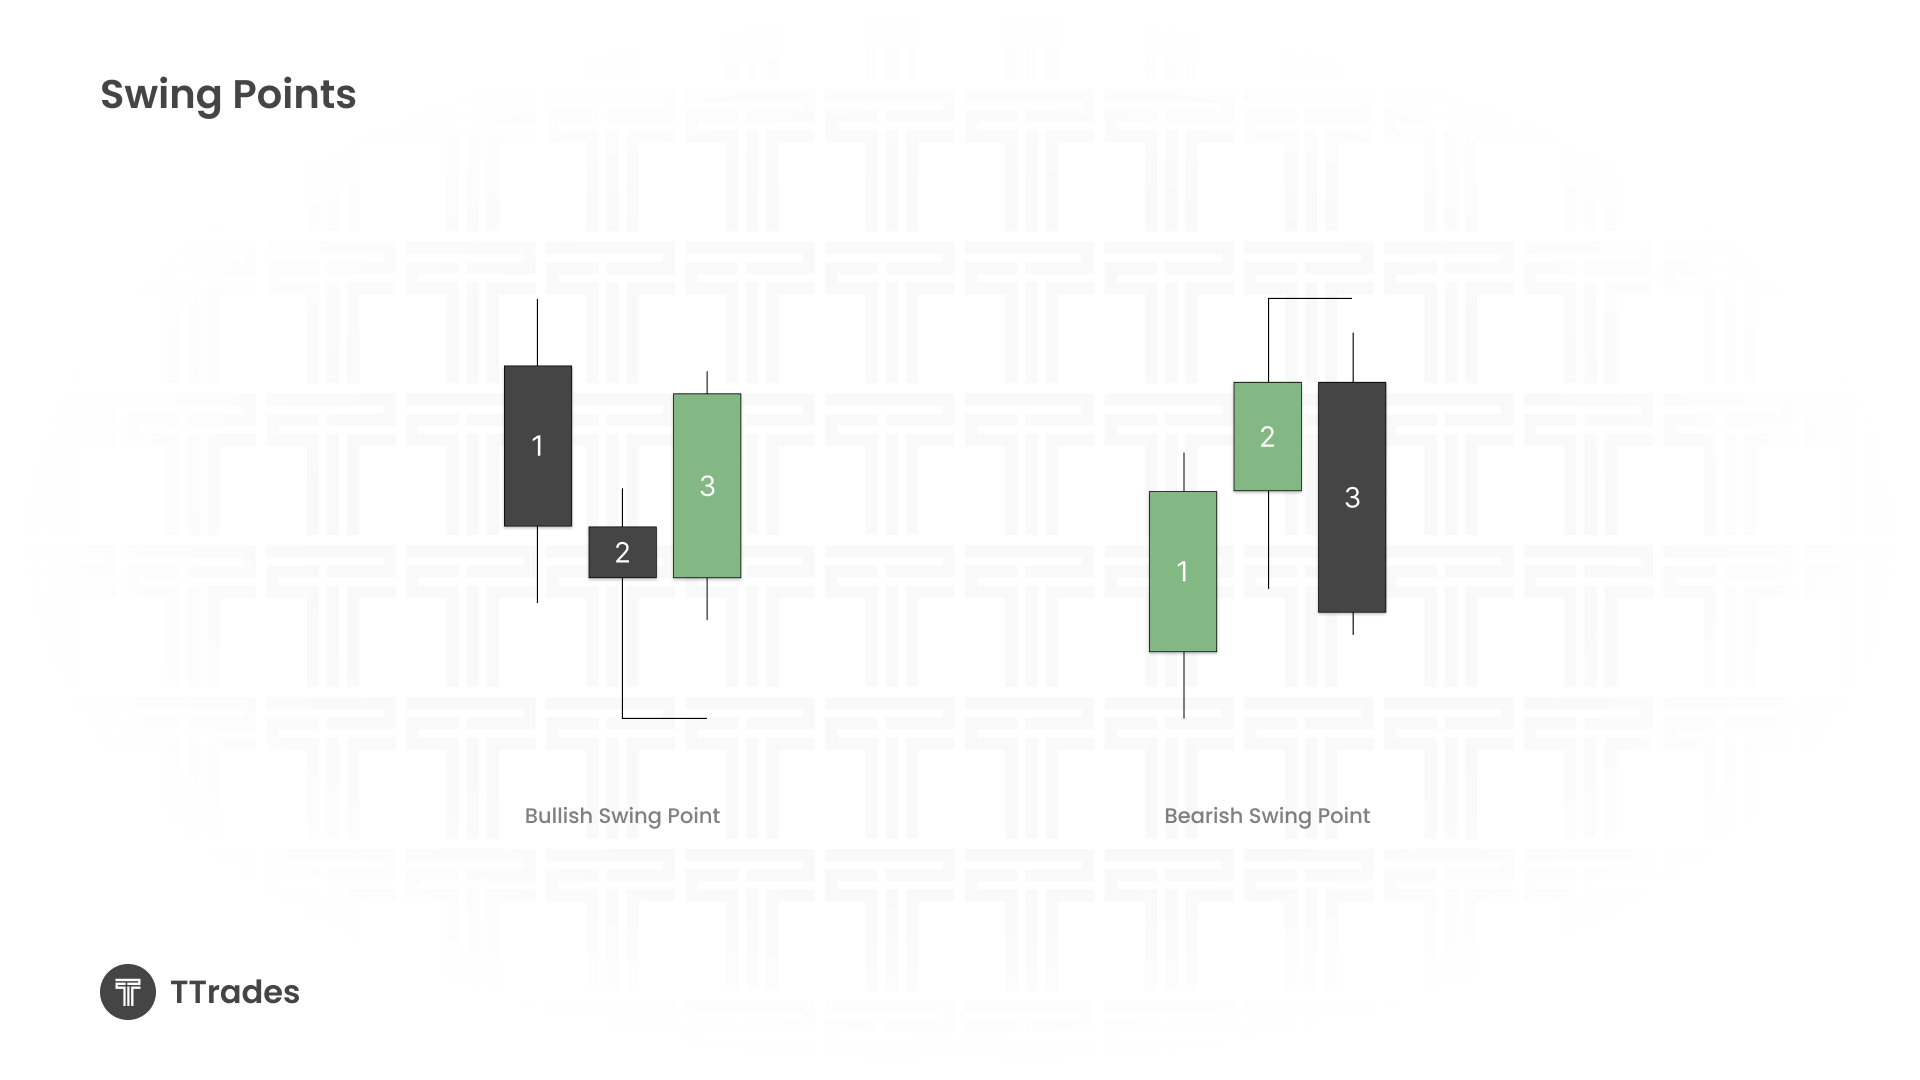
A swing point is a structural turning point in the market.
A bullish swing point forms when a candle prints a low and there is a higher low to its left and a higher low to its right.
A bearish swing point forms when a candle prints a high and there is a lower high to its left and a lower high to its right.
These are basic structural pivots. However, identifying them is only the first step. The next step is determining which ones actually matter.
Failure Swings vs Relevant Swings
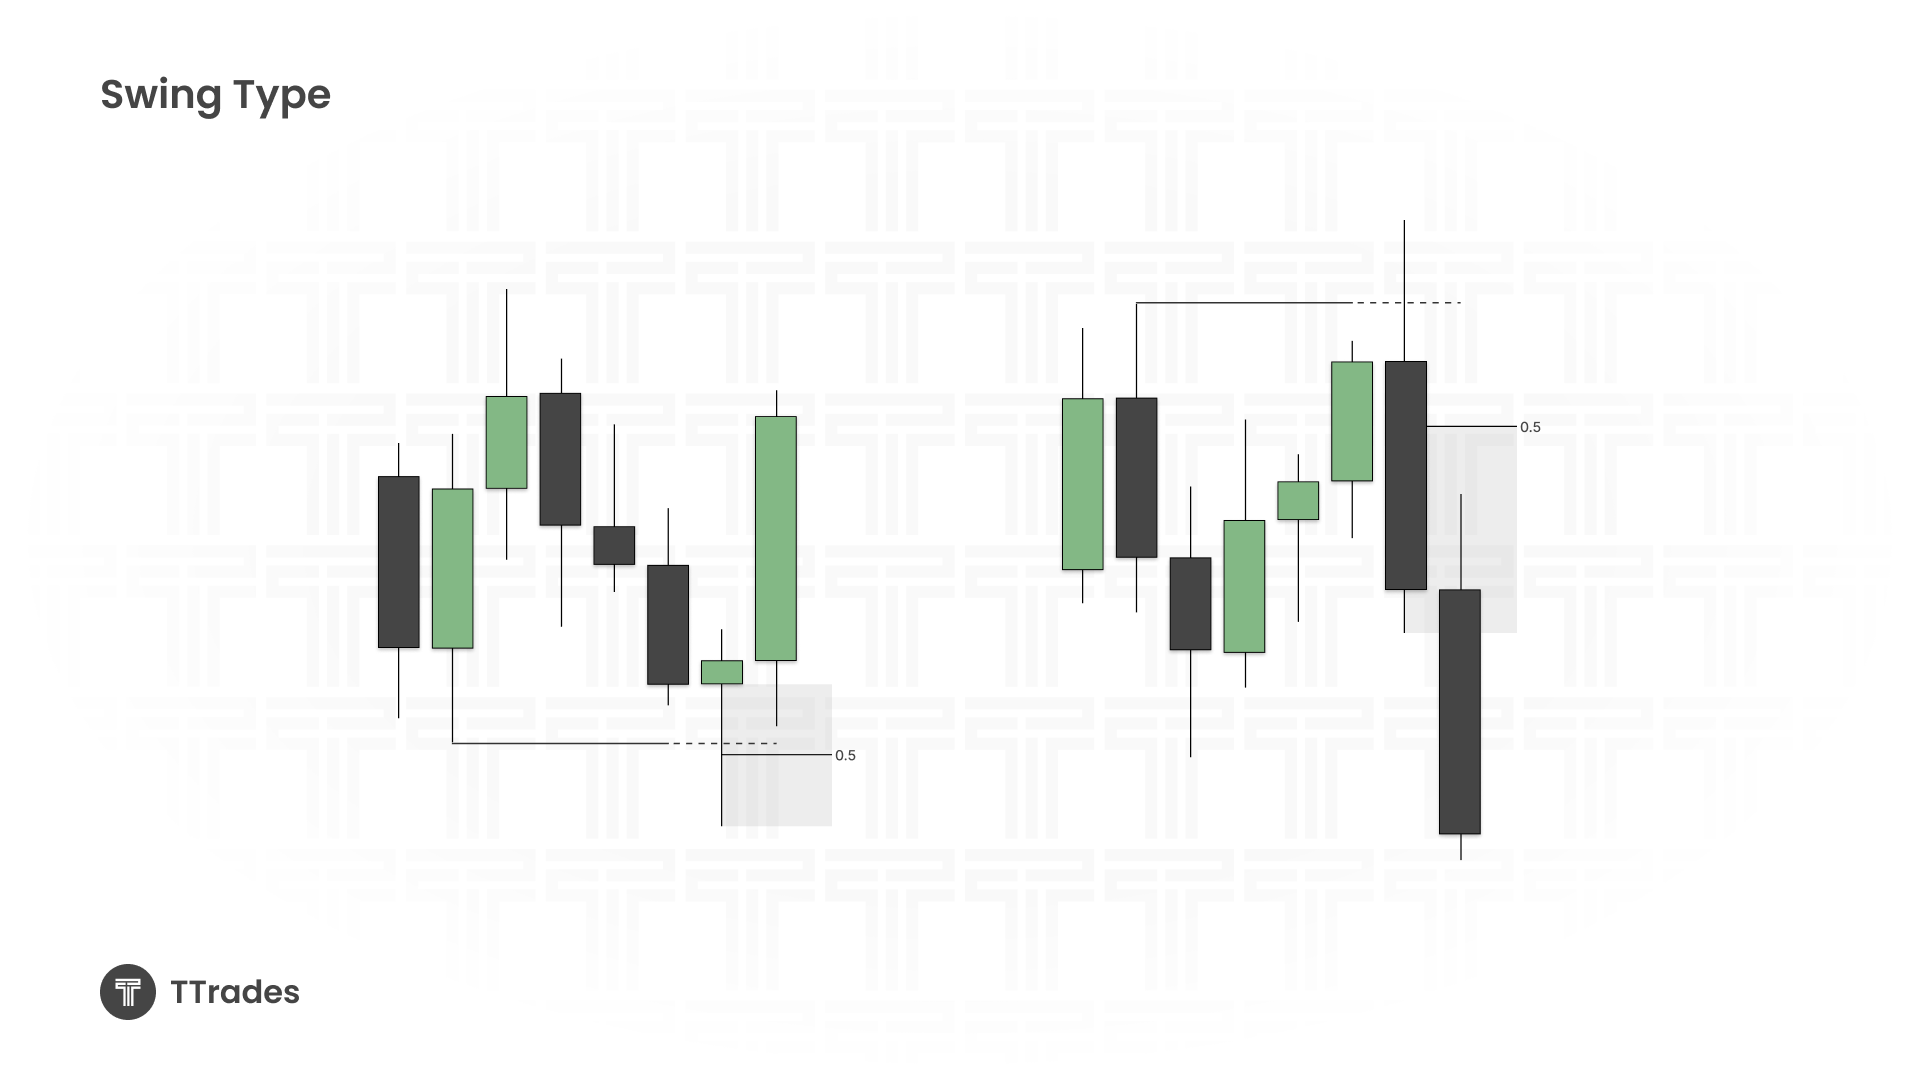
A failure swing is a swing point that does not represent a meaningful extreme. It usually forms too close to a prior high or low and lacks proper range separation.
For example, if price forms a low just above equal lows, or a high just below clustered highs, that swing is likely not significant. Liquidity is still resting beyond it, which means price is likely to trade through it before forming a true reversal.
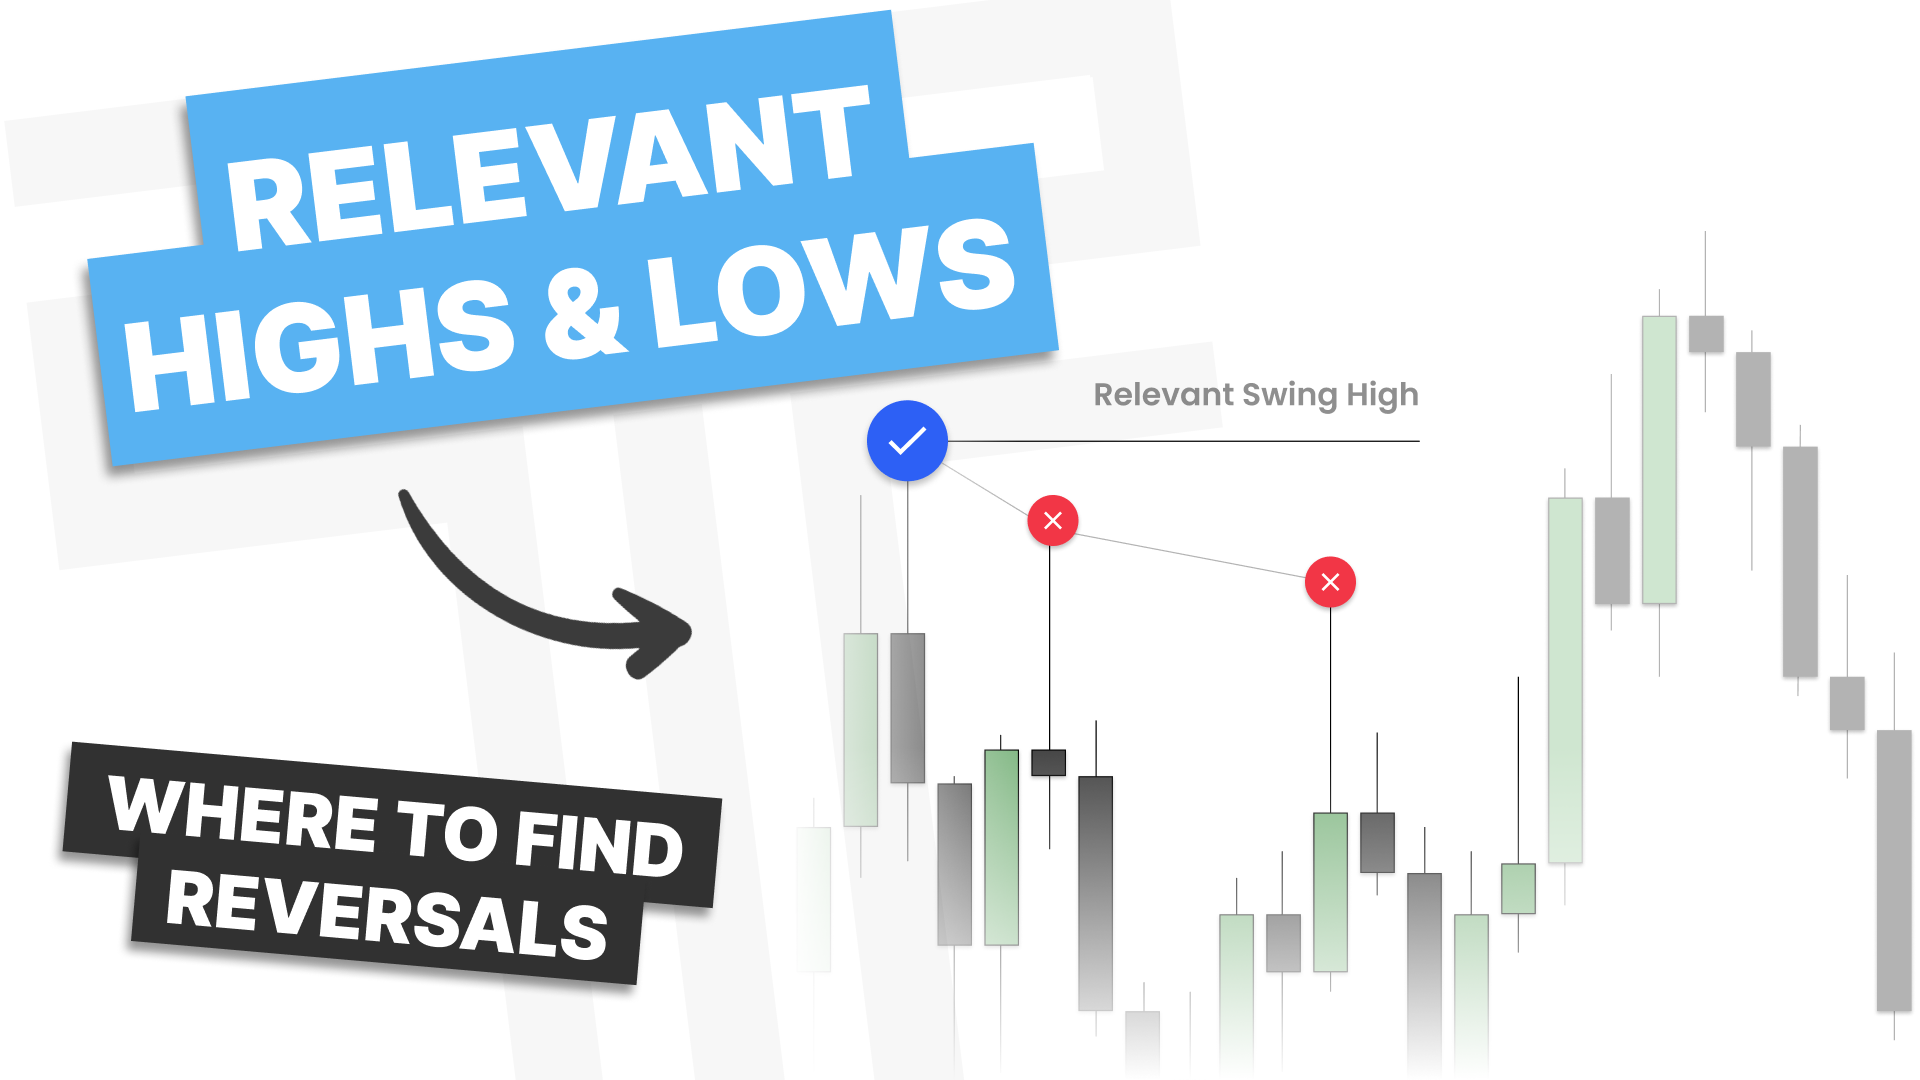
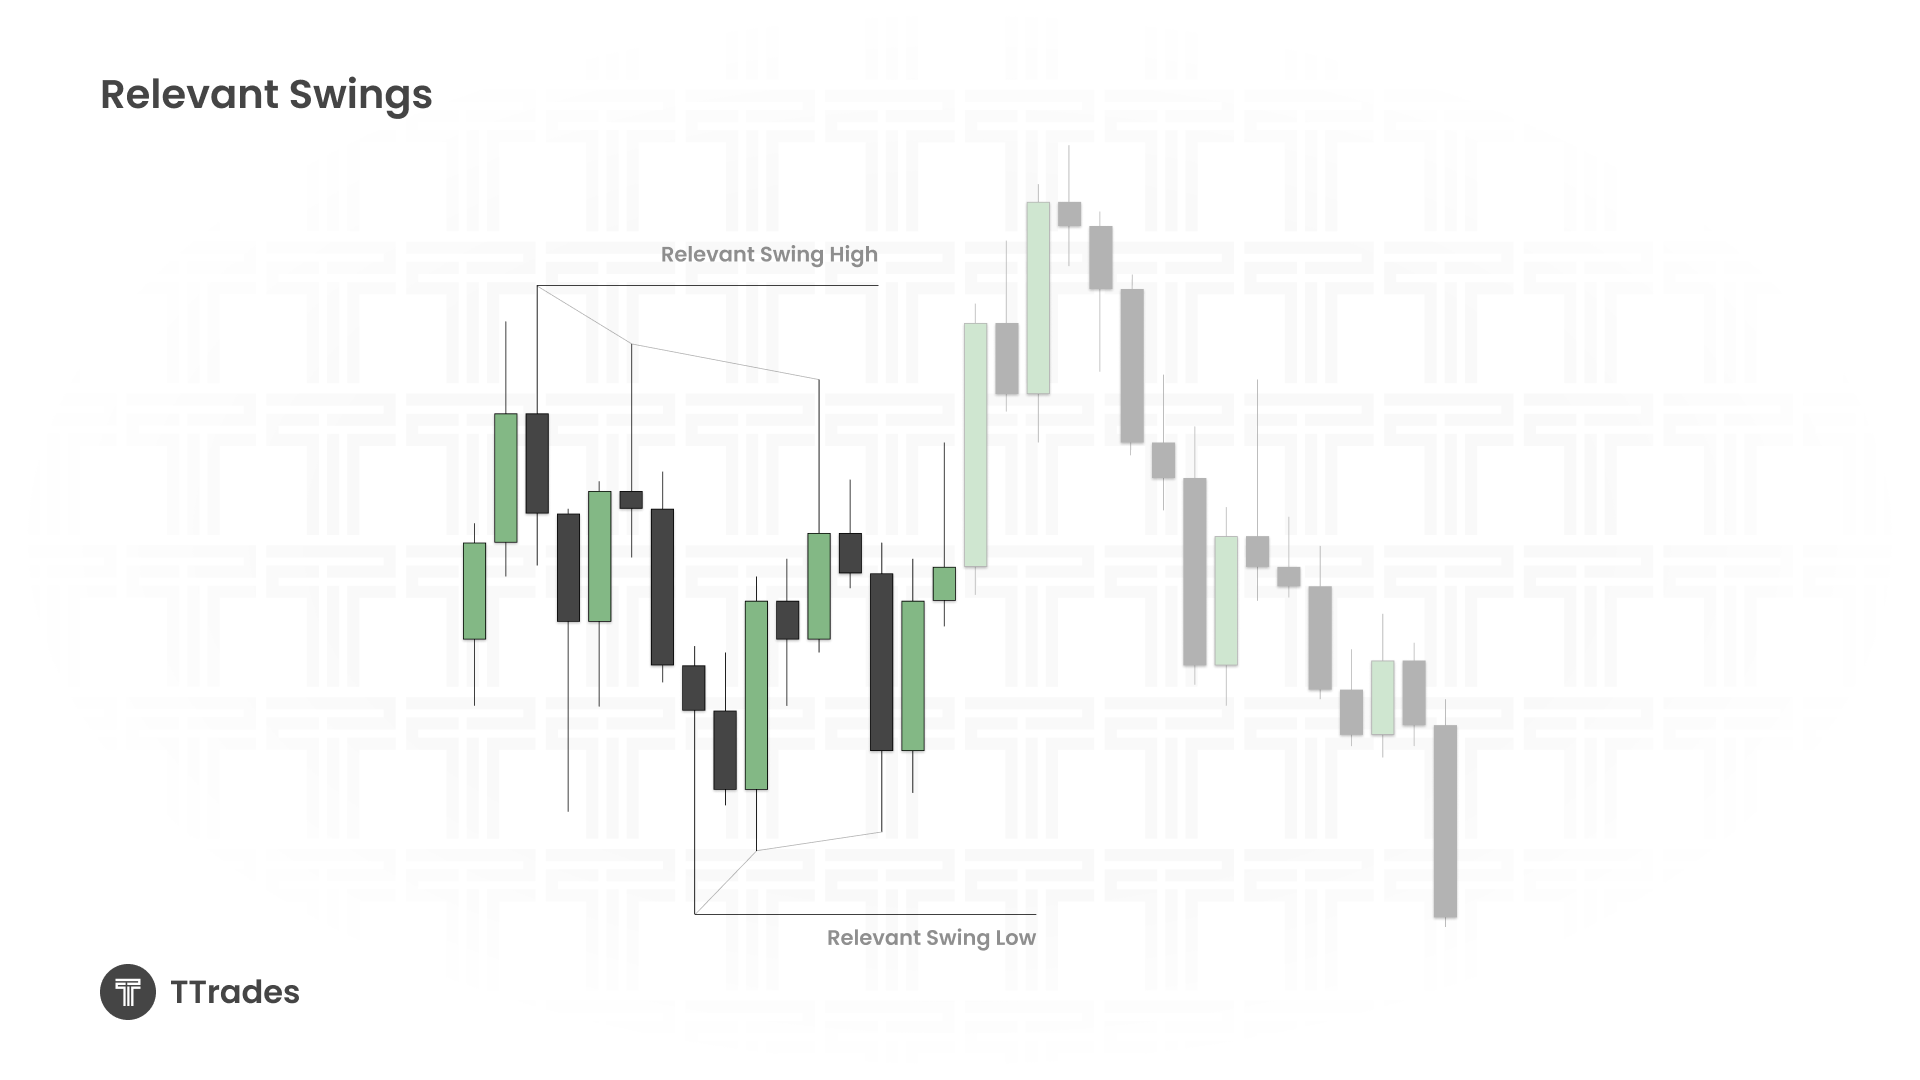
A relevant swing is different. It is the extreme of the move within the current context. There are no meaningful highs above it if it is a swing high, and no meaningful lows below it if it is a swing low. It stands apart from prior structure.
Relevant swings are the levels where reactions deserve your attention.
Understanding Valid Separation
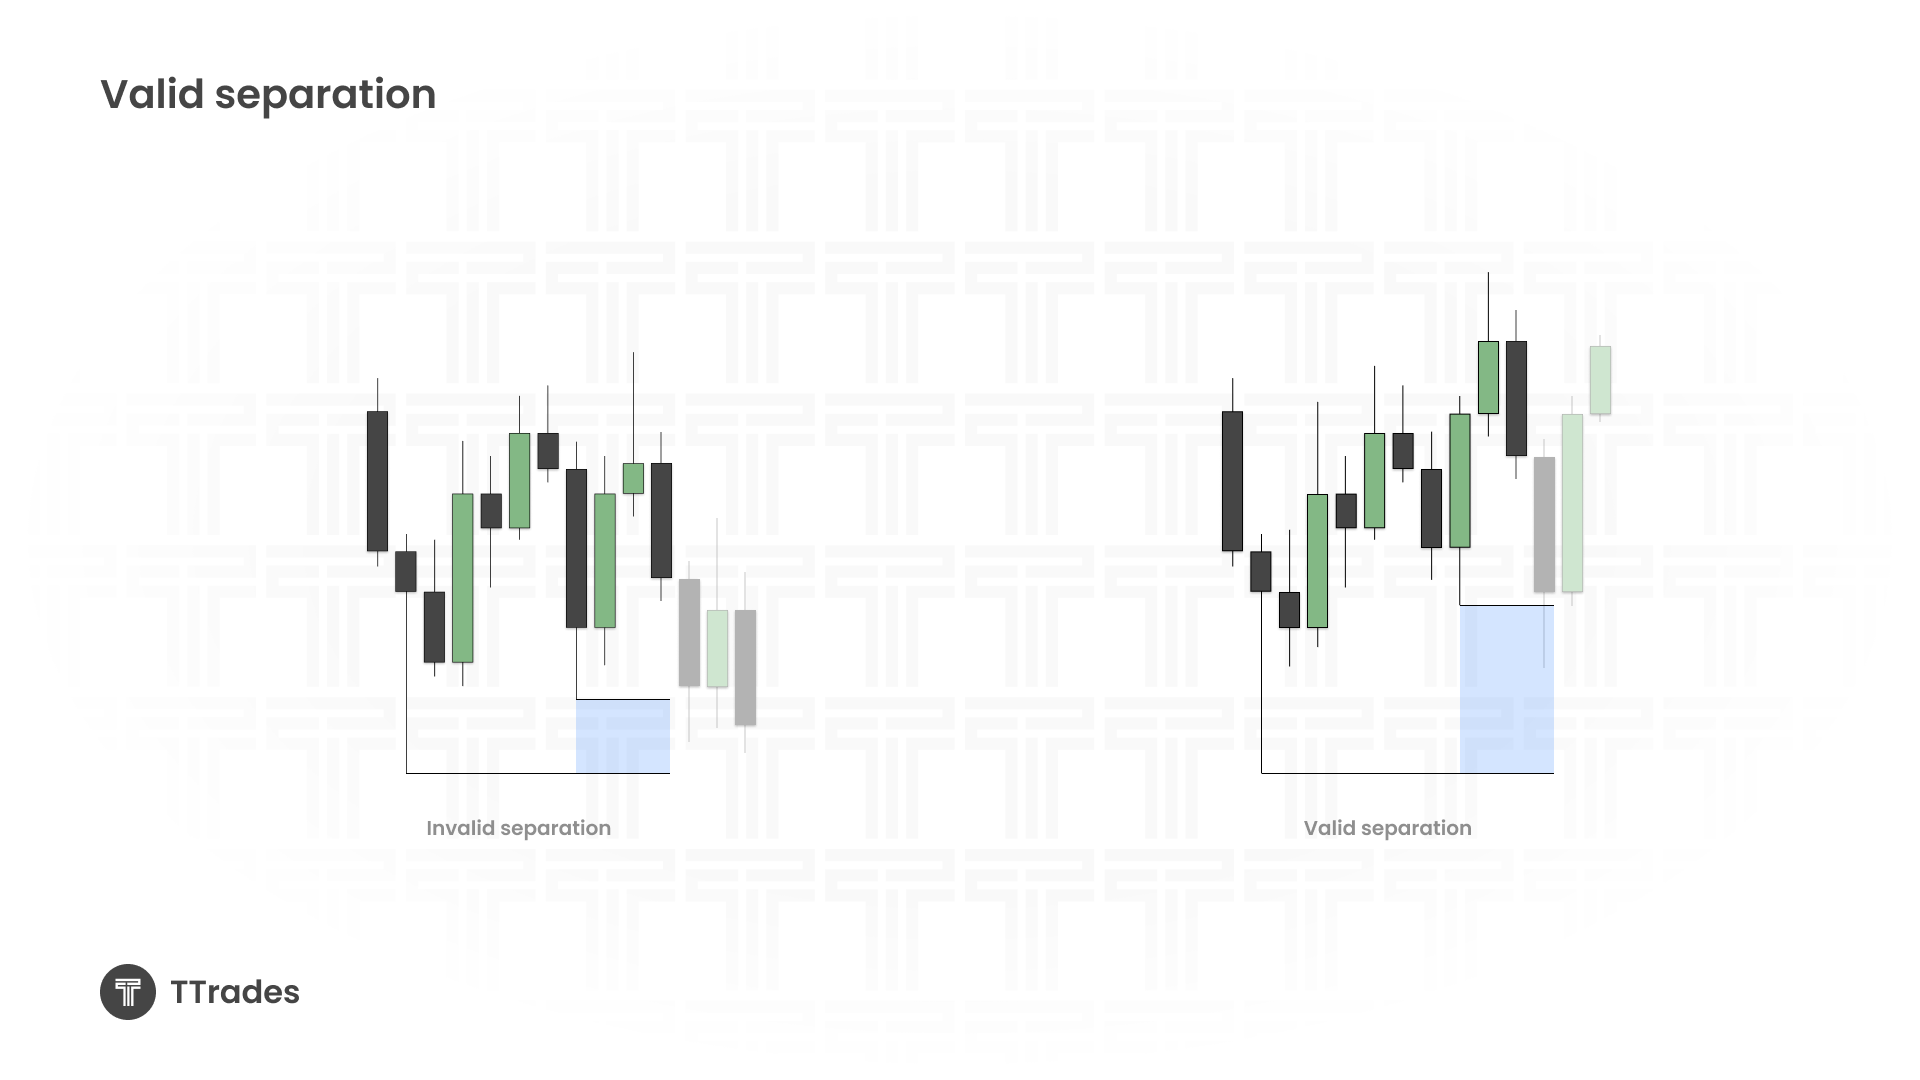
Valid separation is what gives a swing credibility.
If price forms a swing very close to a previous swing, there is little reason to trust a reversal there. The market has not created enough distance to make that level meaningful.
If price forms a swing and there is clear range expansion between it and the prior swing, that distance creates separation. When price revisits a level with strong separation, the reaction becomes more trustworthy.
There is no strict numerical formula for separation. It comes from experience and structural awareness. The key idea is simple. If it is too close, expect it to be taken. If it stands alone, respect it.
Where to Look for Reversals
When price trades into a relevant high or low, you are not entering blindly. You are observing how price behaves at that level.
You want to see whether price retraces, consolidates, or breaks through aggressively. If price fails to reverse at a relevant level, continuation becomes more likely.
If price reacts with a strong shift in momentum, such as a candle two or candle three closure or clear rejection of a wick or equilibrium level, that is when you can begin looking for structured entries.
Relevant levels are where your model should form. Random highs and lows should not dictate your decisions.
Breakout vs Manipulation
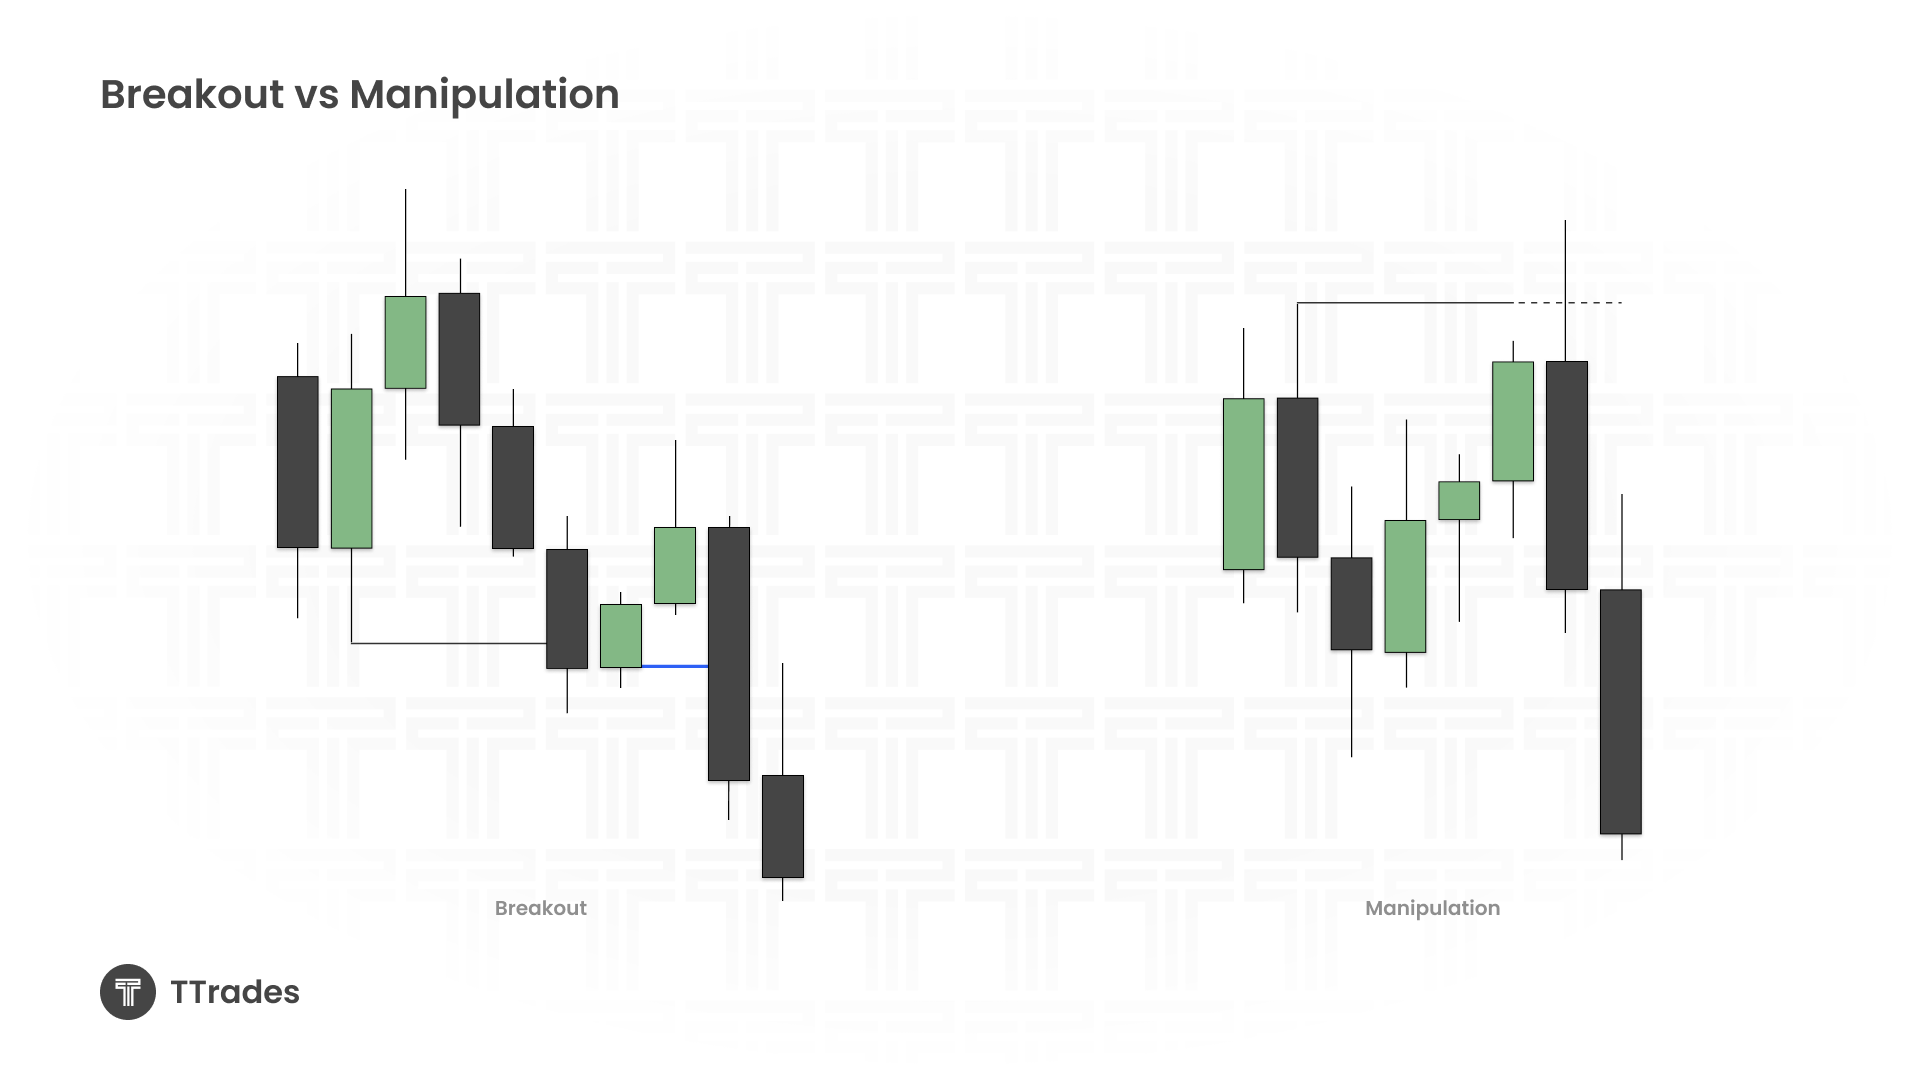
When price reaches a relevant swing, it will typically do one of two things.
It may sweep the level, trigger stops, and reverse sharply back into the range. This is manipulation. In this case, price often travels toward the opposite side of the range.
Or it may consolidate around the level and continue through it with strength. This is a breakout and suggests continuation in the direction of the move.
The difference lies in the quality of the reaction. Strong rejection favors reversal. Acceptance and continuation favor expansion.
The Fractal Lookback Window
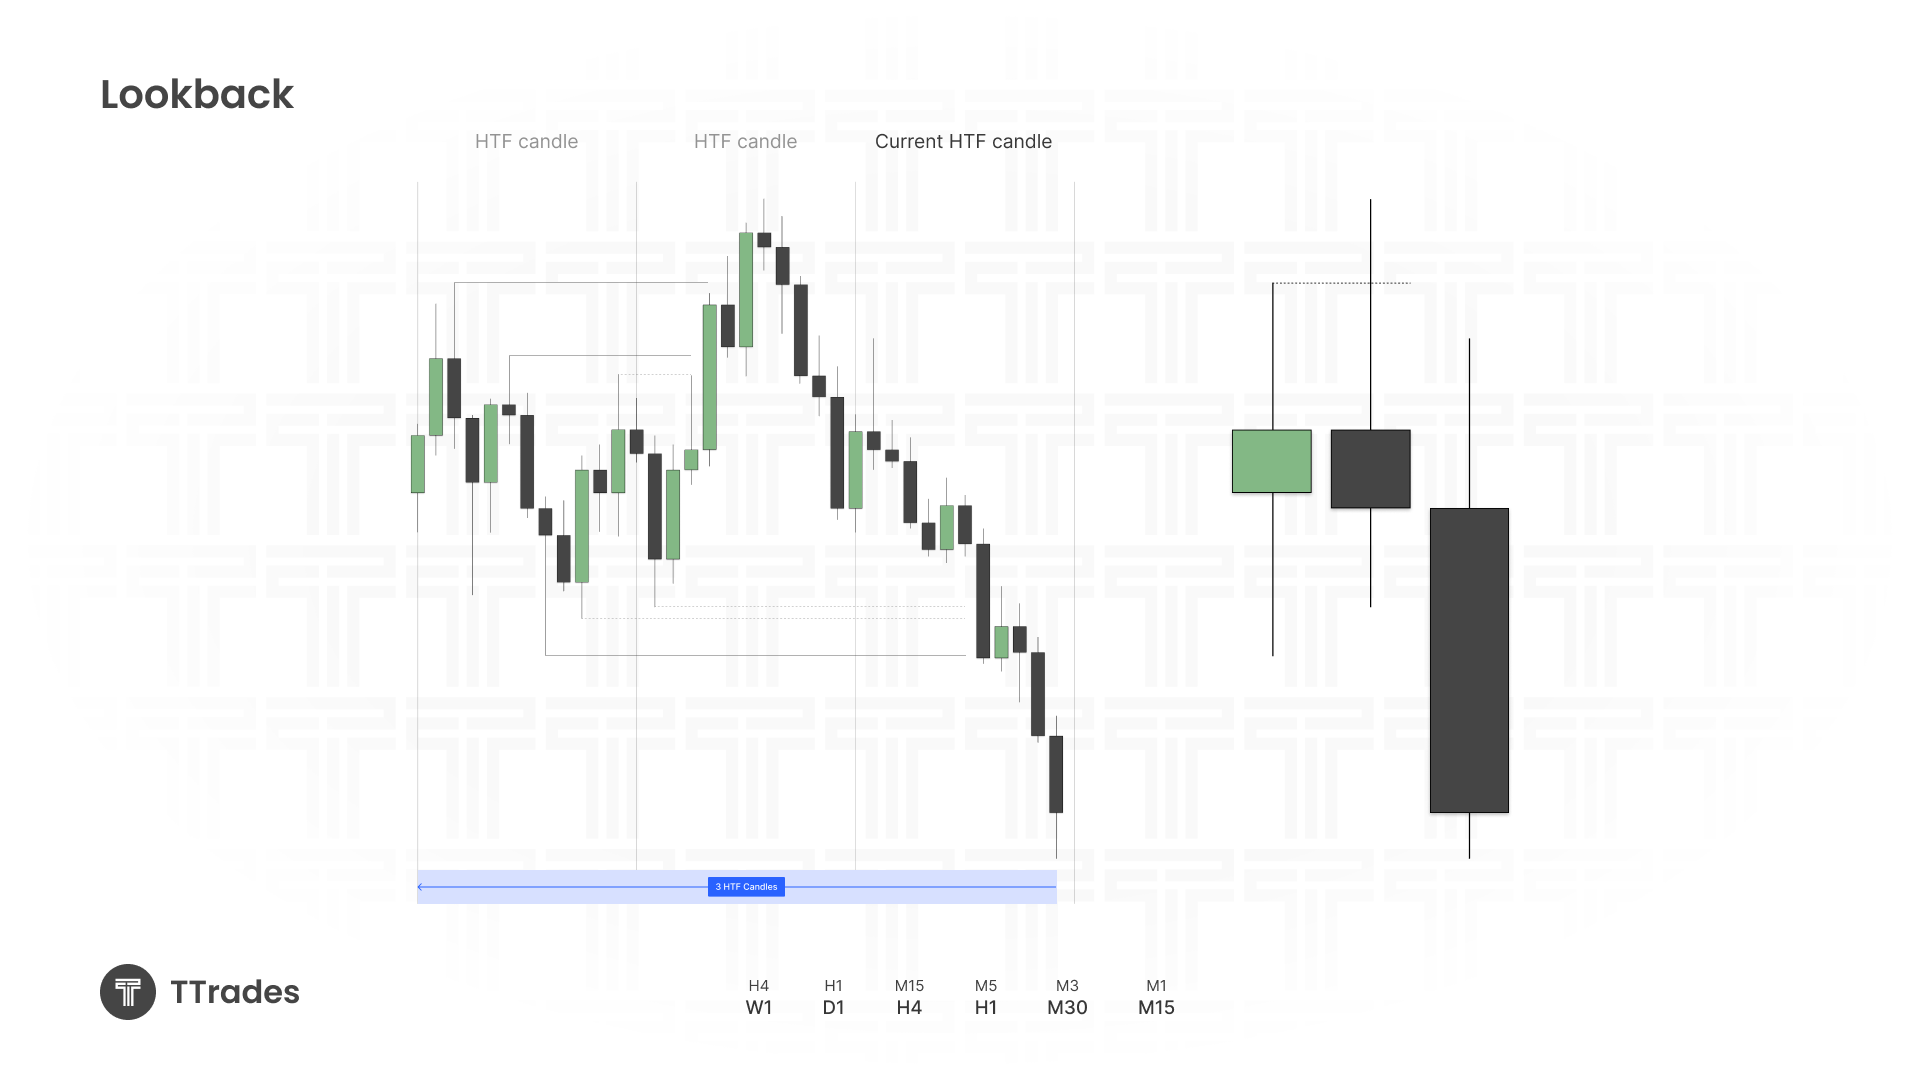
One of the most practical ways to define relevance is by using a higher timeframe lookback window. This is specific to the TTrades Fractal Model.
Instead of scrolling endlessly into the past, focus on the current higher timeframe and look back three higher timeframe candles including the current one. The highs and lows within that window are your relevant levels.
On the daily chart, this often means looking back three monthly candles. On the hourly chart, it may mean looking back three daily candles.
This approach keeps the concept fractal. You are not limiting it to one timeframe. You are applying the same structural logic everywhere.
Tracking Relevant Swings in Real Time
As price evolves, relevant swings will shift.
If a relevant high fails to produce a reversal, the next extreme becomes the new relevant high. The same applies to lows.
Failure swings often stack liquidity. Relevant swings mark true decision points. Over time, you will notice that markets reverse more consistently at clean extremes with proper separation than at clustered highs or lows.
You want liquidity stacked in your target direction, not behind your stop.
Final Thoughts
Understanding relevant highs and lows changes how you read structure. Instead of reacting to every swing, you begin filtering out noise and focusing only on meaningful extremes.
The concept becomes powerful through repetition. Mark your highs and lows. Evaluate separation. Identify the true extremes within your three candle higher timeframe window.
Ask yourself whether a level is actually relevant or simply a failure swing waiting to be taken.
That shift in perspective builds structural confidence and improves decision making.