Introduction
Liquidity is one of the most important concepts in trading, yet it’s often misunderstood. In this blog, we’re going to break down buy side liquidity, sell side liquidity, and how they relate to swing points, old highs and lows, equal highs and equal lows, and key time based liquidity levels. The goal is to help you clearly see where liquidity is resting and why price is naturally drawn to those areas.
What Are Swing Points and Why They Matter
Before we talk about liquidity, we need to understand swing points, because swing points are how we identify where liquidity is resting.
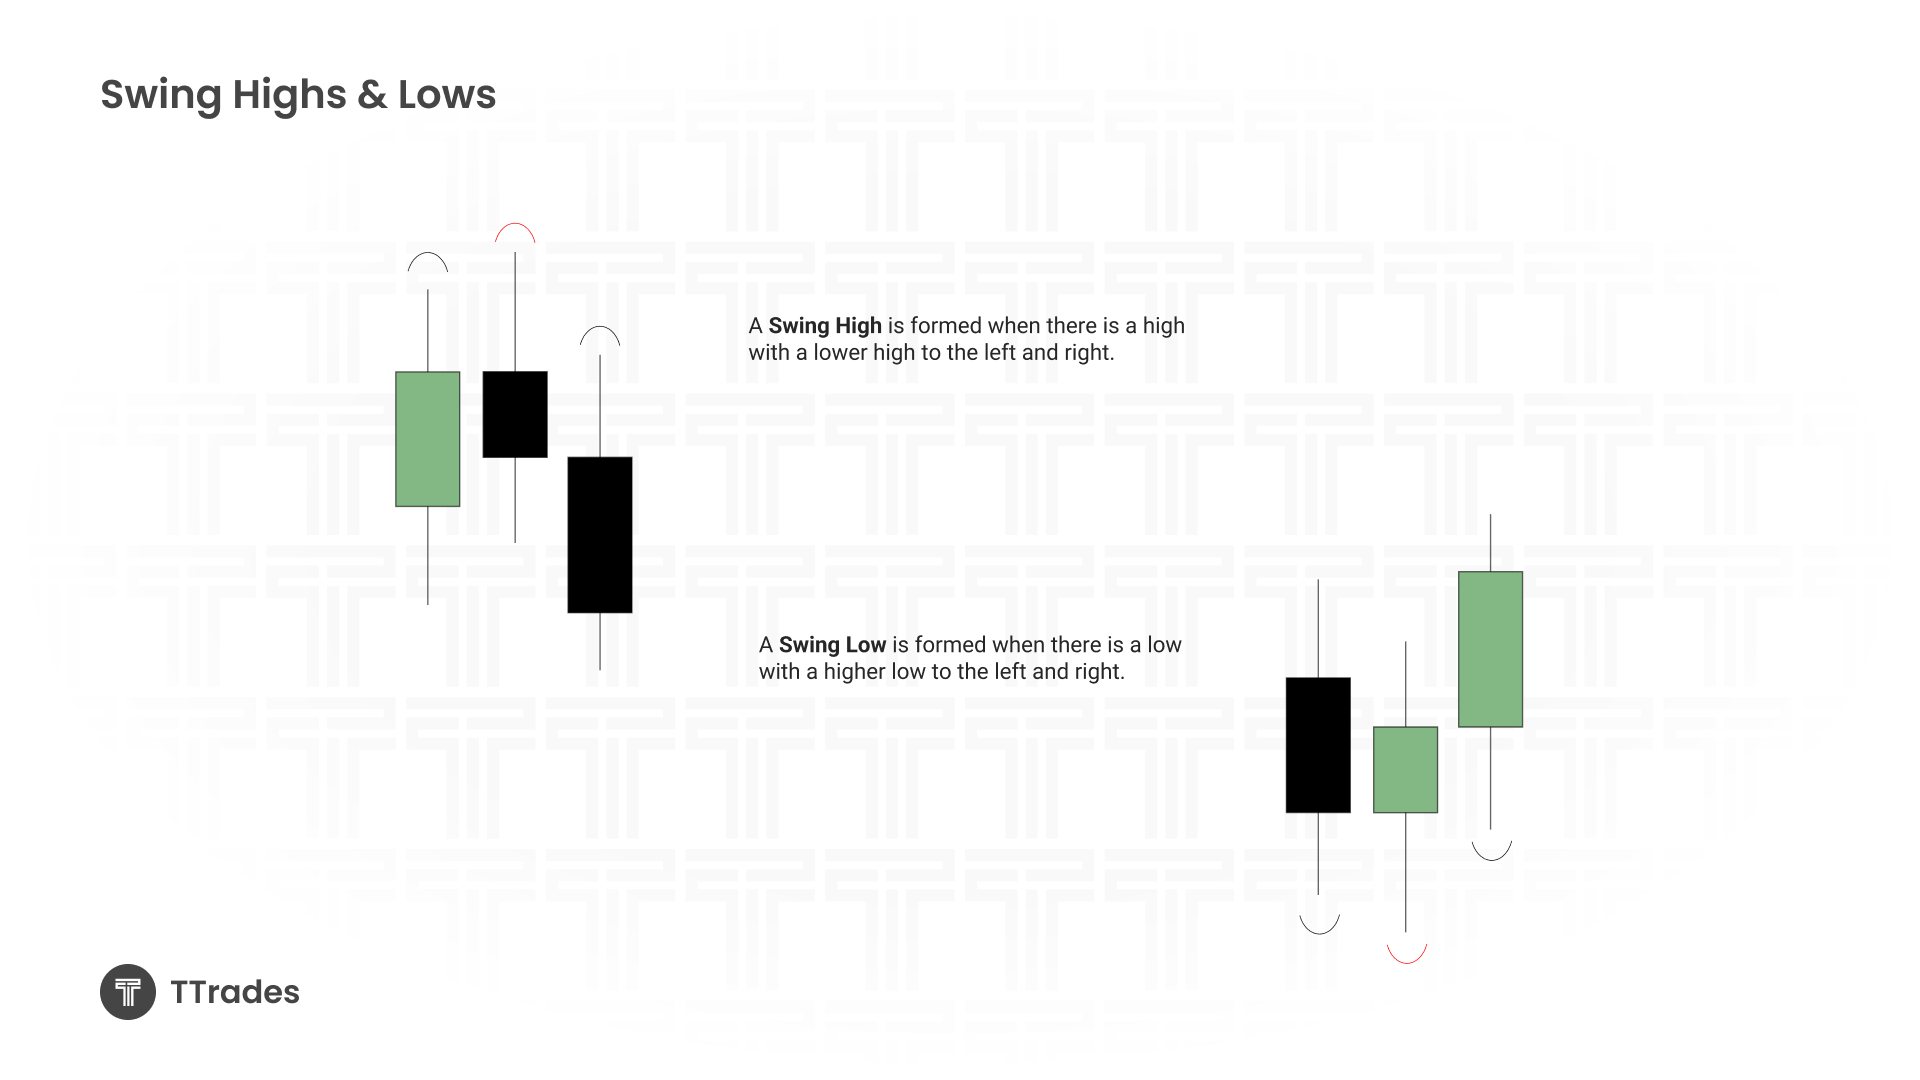
A swing low is formed when there is a low with a higher low to the left and a higher low to the right.
A swing high is formed when there is a high with a lower high to the left and a lower high to the right.
These structures matter because they reveal trader behavior and decision making in the market.
Trader Psychology Behind Liquidity
To understand liquidity, you need to understand how most traders manage risk.
When a trader goes long, they typically place their stop below a swing low.
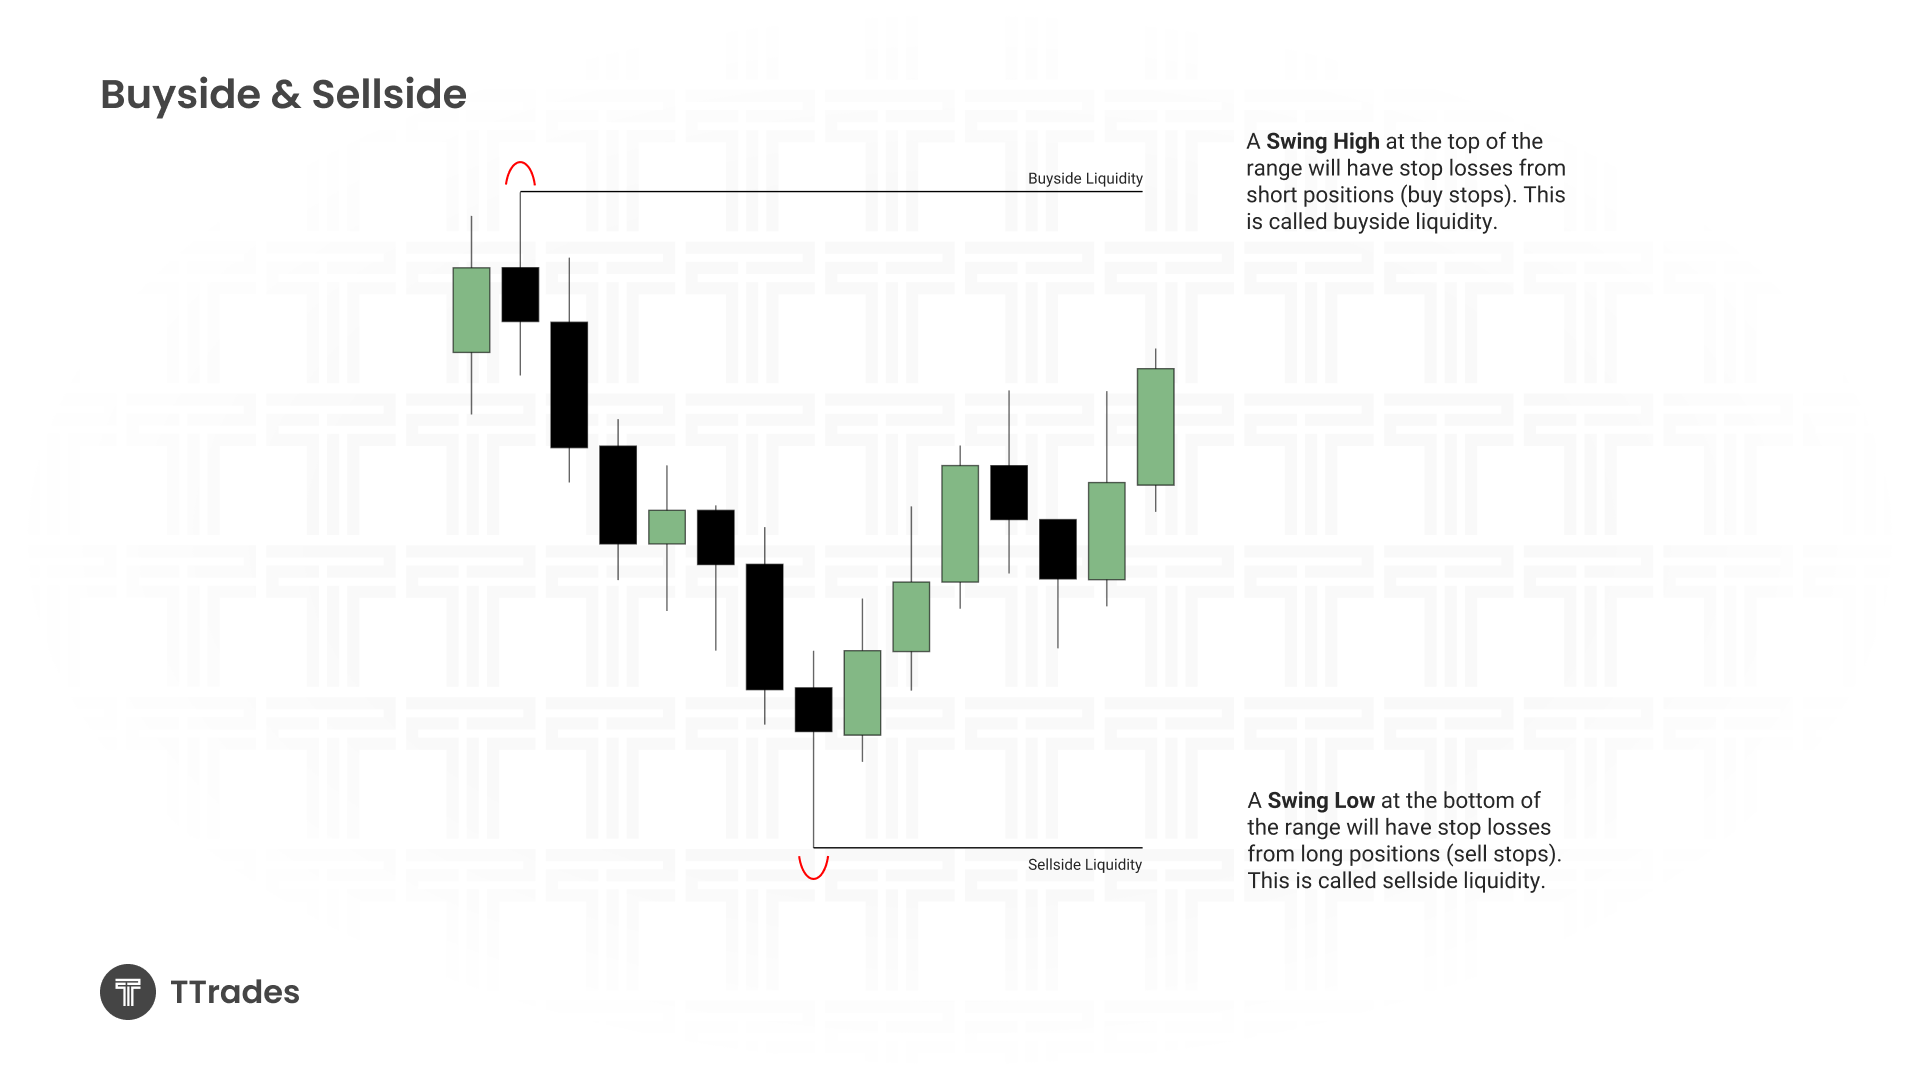
When a trader goes short, they typically place their stop above a swing high.
This means stops resting below lows are sell stops, and stops resting above highs are buy stops. This collective behavior is what creates liquidity.
Buy Side vs Sell Side Liquidity
With trader psychology in mind, liquidity can be defined clearly.
Sell side liquidity refers to the stops resting below swing lows.
Buy side liquidity refers to the stops resting above swing highs.
Smart money looks to use these areas to efficiently enter or exit positions, which is why price is consistently drawn toward obvious highs and lows.
Practicing Swing Point Identification
When you begin marking swing points on a chart, focus on obvious highs and lows, especially on higher timeframes like the four hour chart.
As price evolves, swing points are constantly being created and removed. Once a swing high is taken, that buy side liquidity is no longer relevant, and attention shifts to the next clear high. The same applies to swing lows and sell side liquidity.
Over time, you will notice a repeating cycle where price forms swing points, targets liquidity, and then shifts focus to the next available area.
Old Highs, Old Lows, and Equal Highs and Lows
There are two main structural liquidity types that show up consistently.
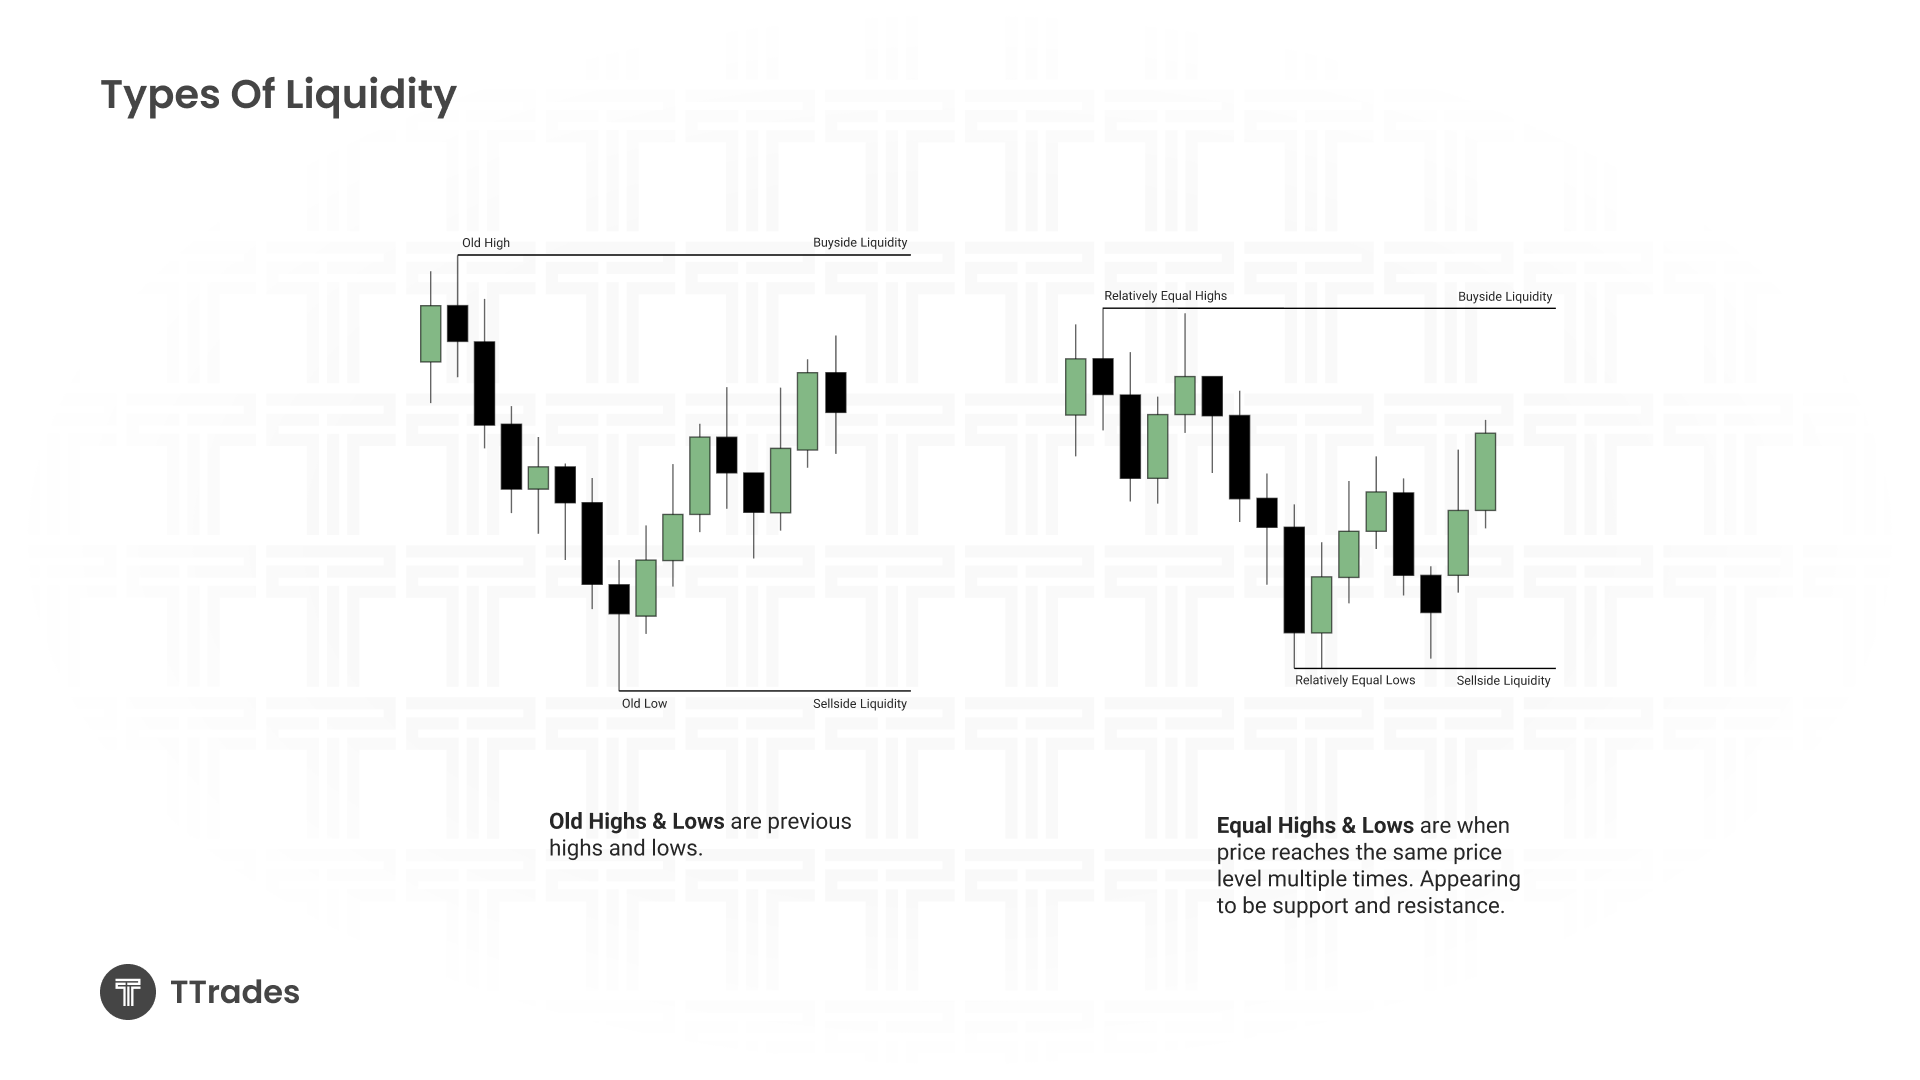
Old highs and old lows refer to a single, clear swing high or swing low from the past. These levels often act as magnets for future price.
Equal highs and equal lows occur when two or more swing points form at nearly the same price. This clusters liquidity together and makes these levels even more attractive targets for price.
Higher Timeframe Liquidity Levels to Always Track
Certain liquidity levels consistently influence price behavior and should always be on your radar.
Previous week high and low
Previous day high and low
Session highs and session lows
These levels help frame directional bias, identify potential reversals, and define likely price objectives.
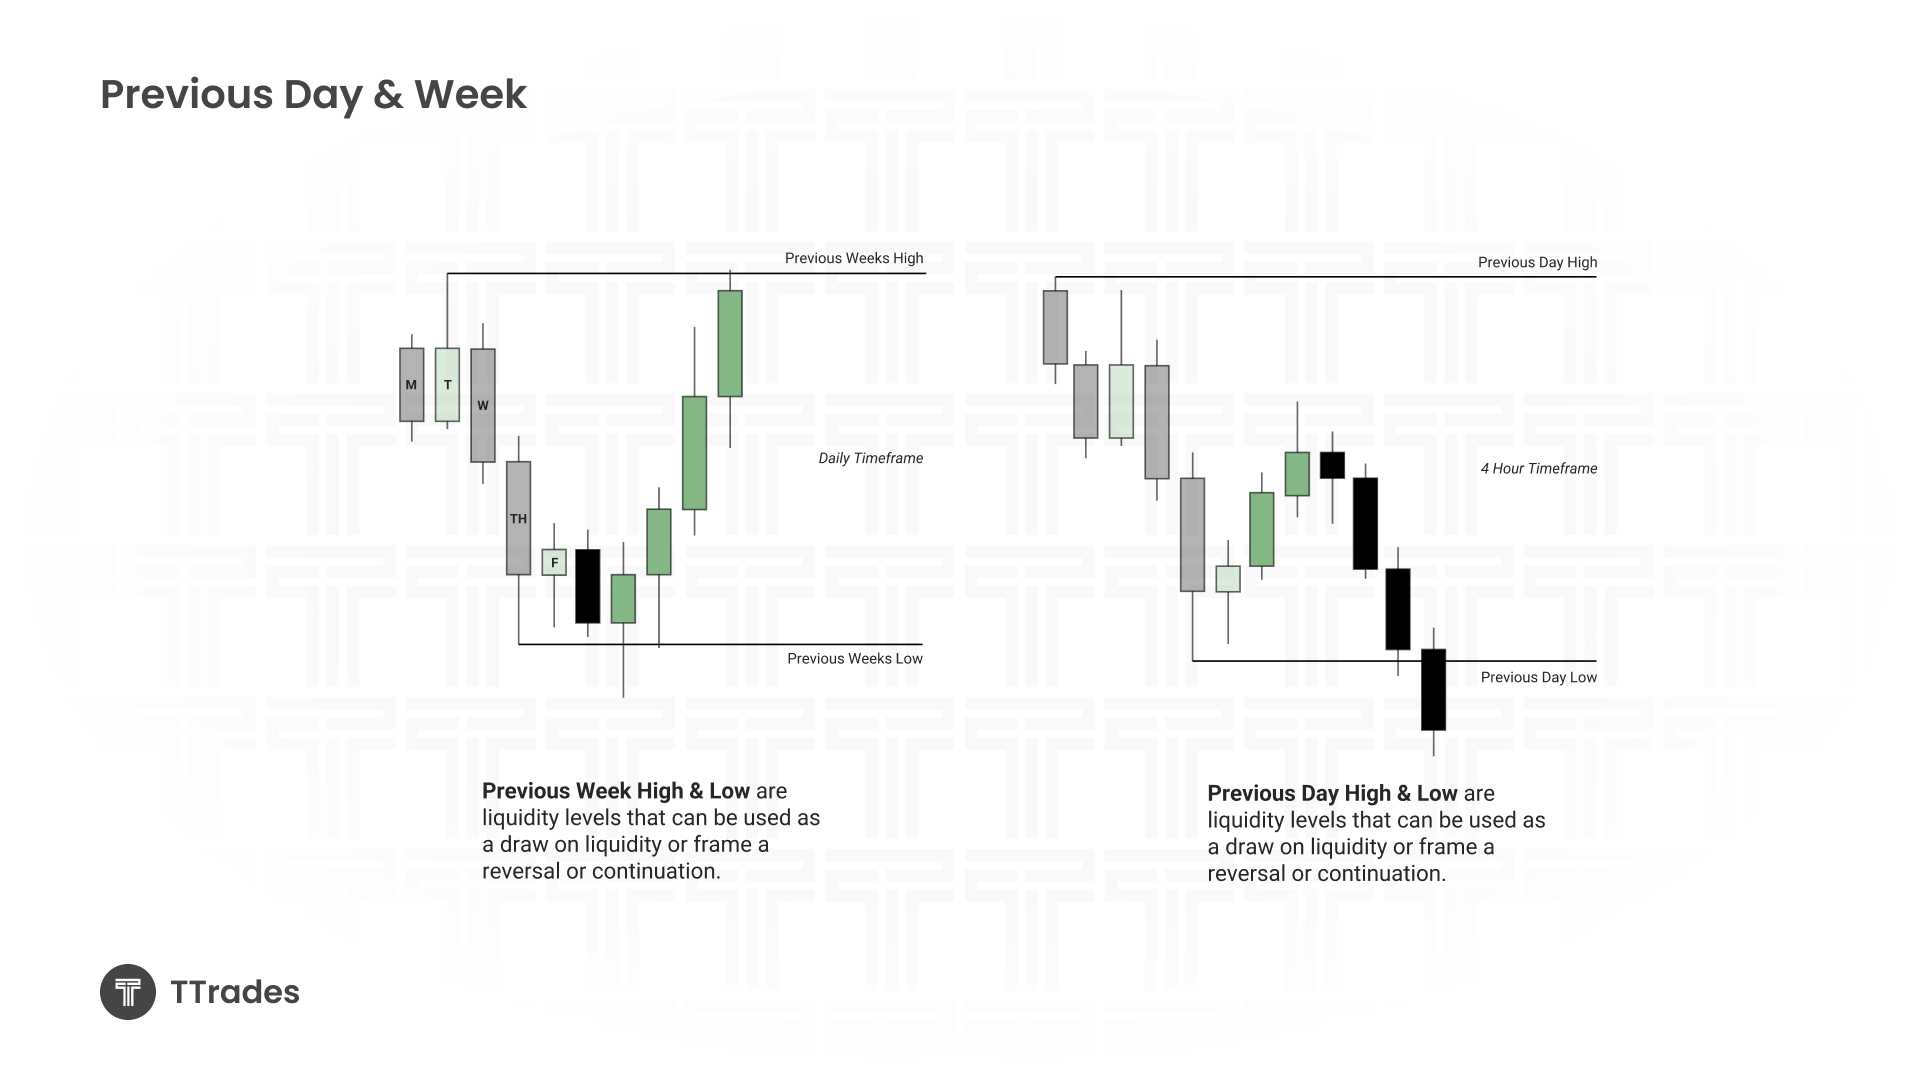
Previous Week High and Low
The previous week’s range provides a clean and reliable liquidity framework.
Often price will take the previous week high or low, trade back into imbalance or fair value, and then either reverse or continue expanding. This makes weekly levels extremely useful for planning higher timeframe trades.
Previous Day High and Low
Previous day highs and lows function similarly but on a smaller scale.
Price may target them as a draw, sweep them before reversing, or use them as fuel for continuation. They are especially useful during London and New York sessions.
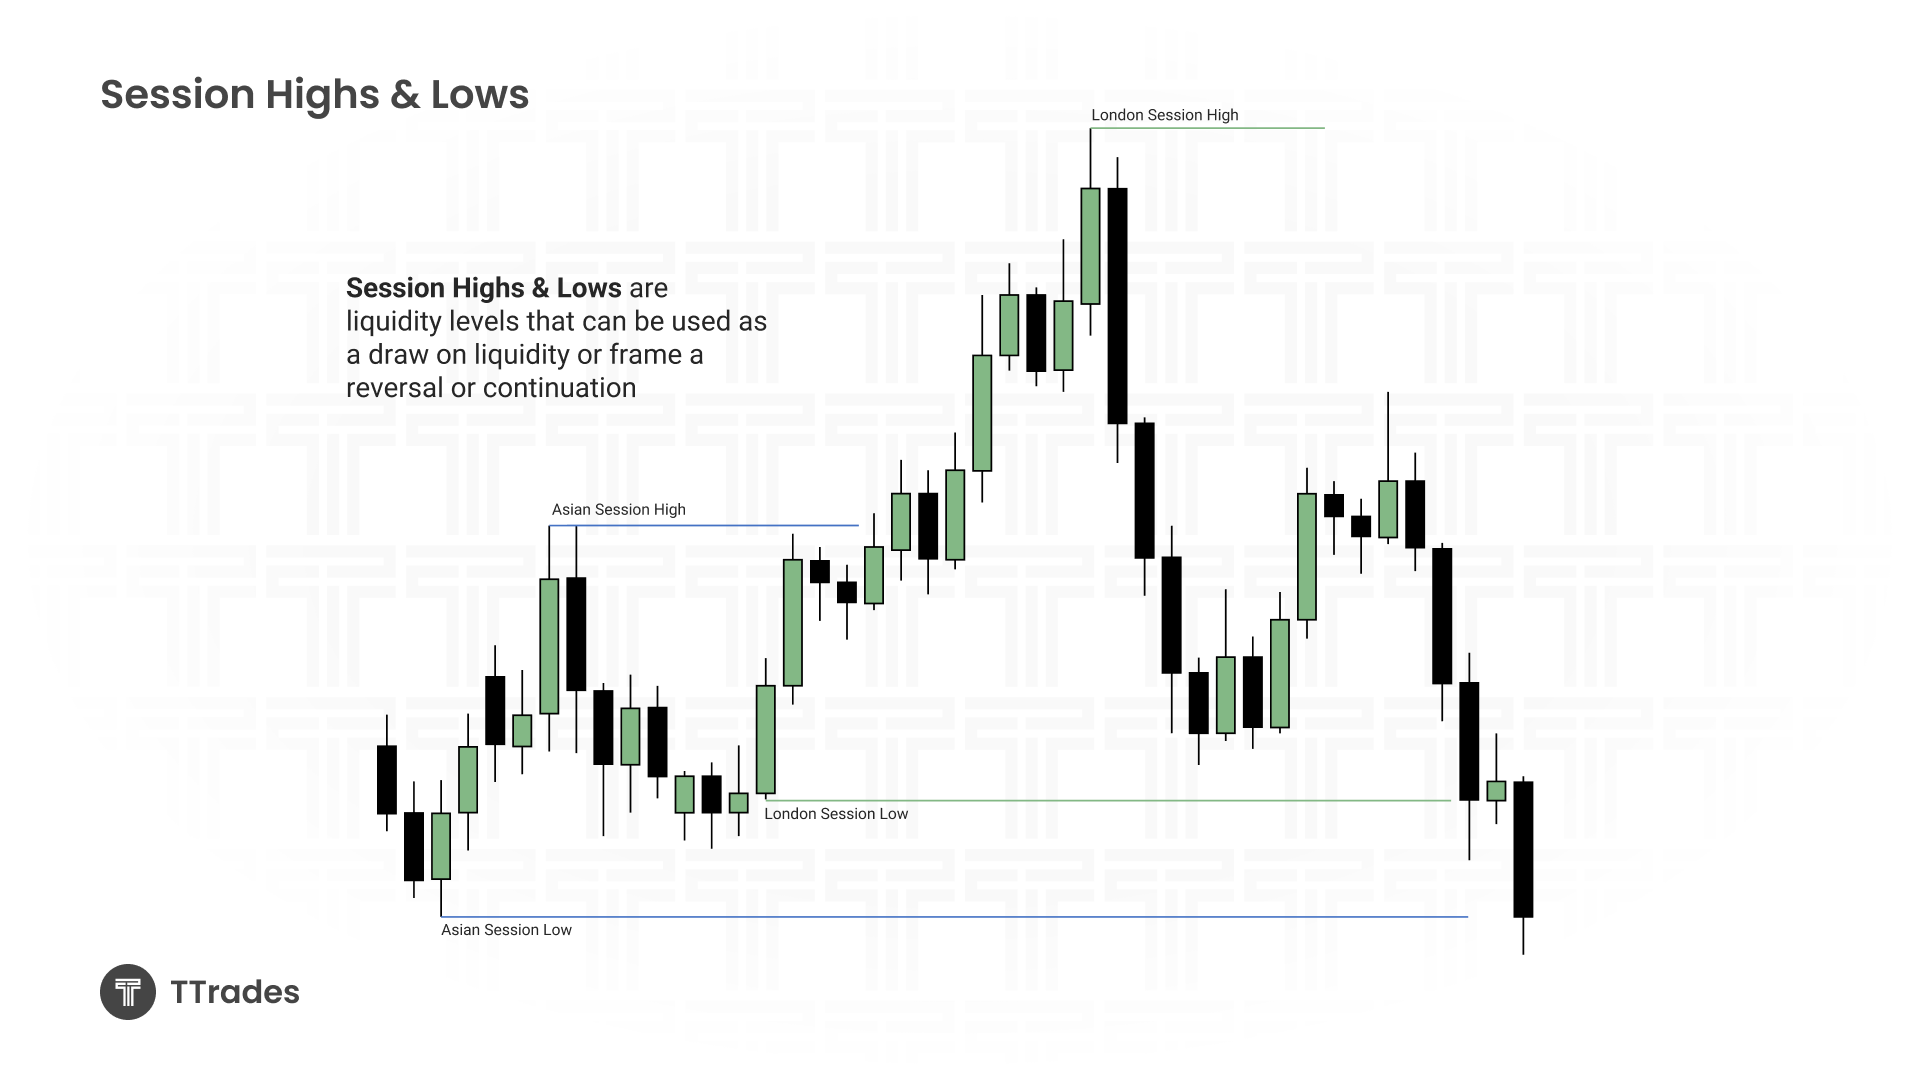
Session Highs and Lows
Session based liquidity is especially powerful for intraday trading.
Each session creates a high and a low that future sessions often target. New York frequently reacts to liquidity created during Asia or London, making session levels a strong framework for intraday narratives.
Using Liquidity With Fair Value Gaps
Liquidity becomes even more effective when combined with displacement and fair value gaps.
A common sequence is price taking a session high or low, delivering strong displacement, forming a fair value gap, retracing into that gap, and then continuing toward the next liquidity objective.
This creates structured, high probability trade setups with clear entries and targets.
Putting It All Together
Liquidity is not random. Price moves with intention, constantly seeking areas where orders are resting.
By focusing on swing highs and swing lows, old highs and lows, equal highs and equal lows, and key time based liquidity levels, you gain a repeatable framework for understanding market behavior.
Final Thoughts
If you ever feel lost in the market, return to one simple question. Where is the nearest obvious liquidity that has not yet been taken. In most cases, price will naturally work its way there.