
Introduction
Candle 2 closures are one of the most important fundamentals of the Fractal Model. They help you identify potential turning points in price and set the foundation for anticipating a continuation in Candle 3. In this guide, we’ll break down exactly what a Candle 2 closure is, how to spot it on the charts and how to use it within aligned time frames.
What a Continuation Closure vs. Reversal Closure Really Means
Before we talk about Candle 2 closures specifically, you need to understand the two major types of closures:
A continuation closure happens when price takes out the previous candle’s high or low and closes beyond it, showing continuation.
A reversal closure happens when price sweeps the previous candle’s high or low but closes back inside the previous range, showing reversal.
A Candle 2 closure is always a reversal closure.

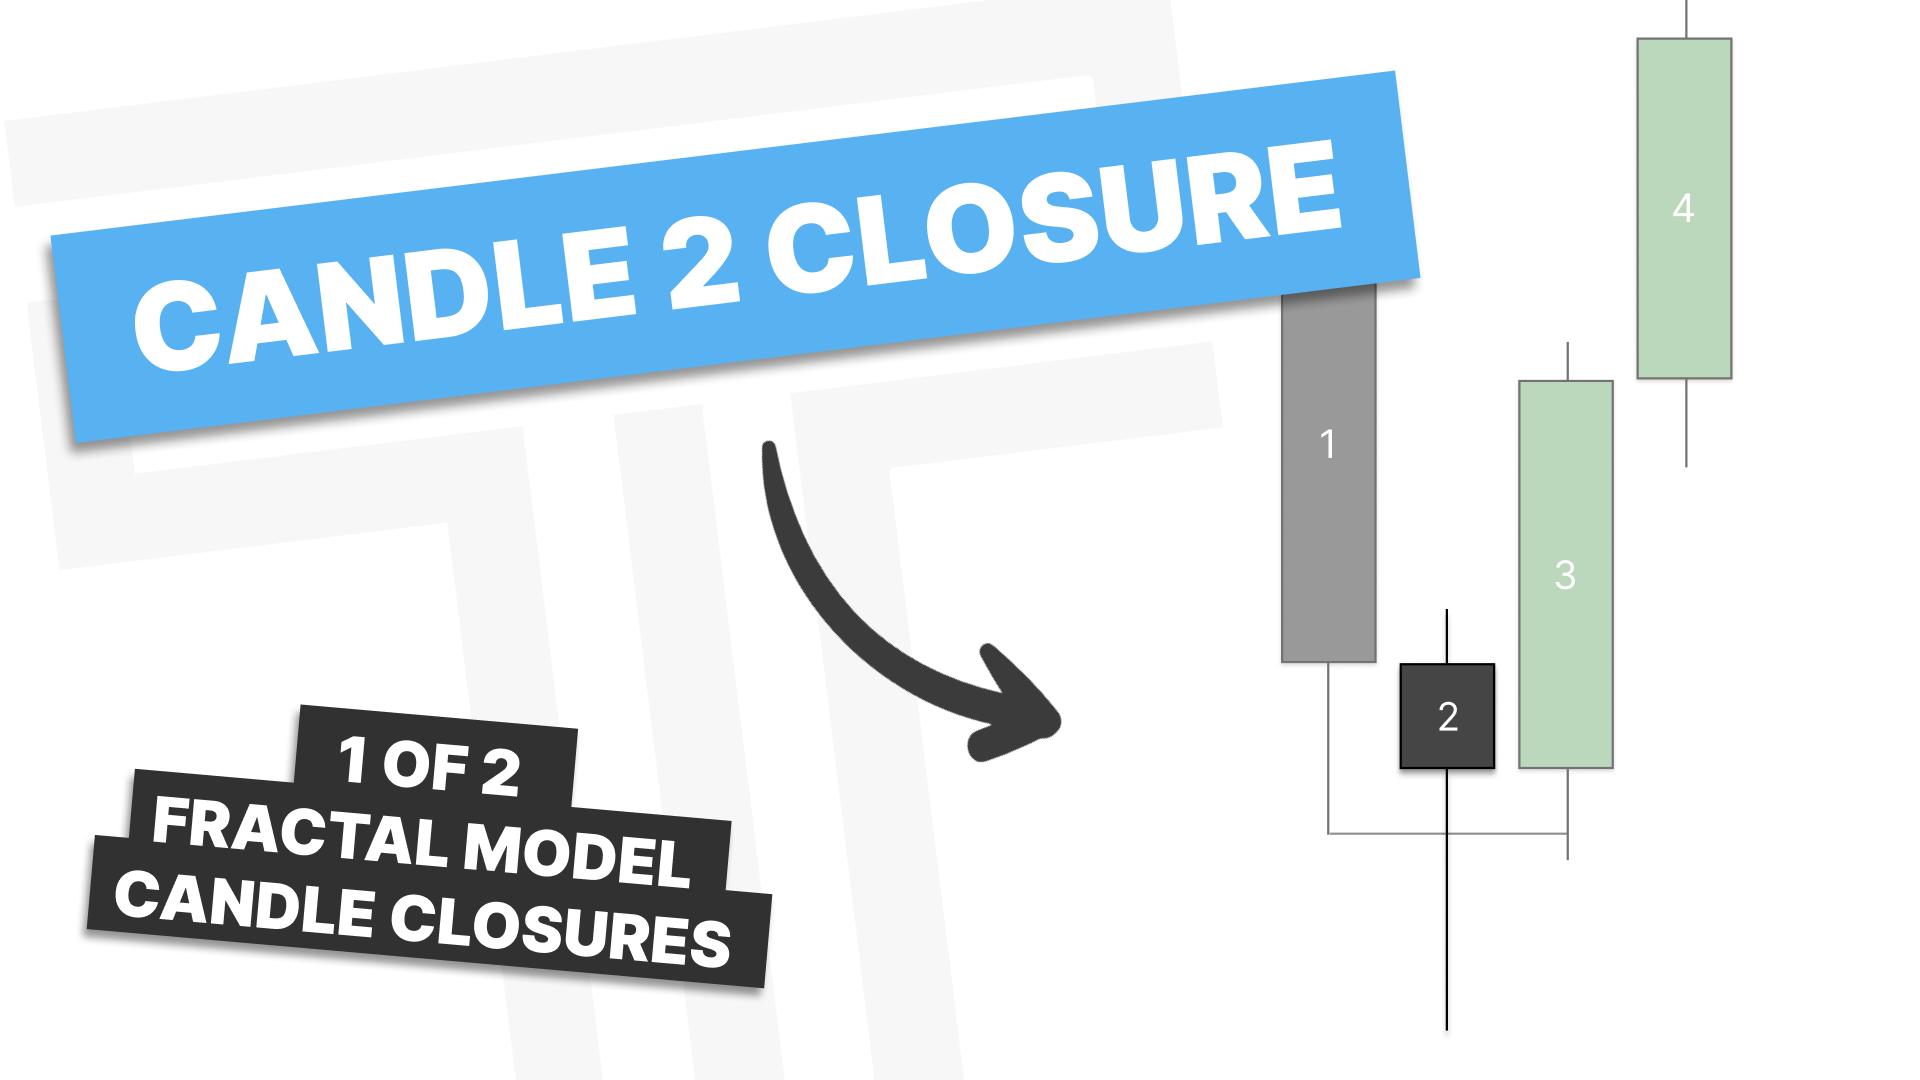
What Exactly Is a Candle 2 Closure?
A Candle 2 closure forms when:
Price sweeps the previous candle’s high or low,
Then closes back inside the previous candle’s range.
This signals that price has shifted and that Candle 2 has produced a reversal.
In a bullish scenario:
Price sweeps the previous low.
Closes back above that low.
In a bearish scenario:
Price sweeps the previous high.
Closes back below that high.
This reversal inside Candle 2 sets the stage for a potential Candle 3 continuation.

Candle 2 Closures Need a Point of Interest
A common mistake is treating every reversal closure as valid. Candle 2 closures only matter when they form at a higher-time-frame point of interest, such as a swing high or low, a fair value gap, or in the case that neither are present, an opposing candle. Without a clear point of interest, the setup is not valid.
When you combine Candle 2 closures with bias and points of interest, they become a reliable mechanism for anticipating the next phase of price.
How Candle 3 Fits Into the Picture
Once Candle 2 creates a reversal, Candle 3 is expected to provide continuation.
Examples:
In a bullish reversal: Candle 3 often expands upward.
In a bearish reversal: Candle 3 often expands downward.

If Candle 3 closes beyond Candle 2’s high or low in the direction of the trend, it usually leads to a Candle 4 expansion as well. This is why the Candle 2 to Candle 3 sequence is such a powerful combination inside the fractal model.

Using EQ and Wick Theory with Candle 2 Closures
You can refine Candle 2 closures using equilibrium concepts:
If Candle 2 forms a large wick, monitor the midpoint of that wick.
Candle 3 should respect this midpoint for the model to remain intact.
If it doesn’t, the swing point is less likely to hold.
This simple EQ concept can filter out many weak or lower-probability reversals.

How to Practice Identifying Candle 2 Closures
A practical way to develop your eye for Candle 2 closures is to:
Pick a higher-time-frame chart.
Mark every swing point.
Review each one and determine whether it actually contains a true Candle 2 closure.
You’re looking for a clean sweep, a close back inside the previous candle, and a valid point of interest. This exercise quickly improves your ability to set daily bias.
The Fractal Nature of Candle 2 Closures
Candle 2 closures appear on every time frame and follow the same logic no matter how far you zoom in or out.
For example:
A daily Candle 2 can be validated on the hourly chart.
An hourly Candle 2 can be validated on the five-minute chart.
A four-hour Candle 2 can be validated on the fifteen-minute chart.
Candle 2 Closures as Turning Points
Because Candle 2 often forms the turning point of a swing, it can lead to:
Clean reversals
Clear directional bias
Continuation through Candle 3 and Candle 4
Additional fractal setups on lower time frames
These closures act as “anchors” for understanding where a phase of price is beginning or ending.
Putting It All Together
A valid Candle 2 closure includes:
A sweep of the previous candle’s high or low
A close back inside the previous candle’s range
A higher-time-frame point of interest
Structure supporting continuation into Candle 3
Once all four elements are in place, you can drop down to your aligned time frame to confirm the change in the state of delivery and look for continuations.