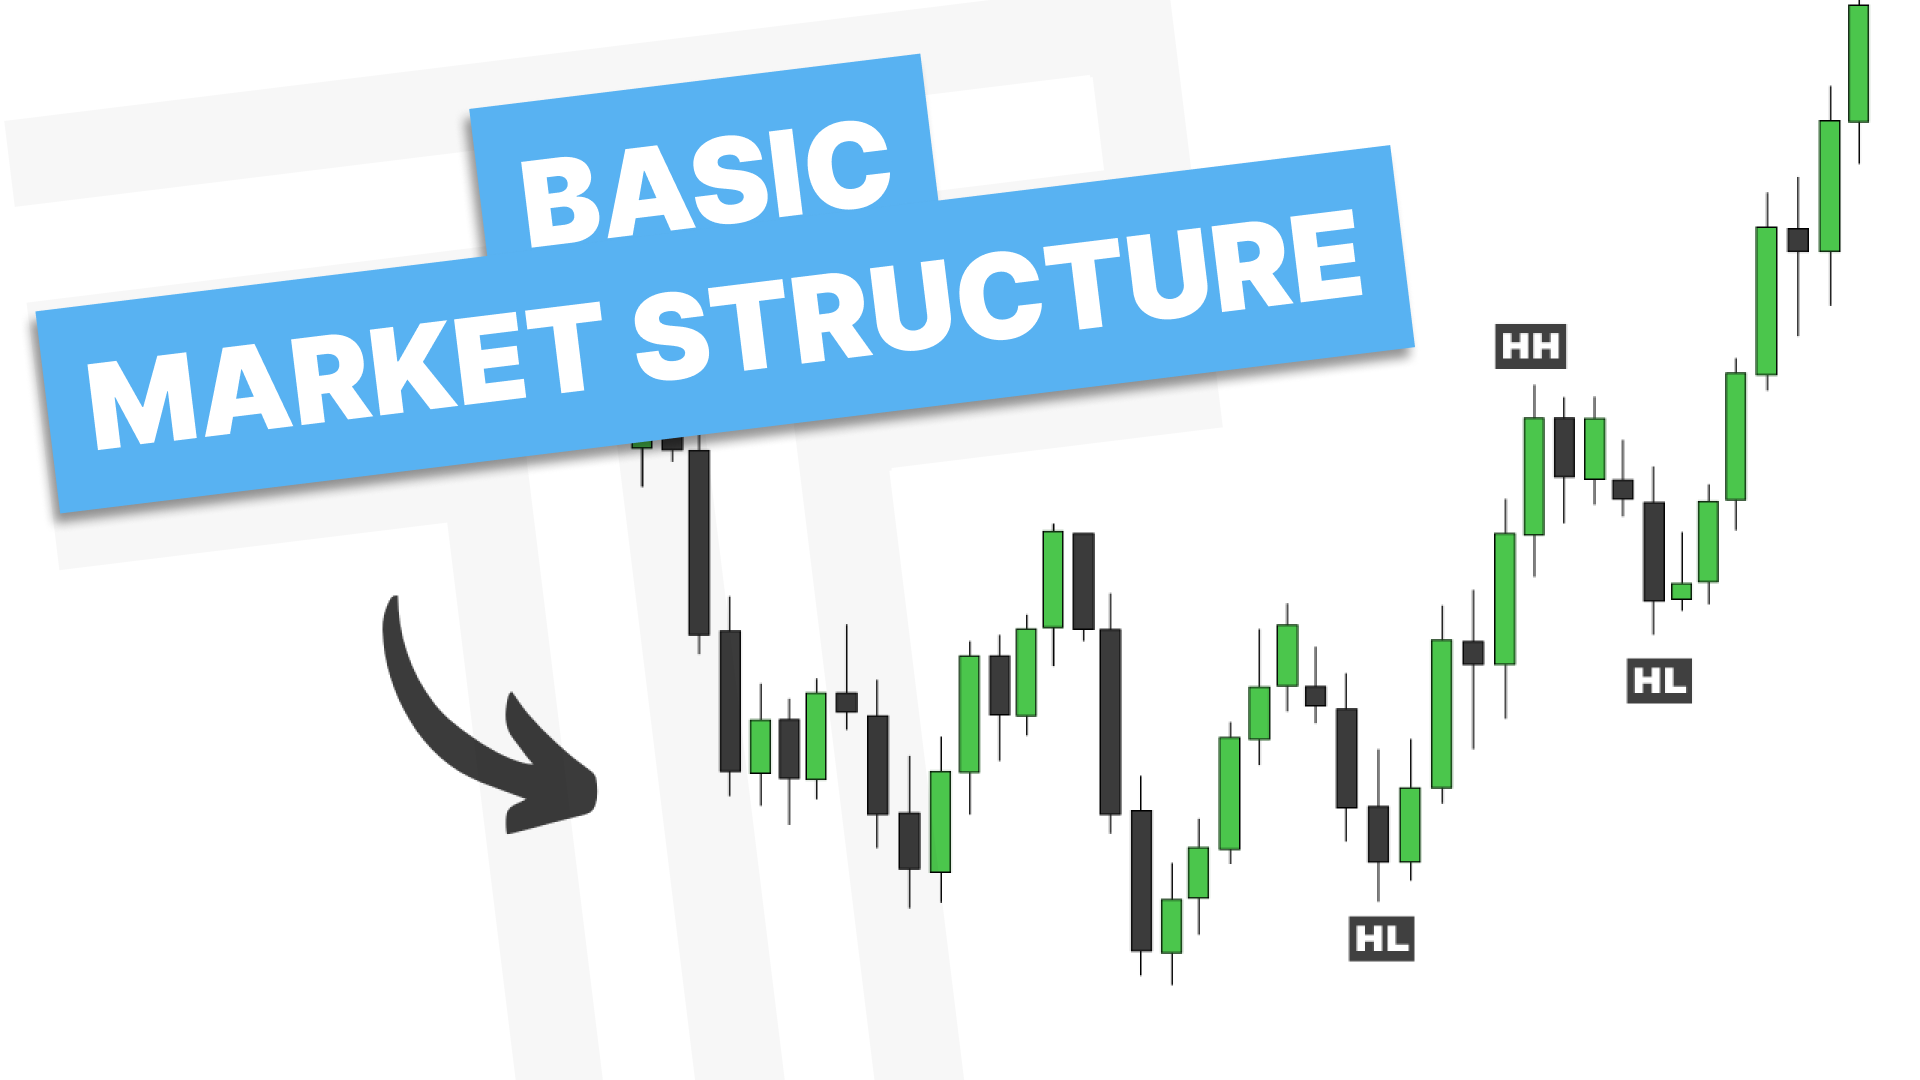
Introduction
Before diving into advanced trading concepts, it’s critical to understand basic market structure. Market structure forms the foundation of technical analysis, helping traders read price action, spot trends, and identify potential reversals. In this guide, we’ll break down swing highs and lows, trend direction, and what it means when a market shifts from bullish to bearish or vice versa.
Swing Highs, Swing Lows, and Liquidity
A swing high is a peak in price before the market moves lower.
A swing low is a trough before the market moves higher.
These swings build the framework of market structure, guiding how trends form.
Understanding liquidity is also essential, as it often influences price movement.
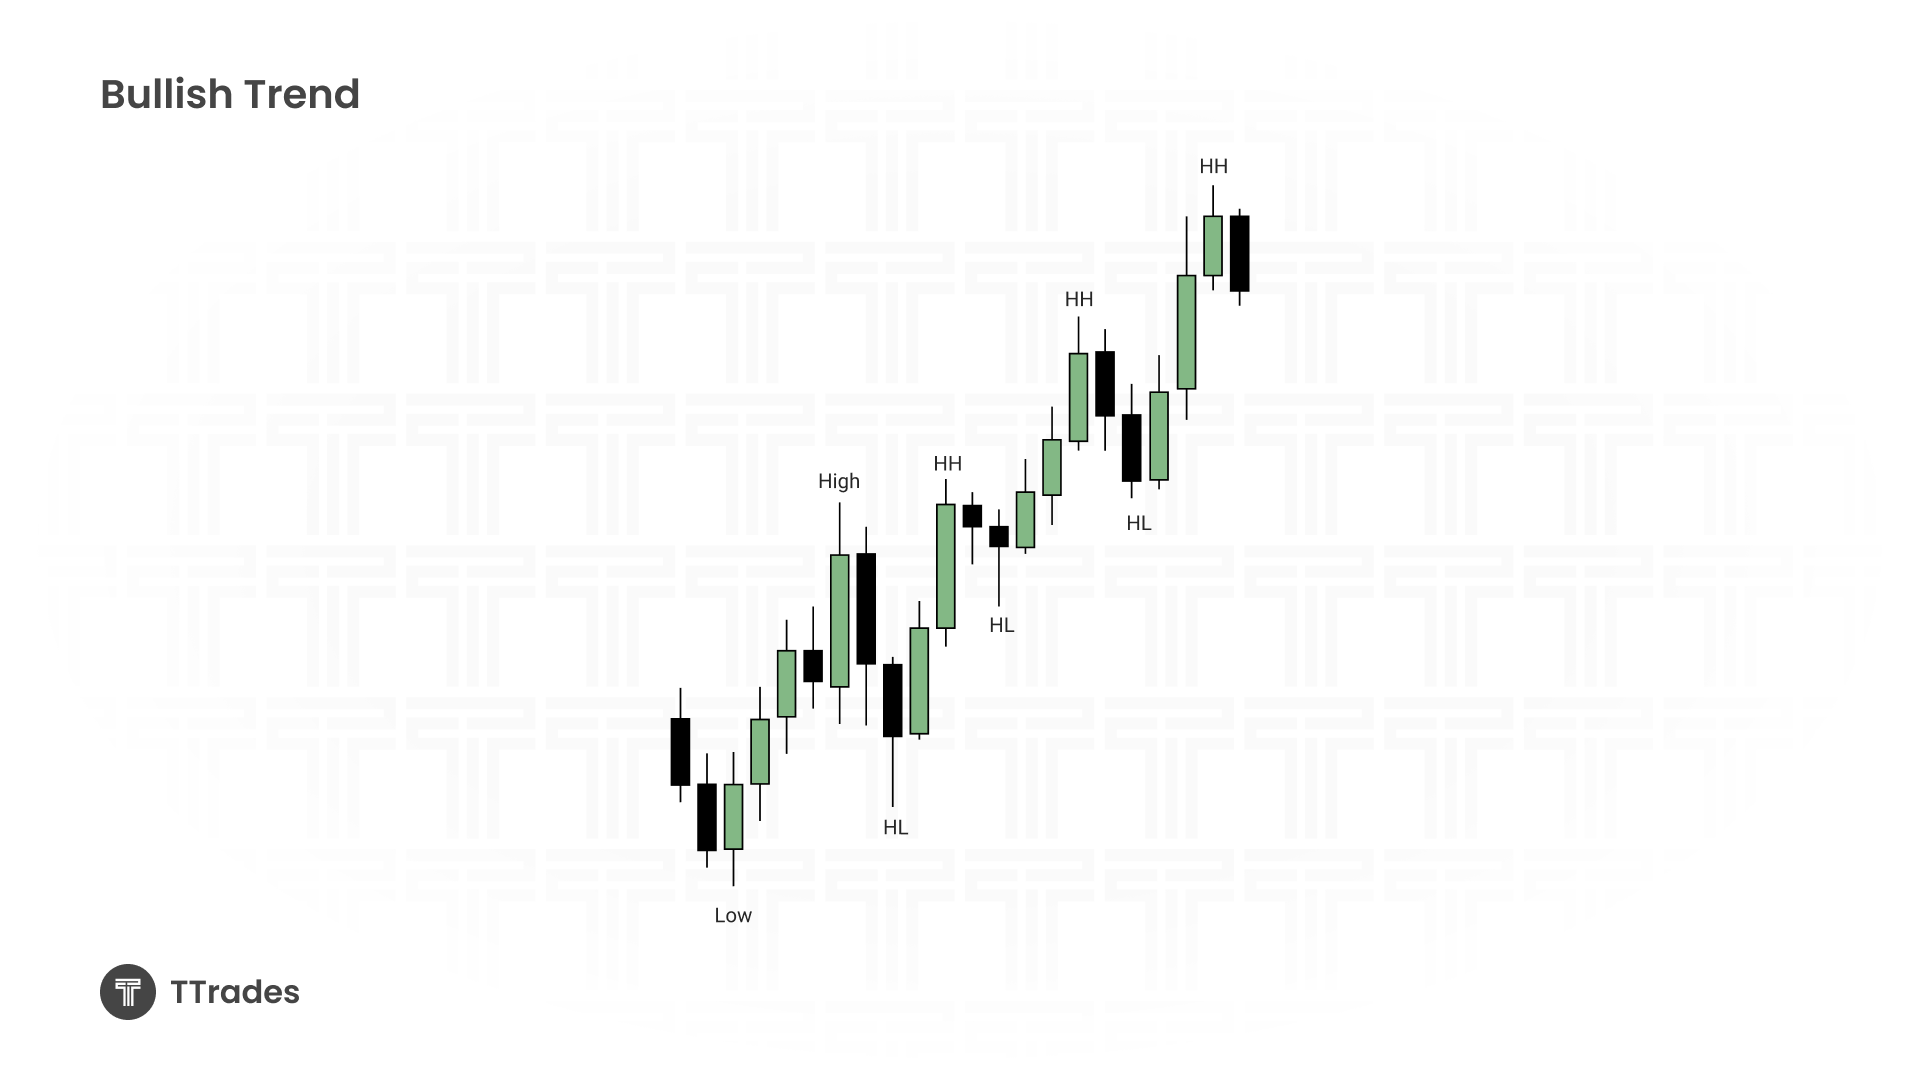
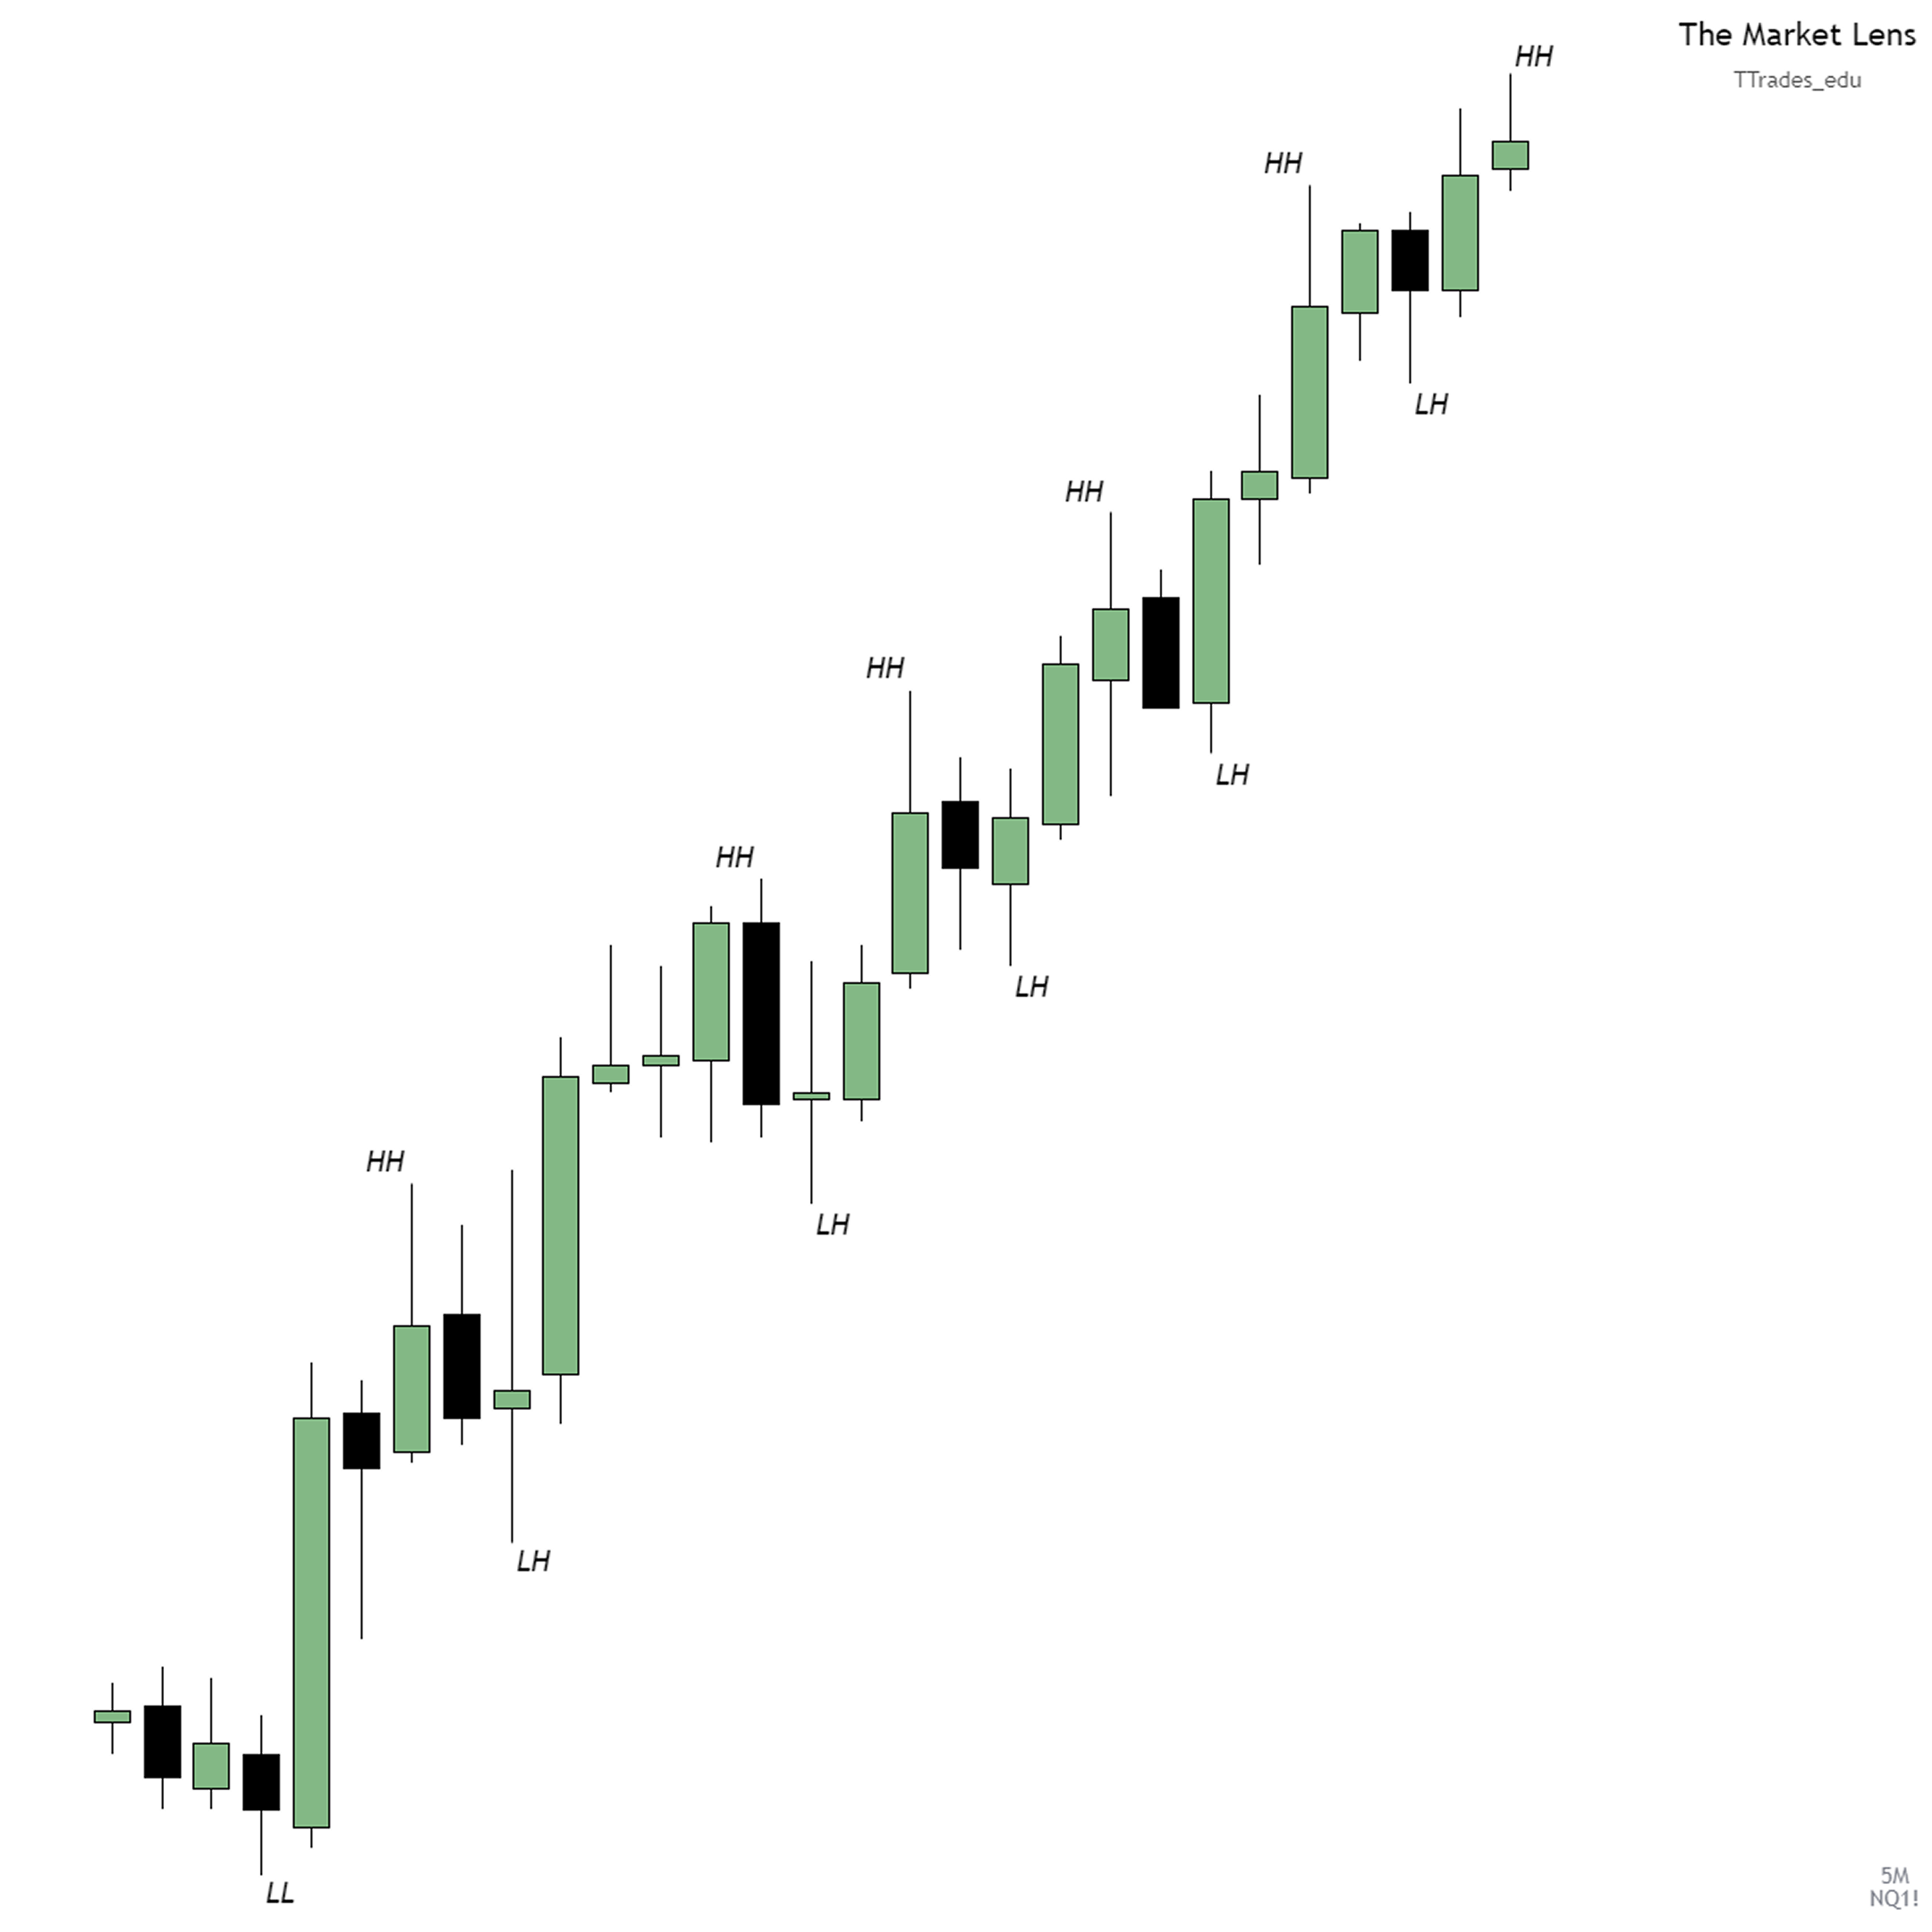
Identifying an Uptrend
In an uptrend, price moves through a series of higher highs and higher lows:
Price makes a low, then a higher high.
A higher low forms relative to the previous low.
The cycle continues: higher highs and higher lows.
This sequence confirms bullish structure until a significant breakdown occurs.
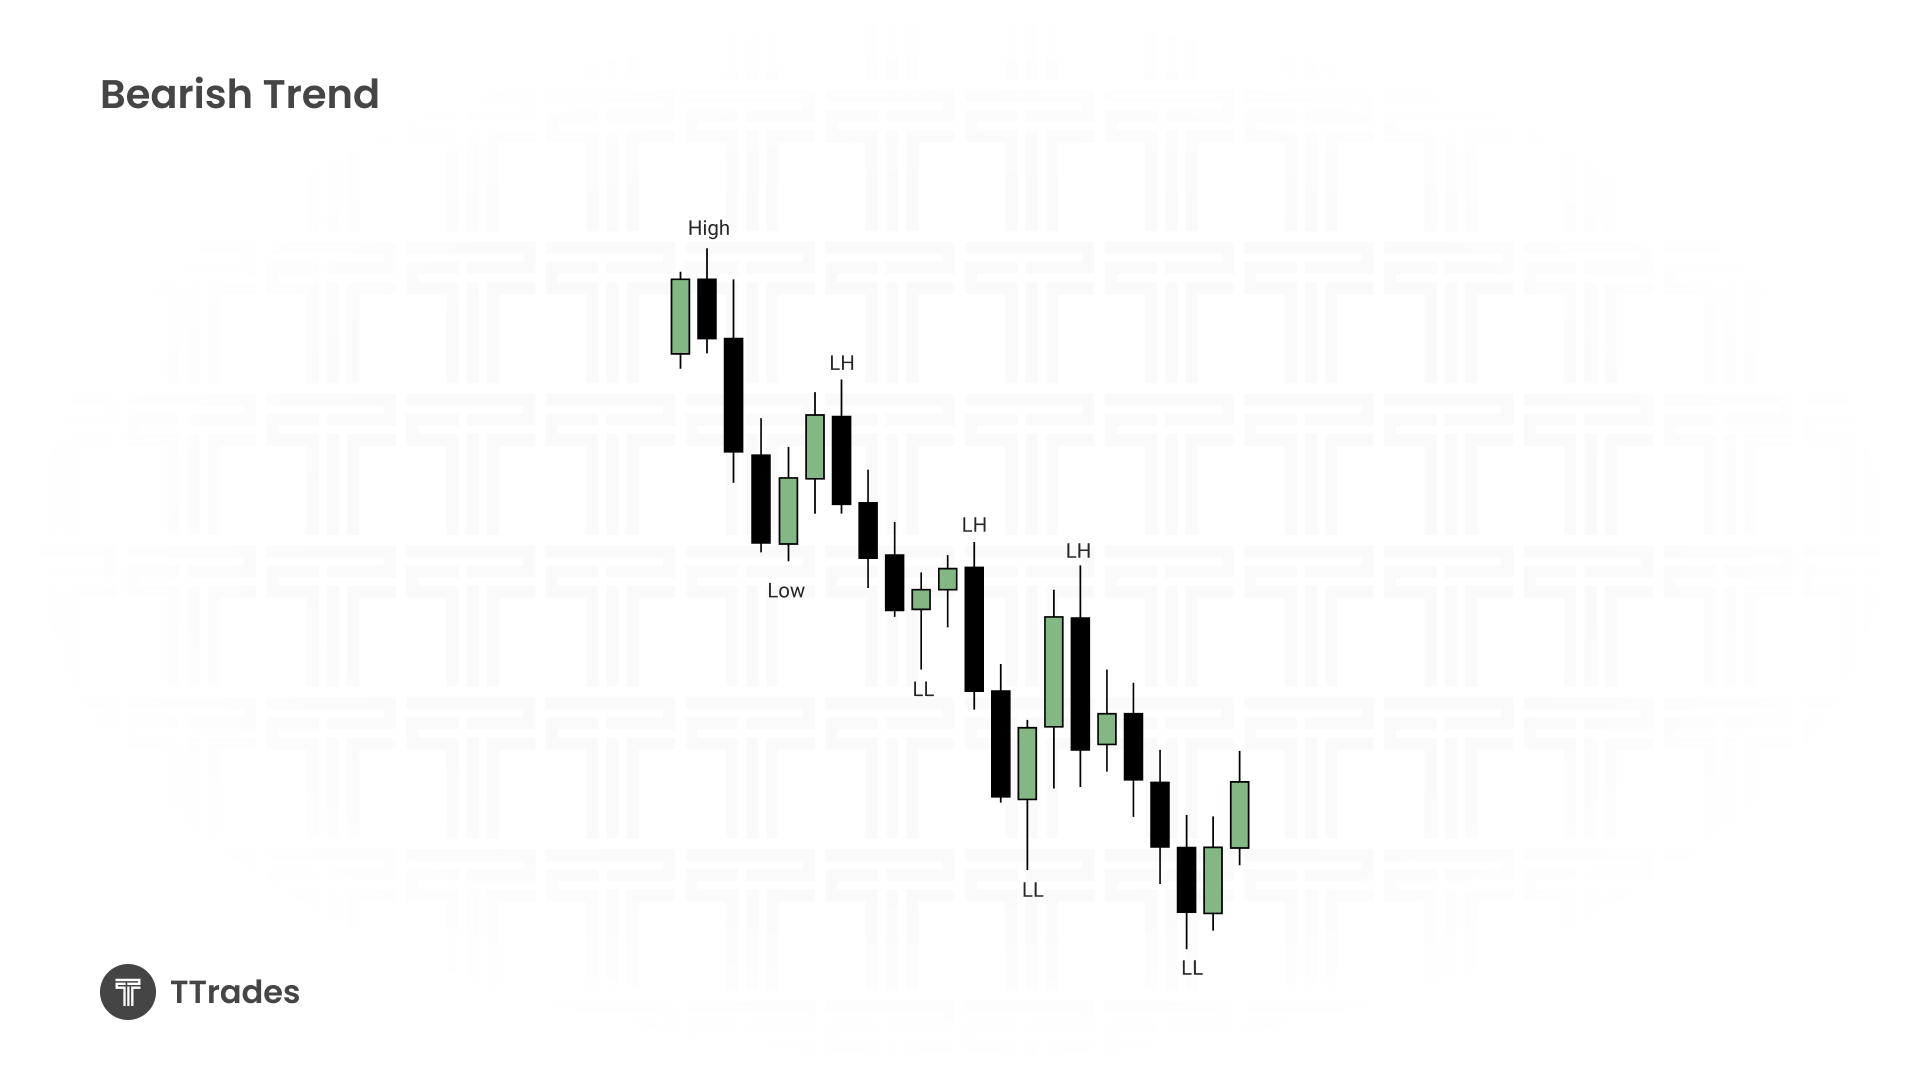
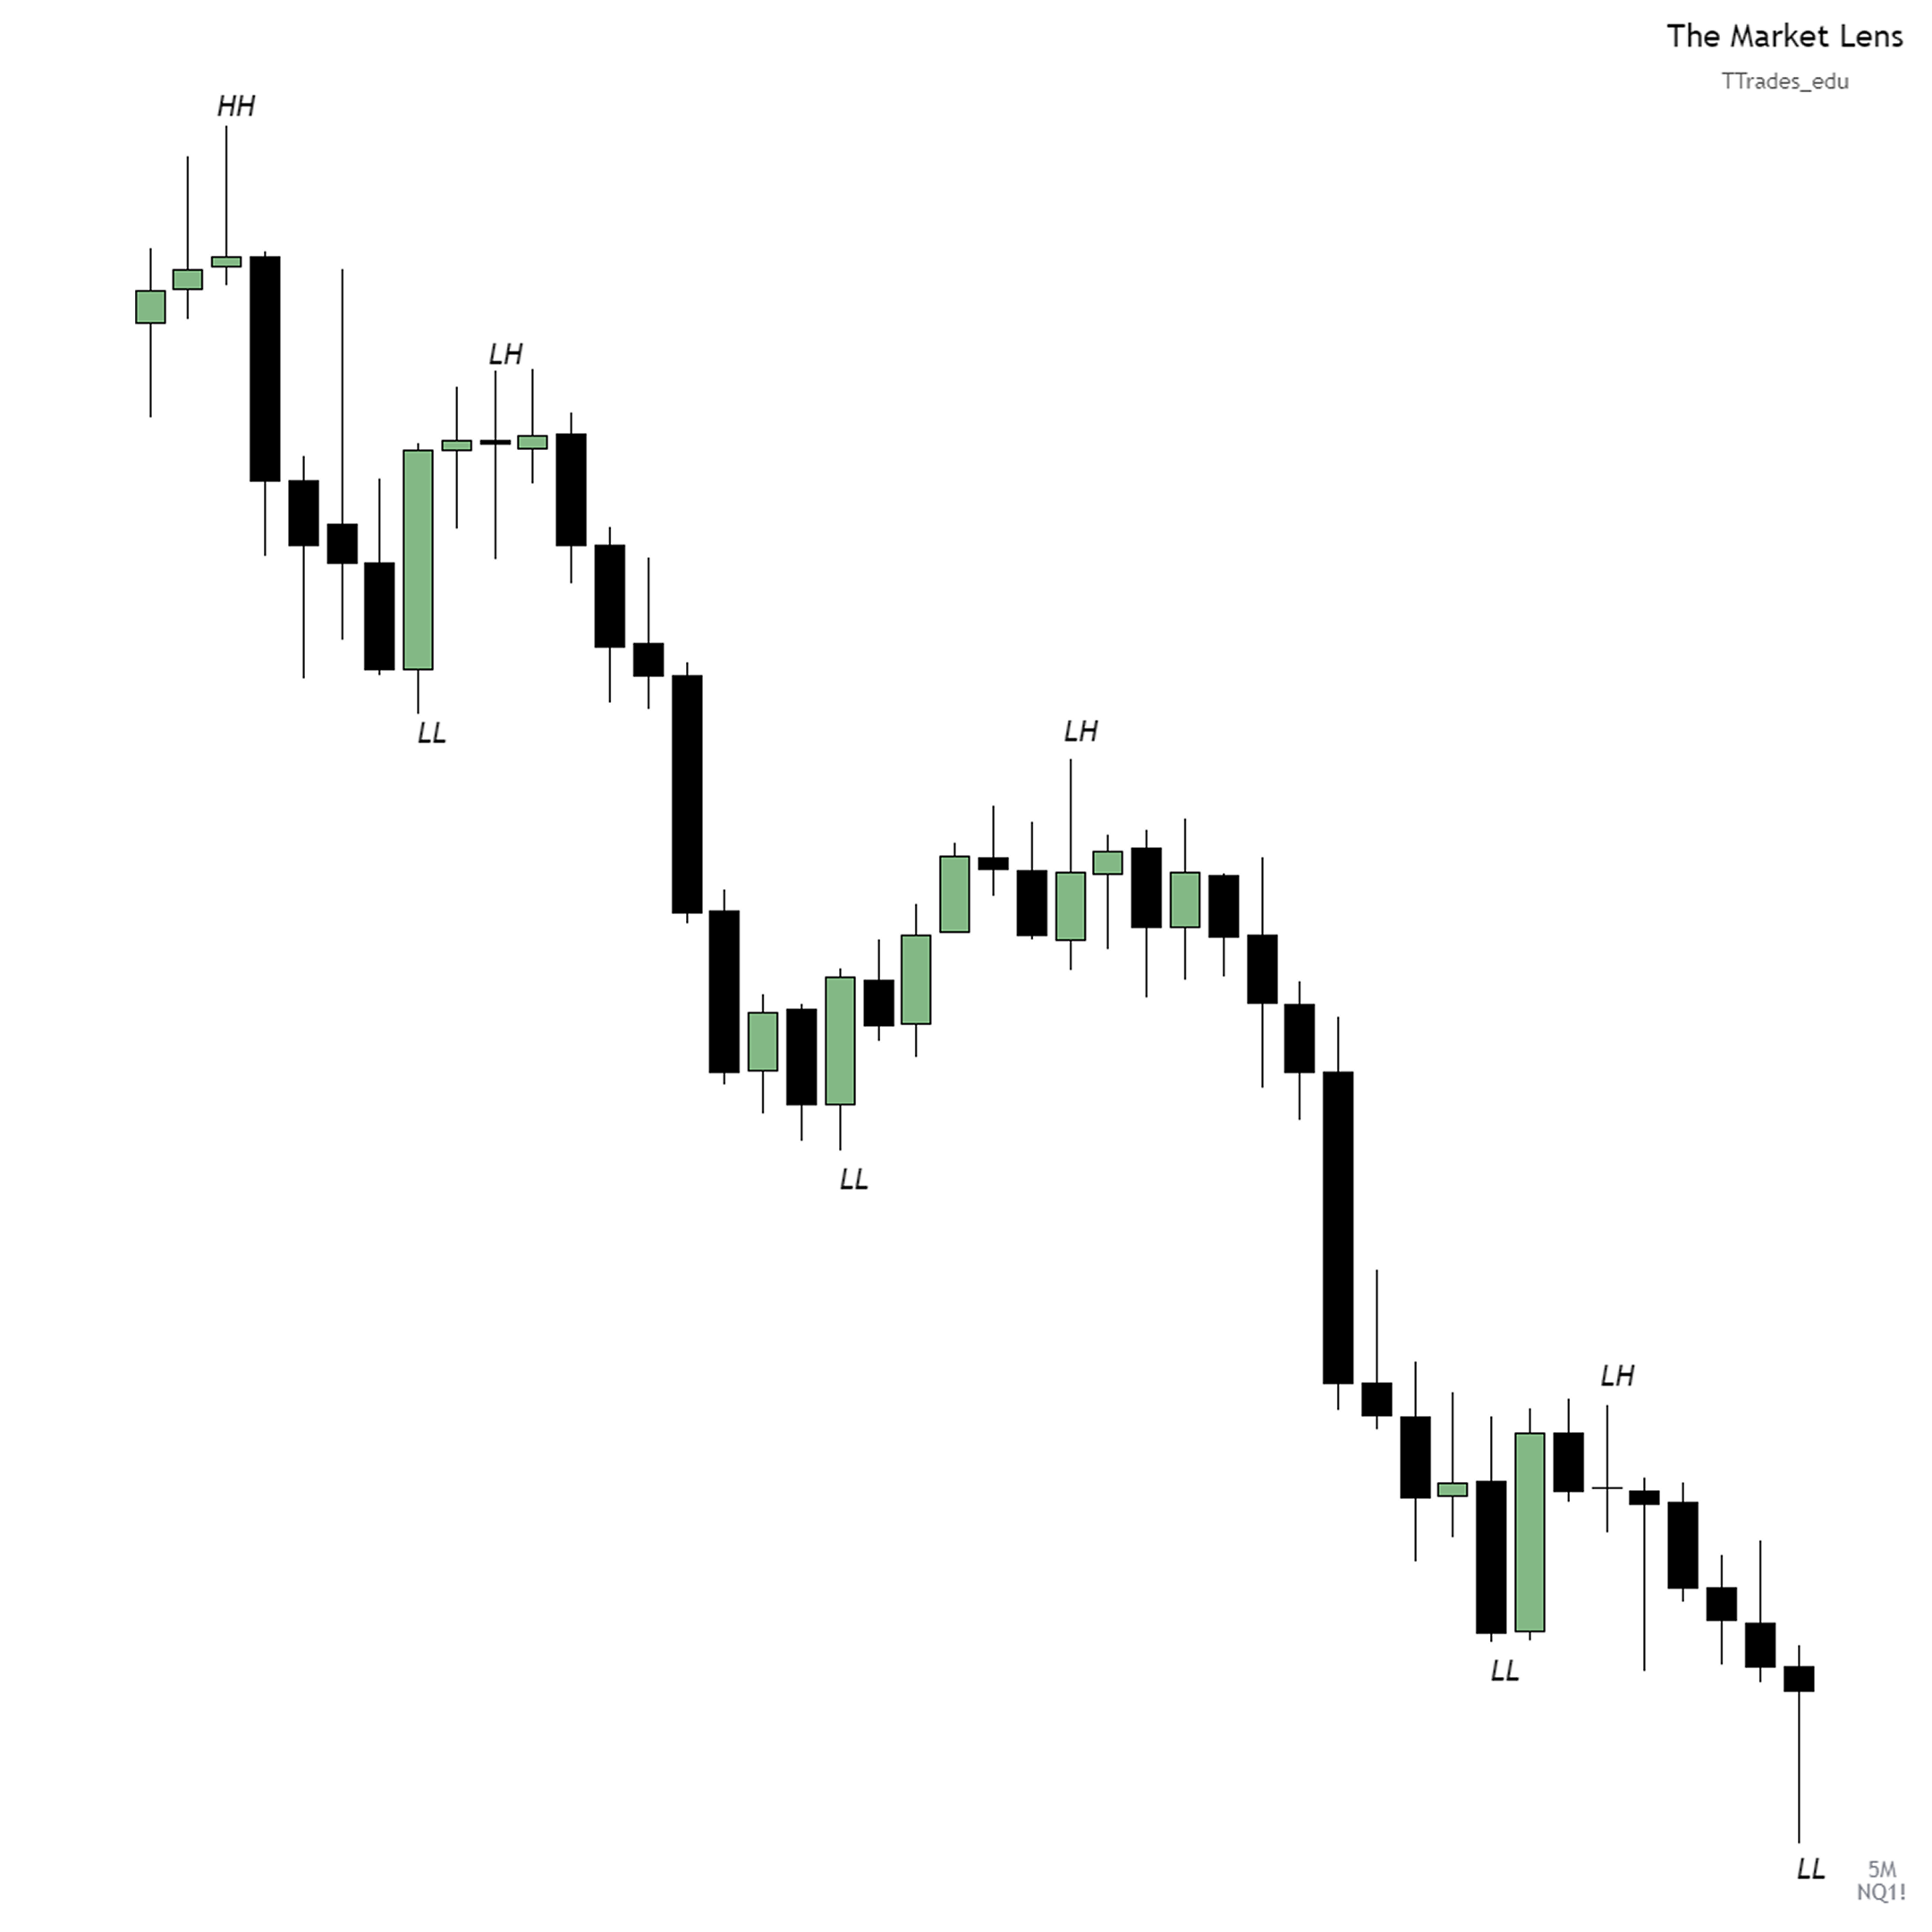
Identifying a Downtrend
In a downtrend, price follows the opposite sequence:
Price makes a high, then a lower low.
A lower high forms relative to the previous high.
The cycle continues: lower highs and lower lows.
This structure confirms bearish conditions until price shifts upward.
Market Structure Shifts
A market structure shift occurs when the prevailing trend reverses:
From bearish to bullish: price stops making lower lows and begins forming higher highs.
From bullish to bearish: price stops making higher highs and starts forming lower lows.
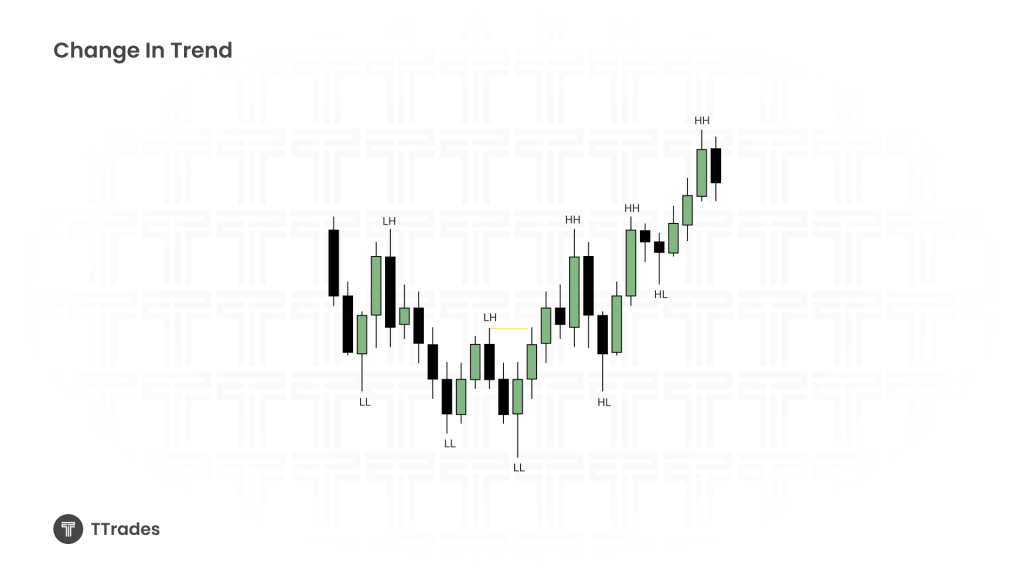
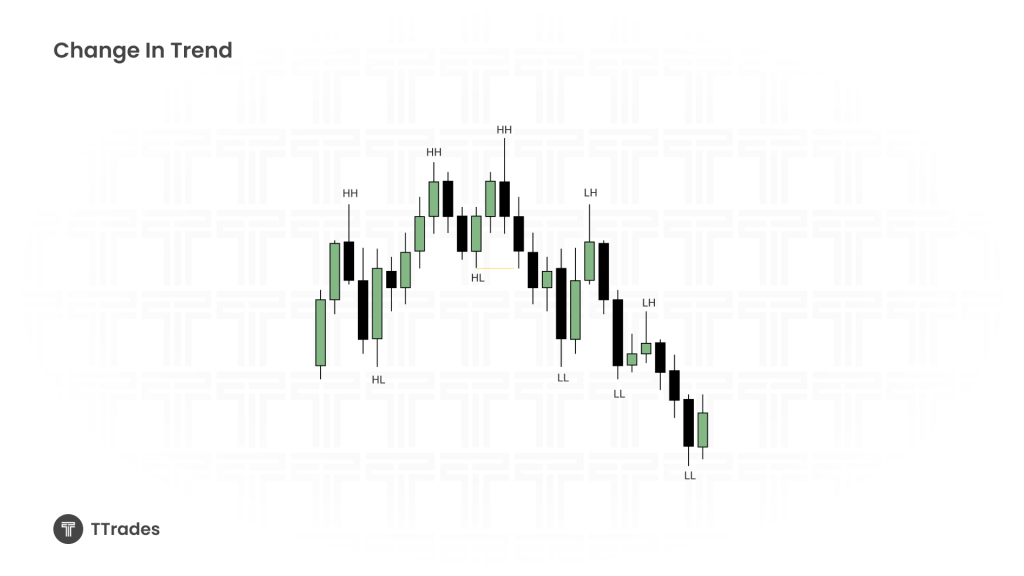
The key confirmation is displacement (strong price movement with momentum) that breaks prior structure.
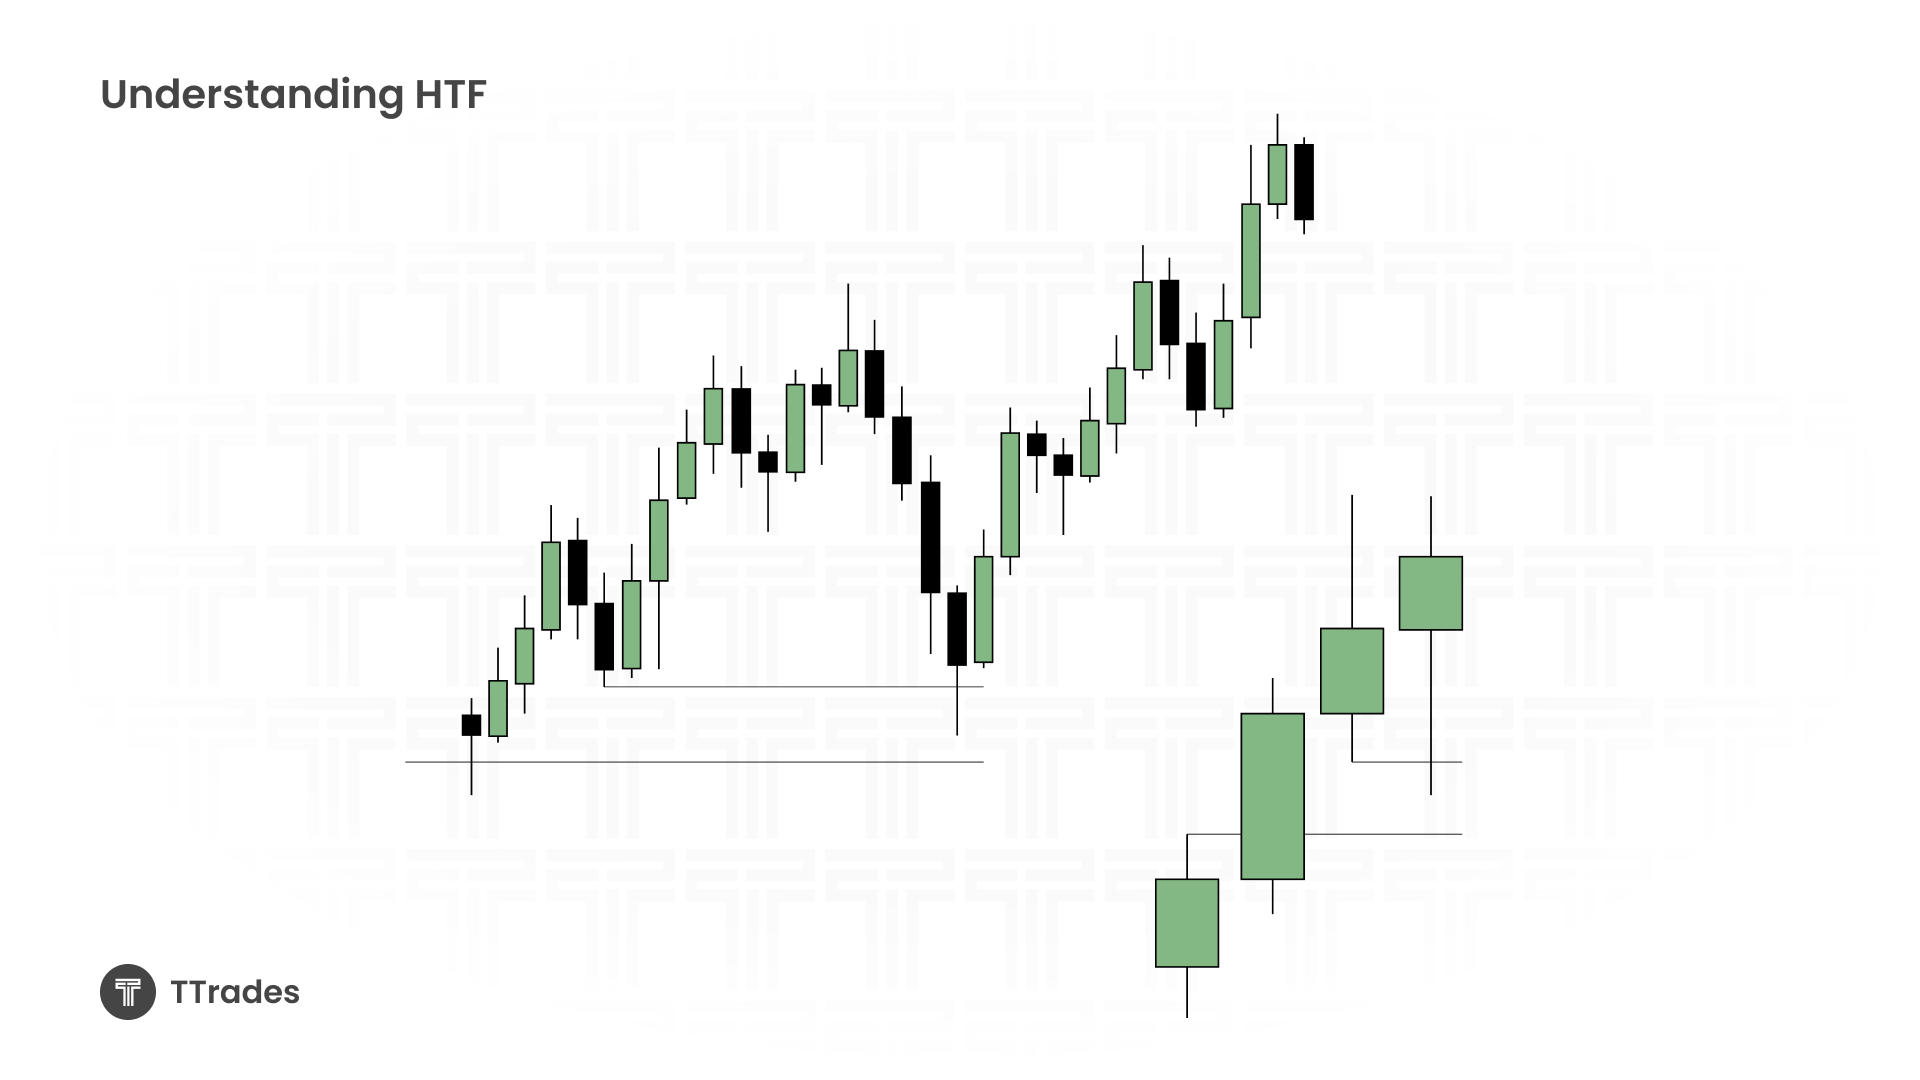
Higher Time Frame vs. Lower Time Frame
One of the biggest mistakes traders make is ignoring the higher time frame trend:
On a lower time frame, a sudden drop may look like a bearish shift.
On the higher time frame, the same move may just be a retracement before continuation higher.
Always align trades with the higher time frame bias for higher probability setups.
Practical Example of an Uptrend
Price forms a higher high.
A higher low develops.
Another higher high confirms continuation.
Repeating this process shows the flow of a bullish trend.
Practical Example of a Downtrend
Price forms a lower low.
A lower high develops.
Another lower low confirms continuation.
This sequence maps out bearish price action.
Recognizing False Shifts
Not every break of structure is a full reversal. Sometimes:
A lower time frame “trend shift” is just a pullback into a discount or premium area on a higher time frame.
Traders who ignore this often get stopped out by retracements.
The solution: always zoom out and confirm the dominant trend before making entries.
Why Practice is Essential
The best way to master market structure is through consistent chart study:
Mark swing highs and swing lows.
Identify whether the market is making higher highs/lows or lower highs/lows.
Watch for displacement and structural breaks.
Over time, you’ll train your eye to quickly recognize shifts and opportunities.