
Introduction
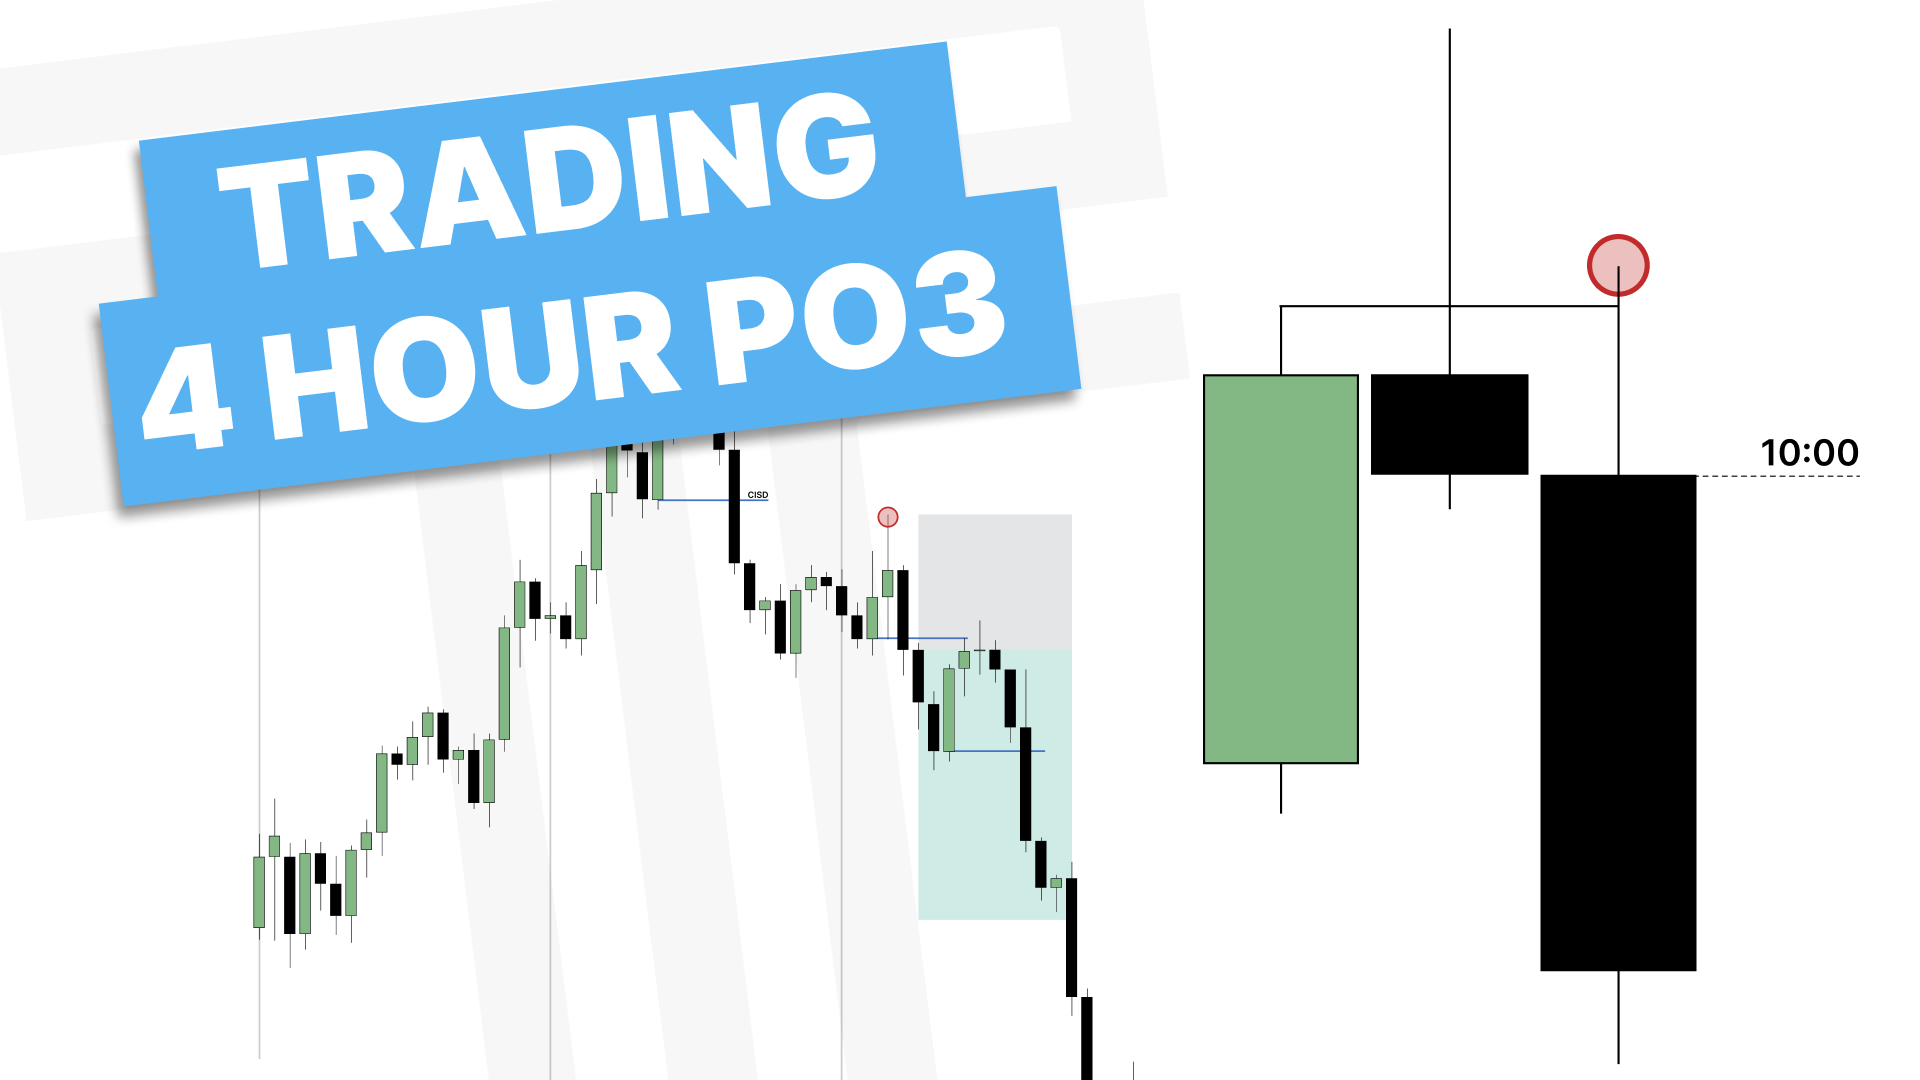
The “Power of 3” is one of the most effective ways to trade higher timeframe candles, especially on the 4-hour chart. At its core, it follows the AMD model: accumulation, manipulation, and distribution. When applied to 4-hour candles, this model helps identify whether price is building up, running stops, or expanding in the true direction. In this guide, we’ll break down how to read 4-hour candles using the open, high, low, and close, and how to use lower timeframes to time entries more effectively.
The Power of 3 and AMD
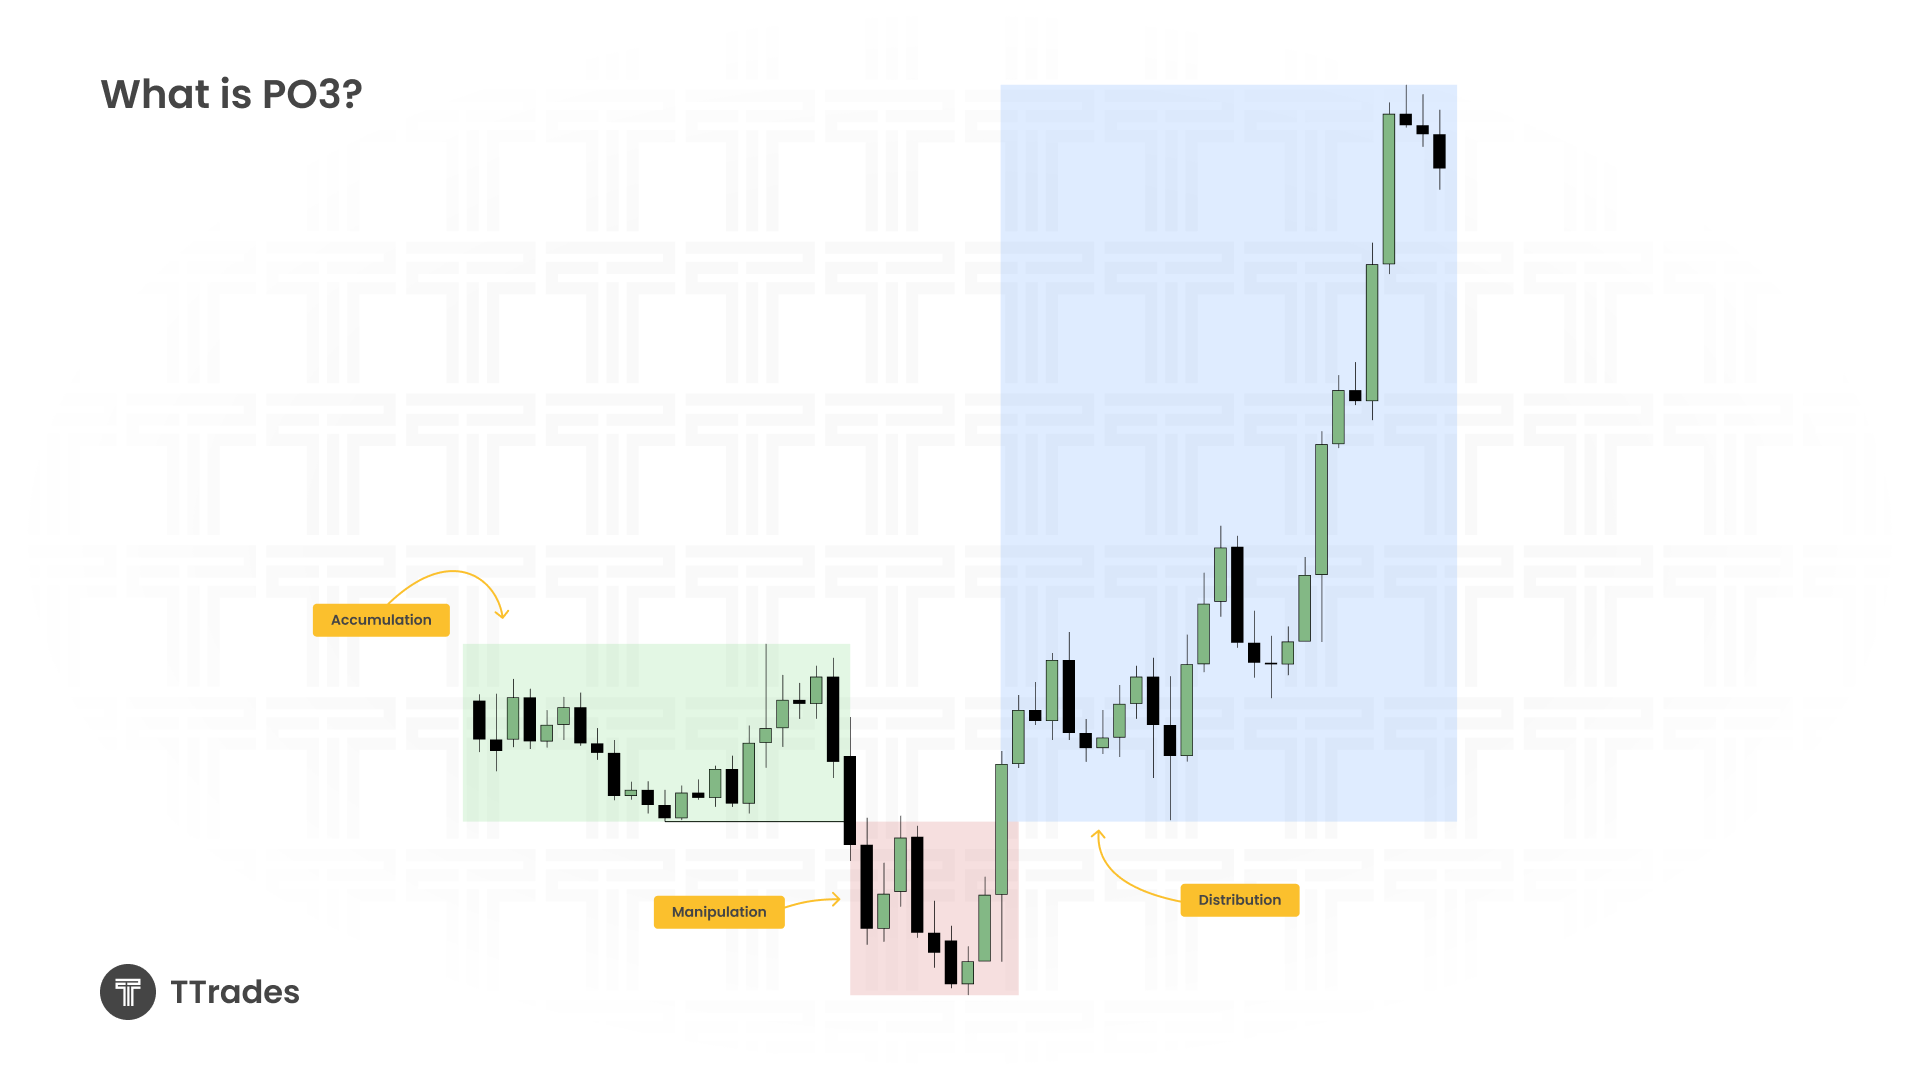
The Power of 3 is built on three phases:
Accumulation: a range where price builds liquidity.
Manipulation: a false move against the intended direction.
Distribution: the true expansion or directional move.
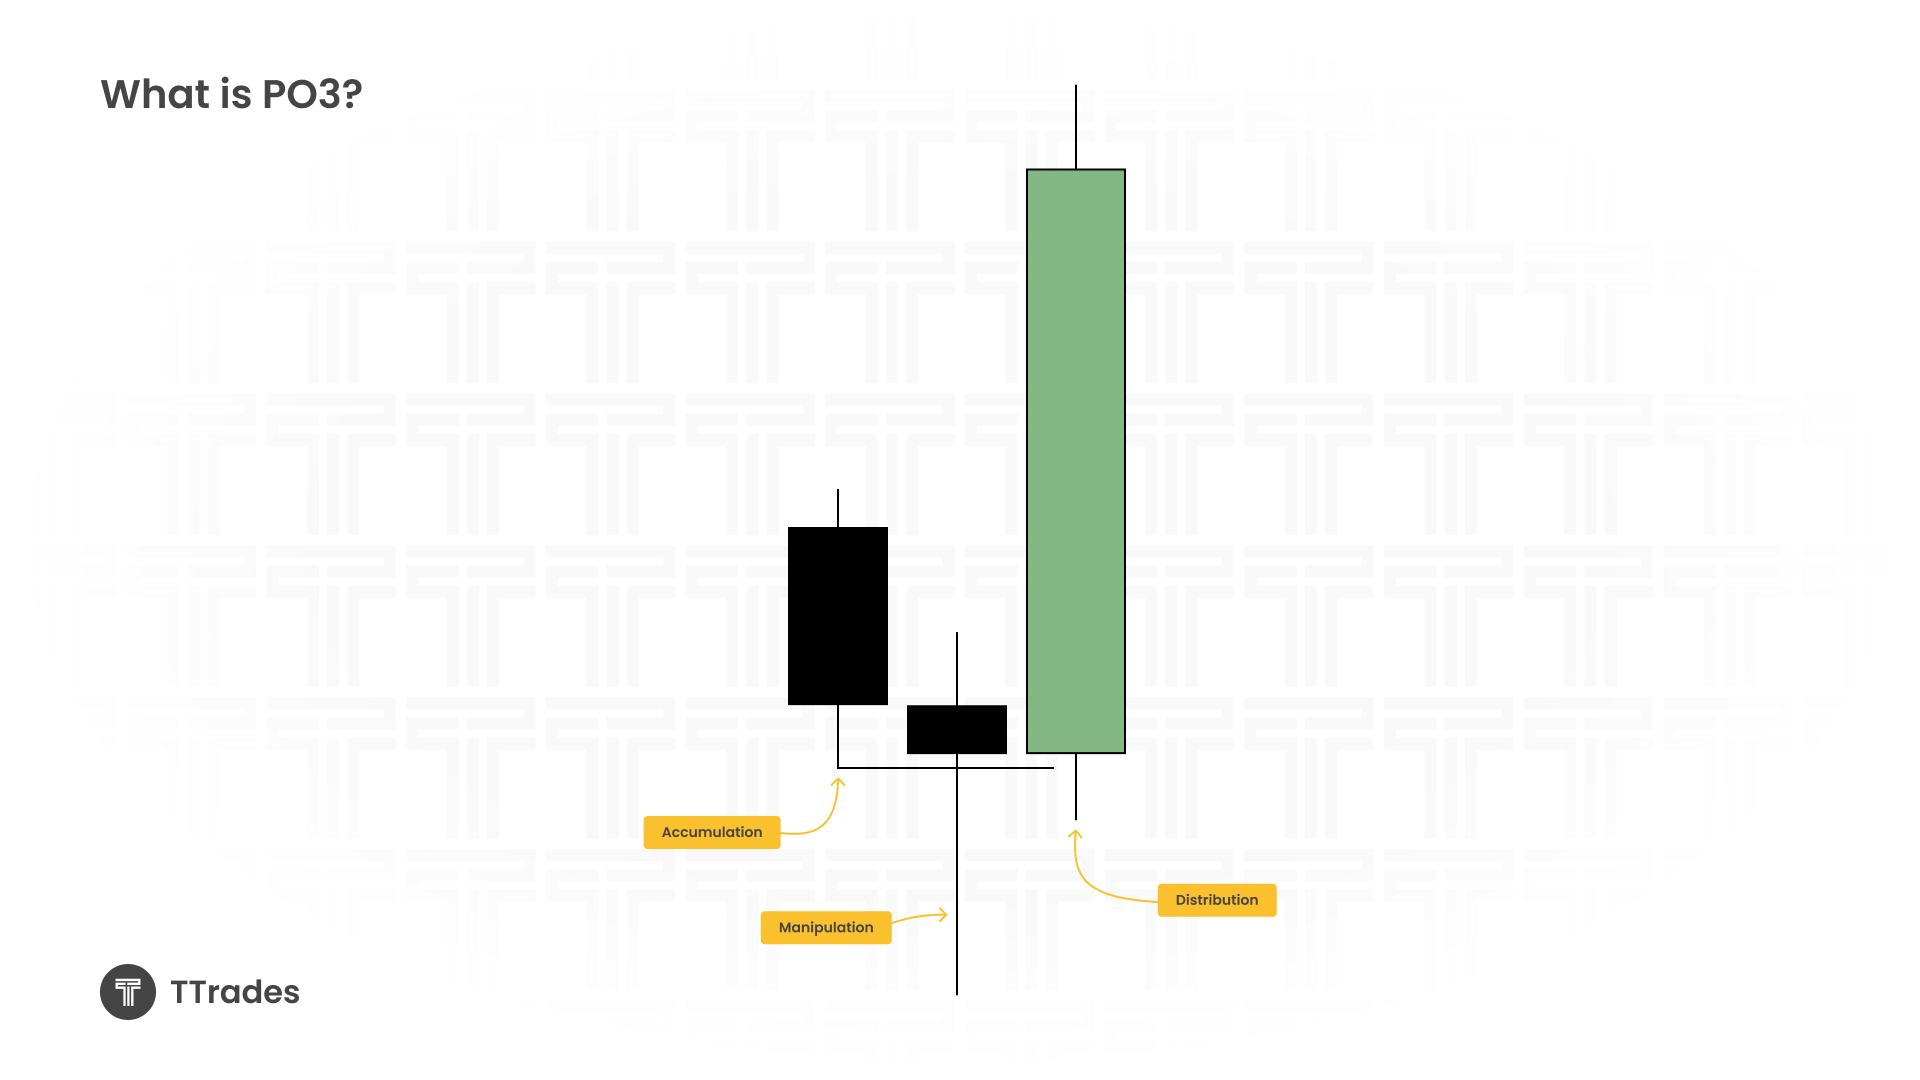
When looking at a 4-hour candle, the first candle in sequence is accumulation. Candle two often shows manipulation, and candle three tends to deliver the expansion. However, sometimes manipulation and distribution happen within the same candle. The trick is recognizing whether the wick that forms early in the candle supports expansion or not.
Identifying Candle Types
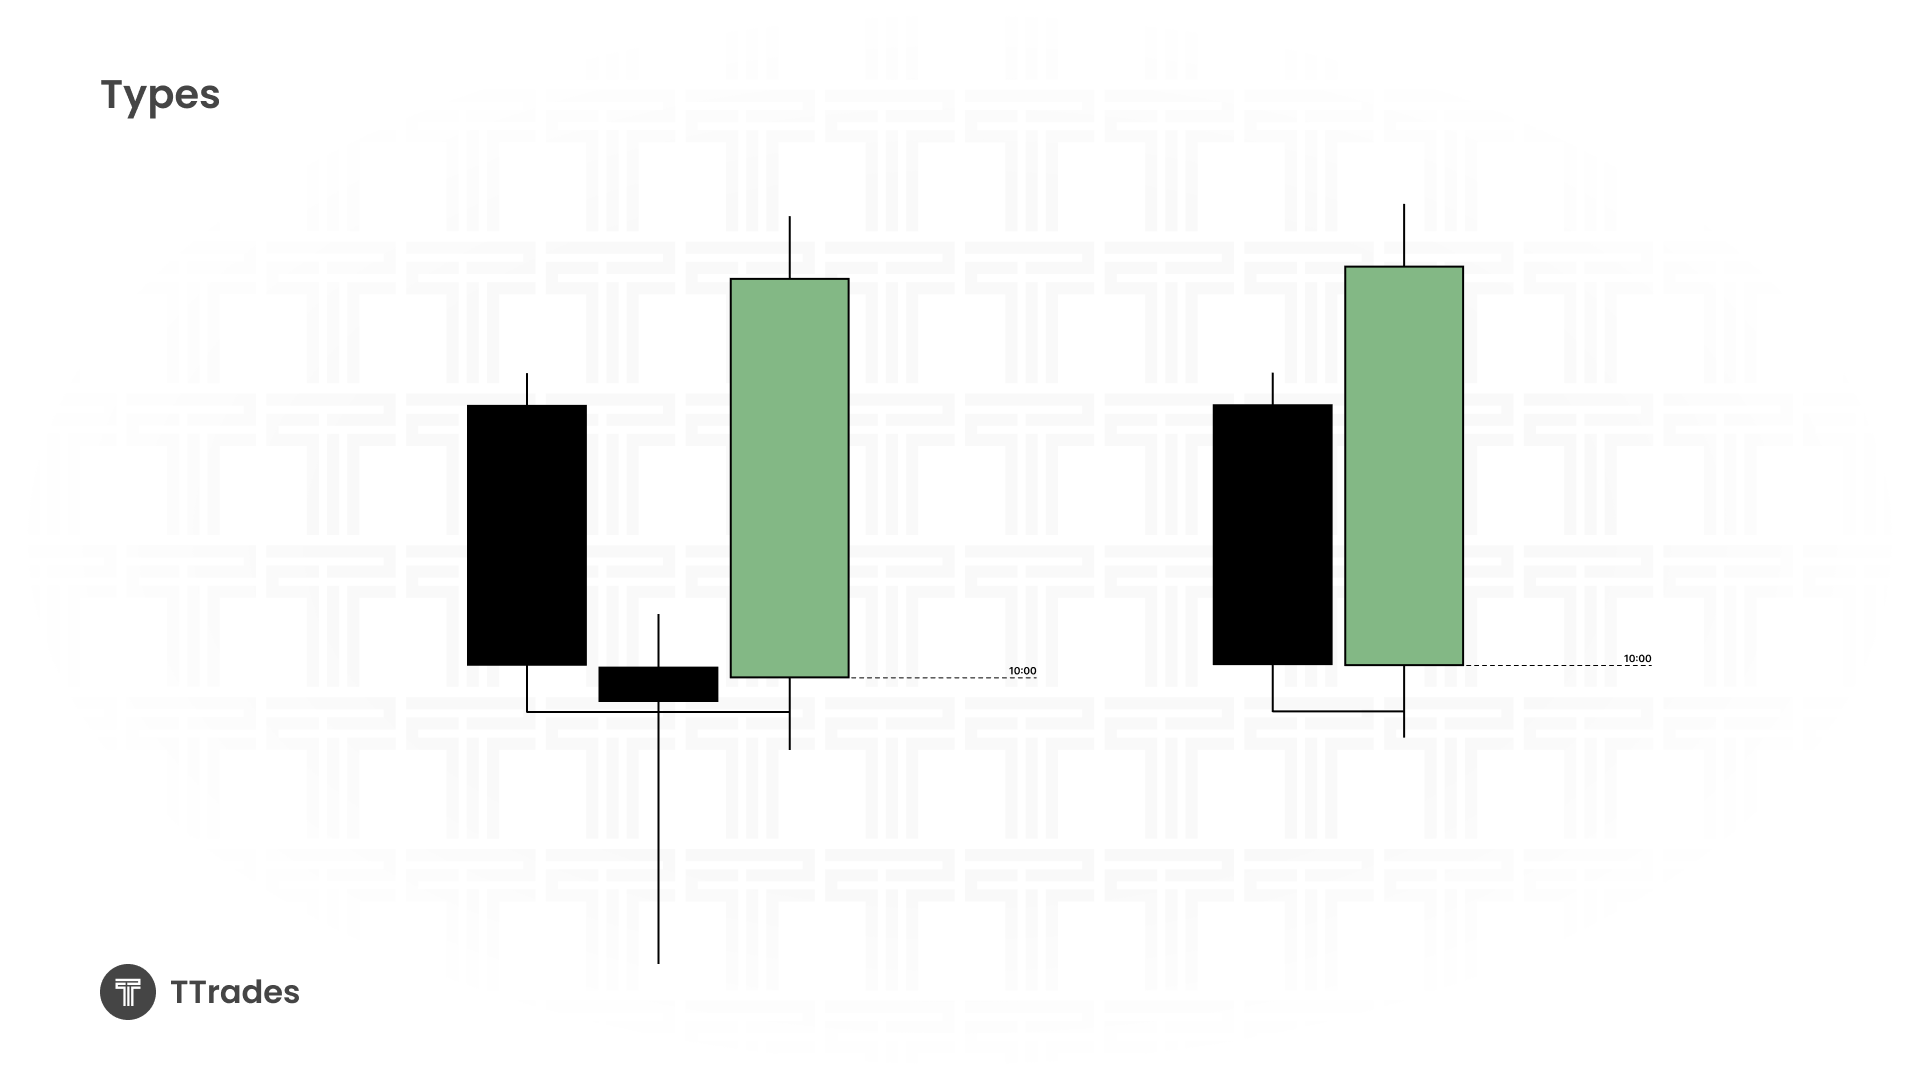
If candle two has a large opposing run — meaning price makes a deep move against your bias — it usually does not support expansion within that candle. Instead, you wait for candle three to deliver the move.
If candle two has only a shallow wick, that wick can serve as manipulation and the body can become the expansion. In this case, you can trade within the same 4-hour candle.
The goal is to wait for the wick to form, confirm it as a protected swing, and then trade in the direction of the body. Trying to catch the wick itself often leads to stop-outs.
Using Lower Timeframes
To trade a 4-hour power of 3 effectively, you need to drill down to lower timeframes. The 15-minute chart pairs well with the 4-hour for entry confirmation. For futures, key times like 2am, 6am and 10am often serve as anchors for reversals and continuations. In forex, the 1am, 5am, 9am sessions are more relevant.
On the lower timeframe, look for:
A reach into a point of interest.
A change in the state of delivery (CISD) to confirm a protected swing.
Continuation entries after the wick has formed.
This approach allows you to align your trades with the expansion phase of the 4-hour candle.
Continuation vs. Reversal Scenarios
There are two main scenarios you’ll see:
Reversal to expansion: Candle two forms a small wick, confirms a protected swing, and expands in the same candle.
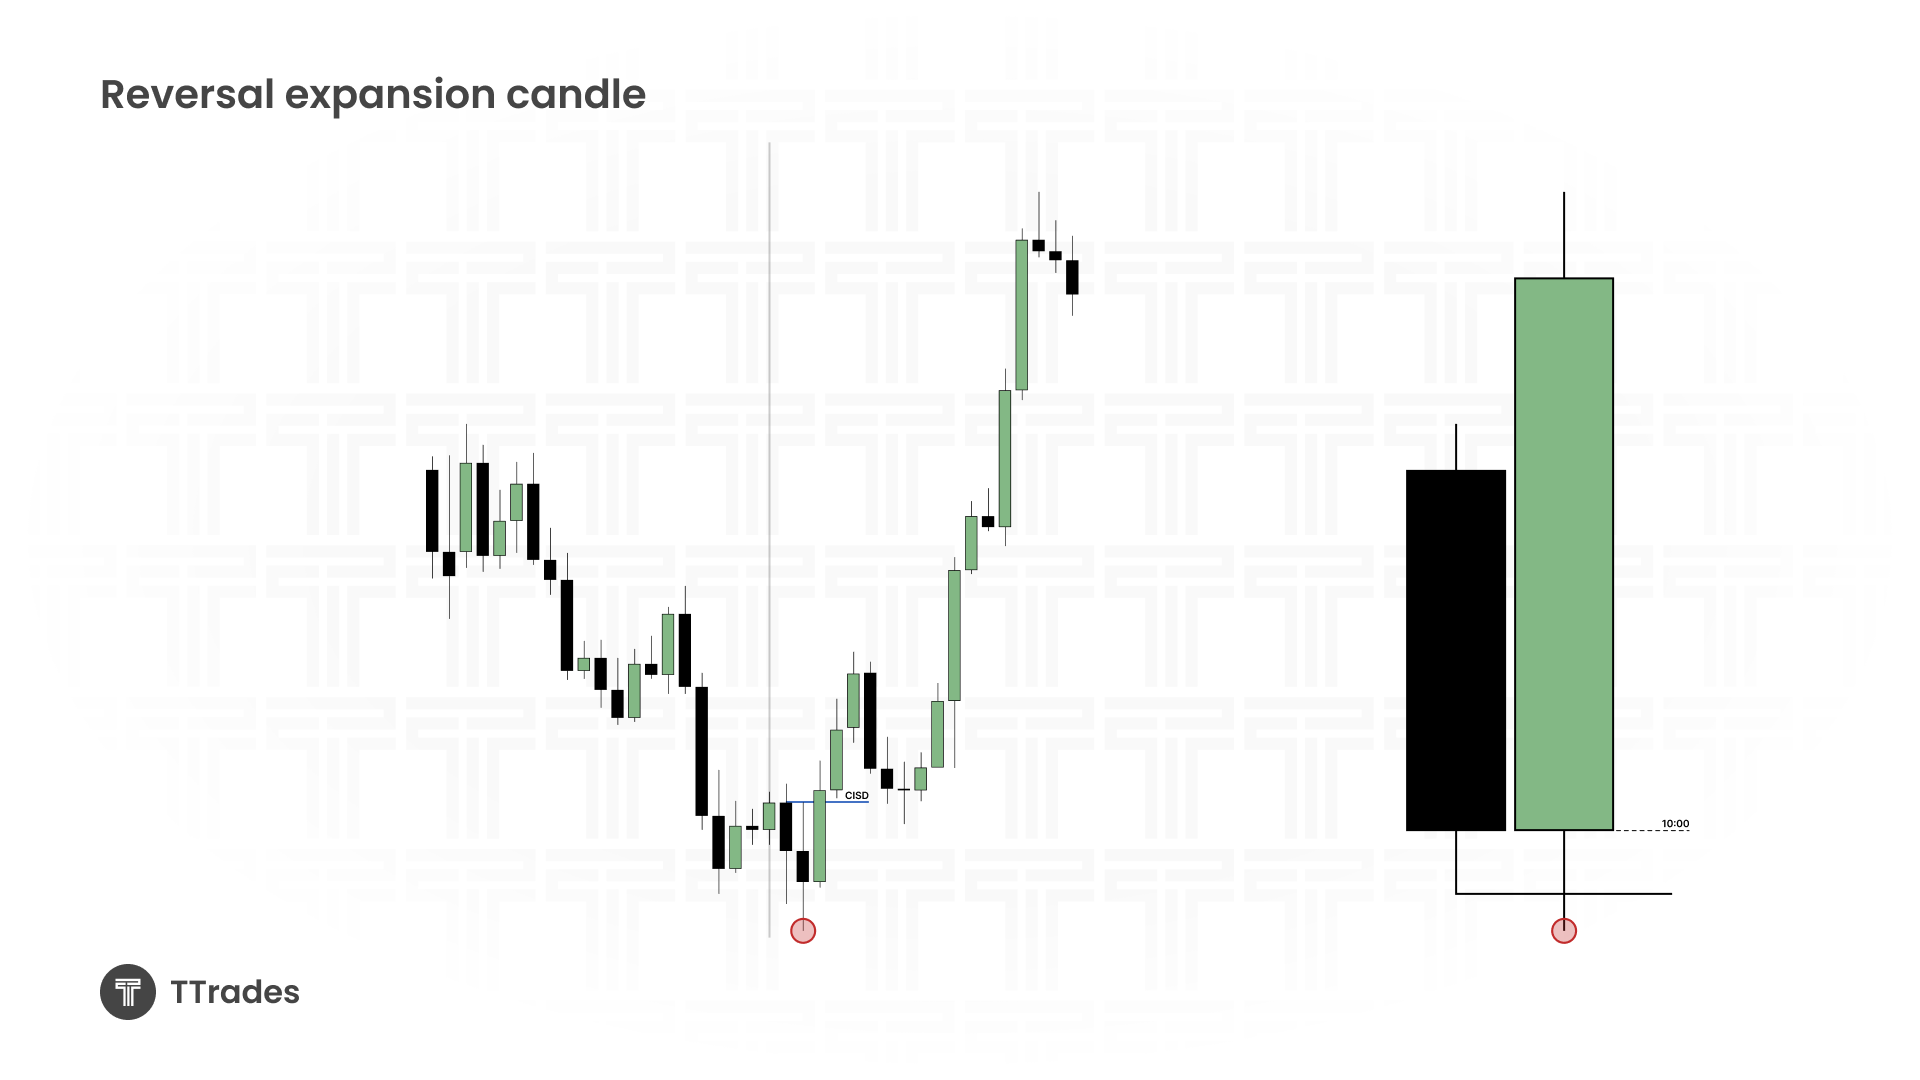
- Continuation expansion: Candle two forms a deep wick (large opposing run), confirming a reversal. Expansion then occurs in candle three.
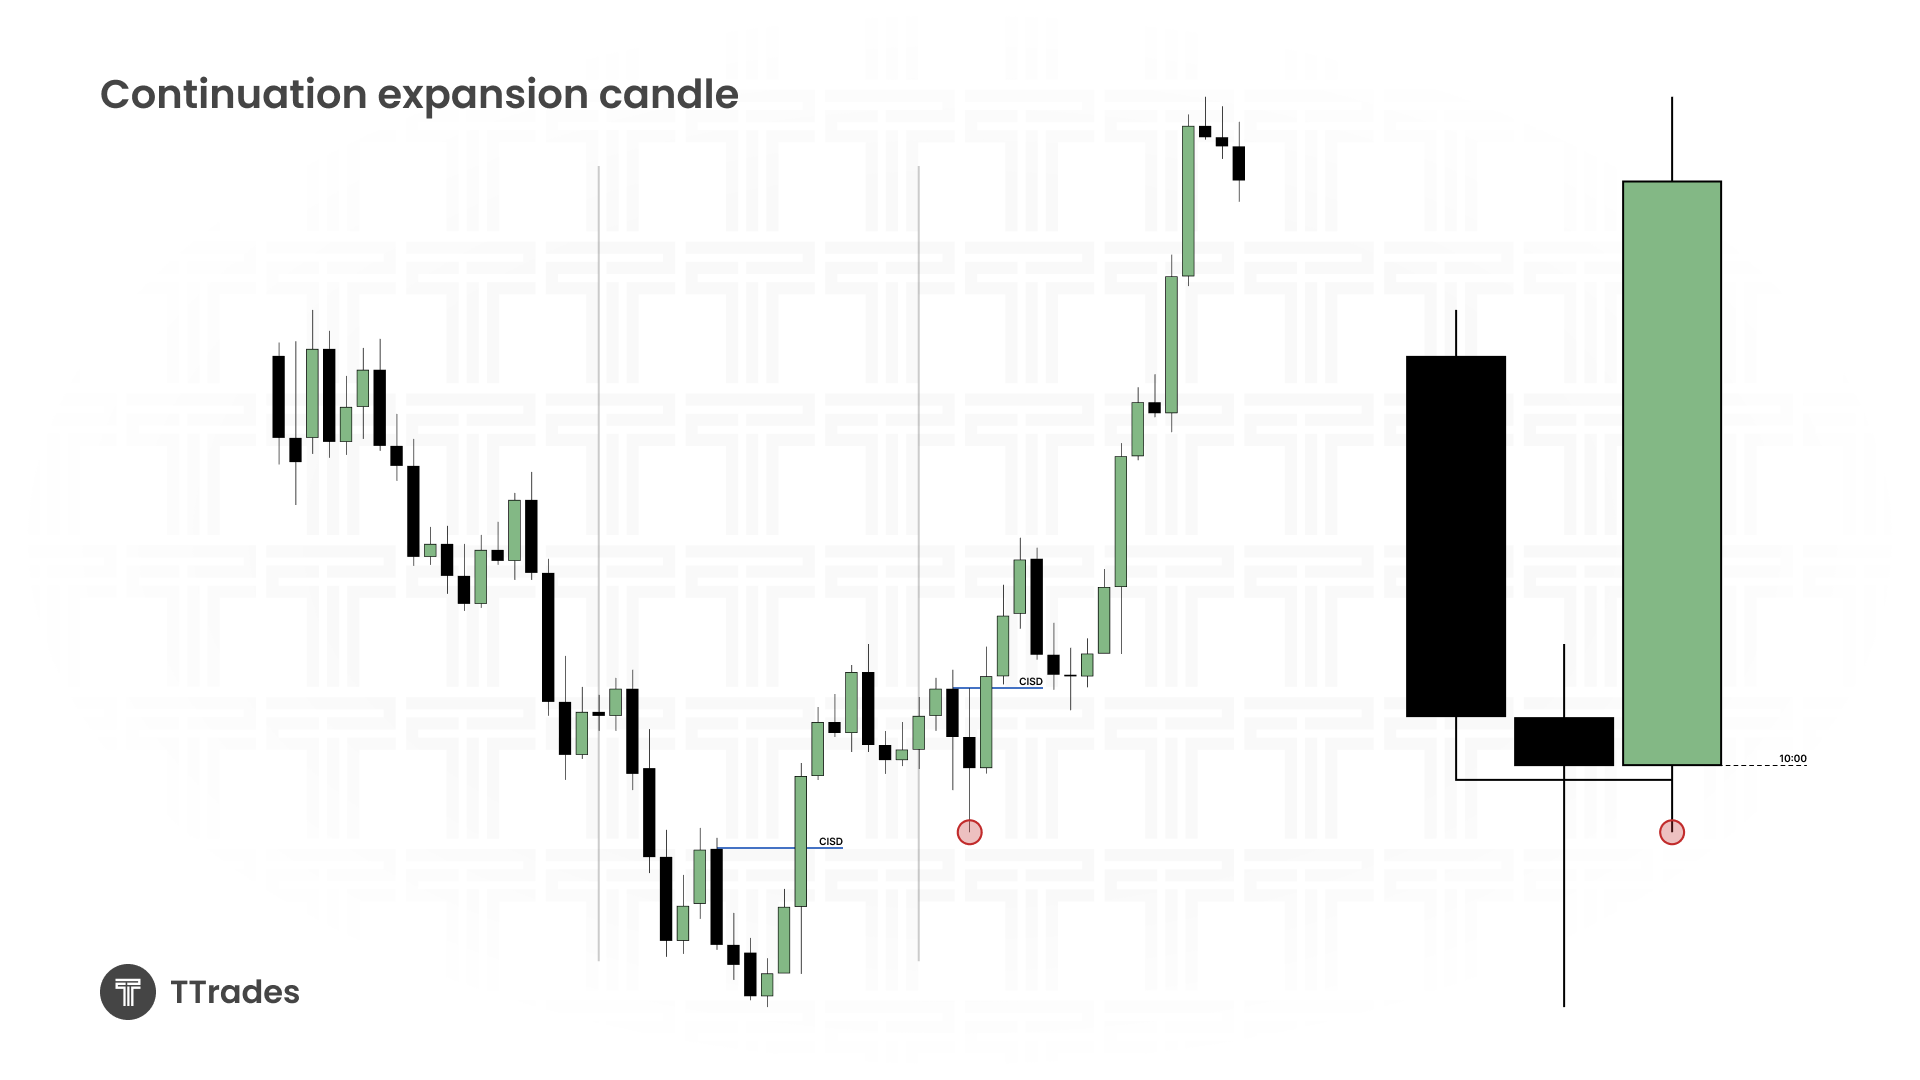
In both cases, the key is waiting for the wick to form and then trading the expansion move that follows.
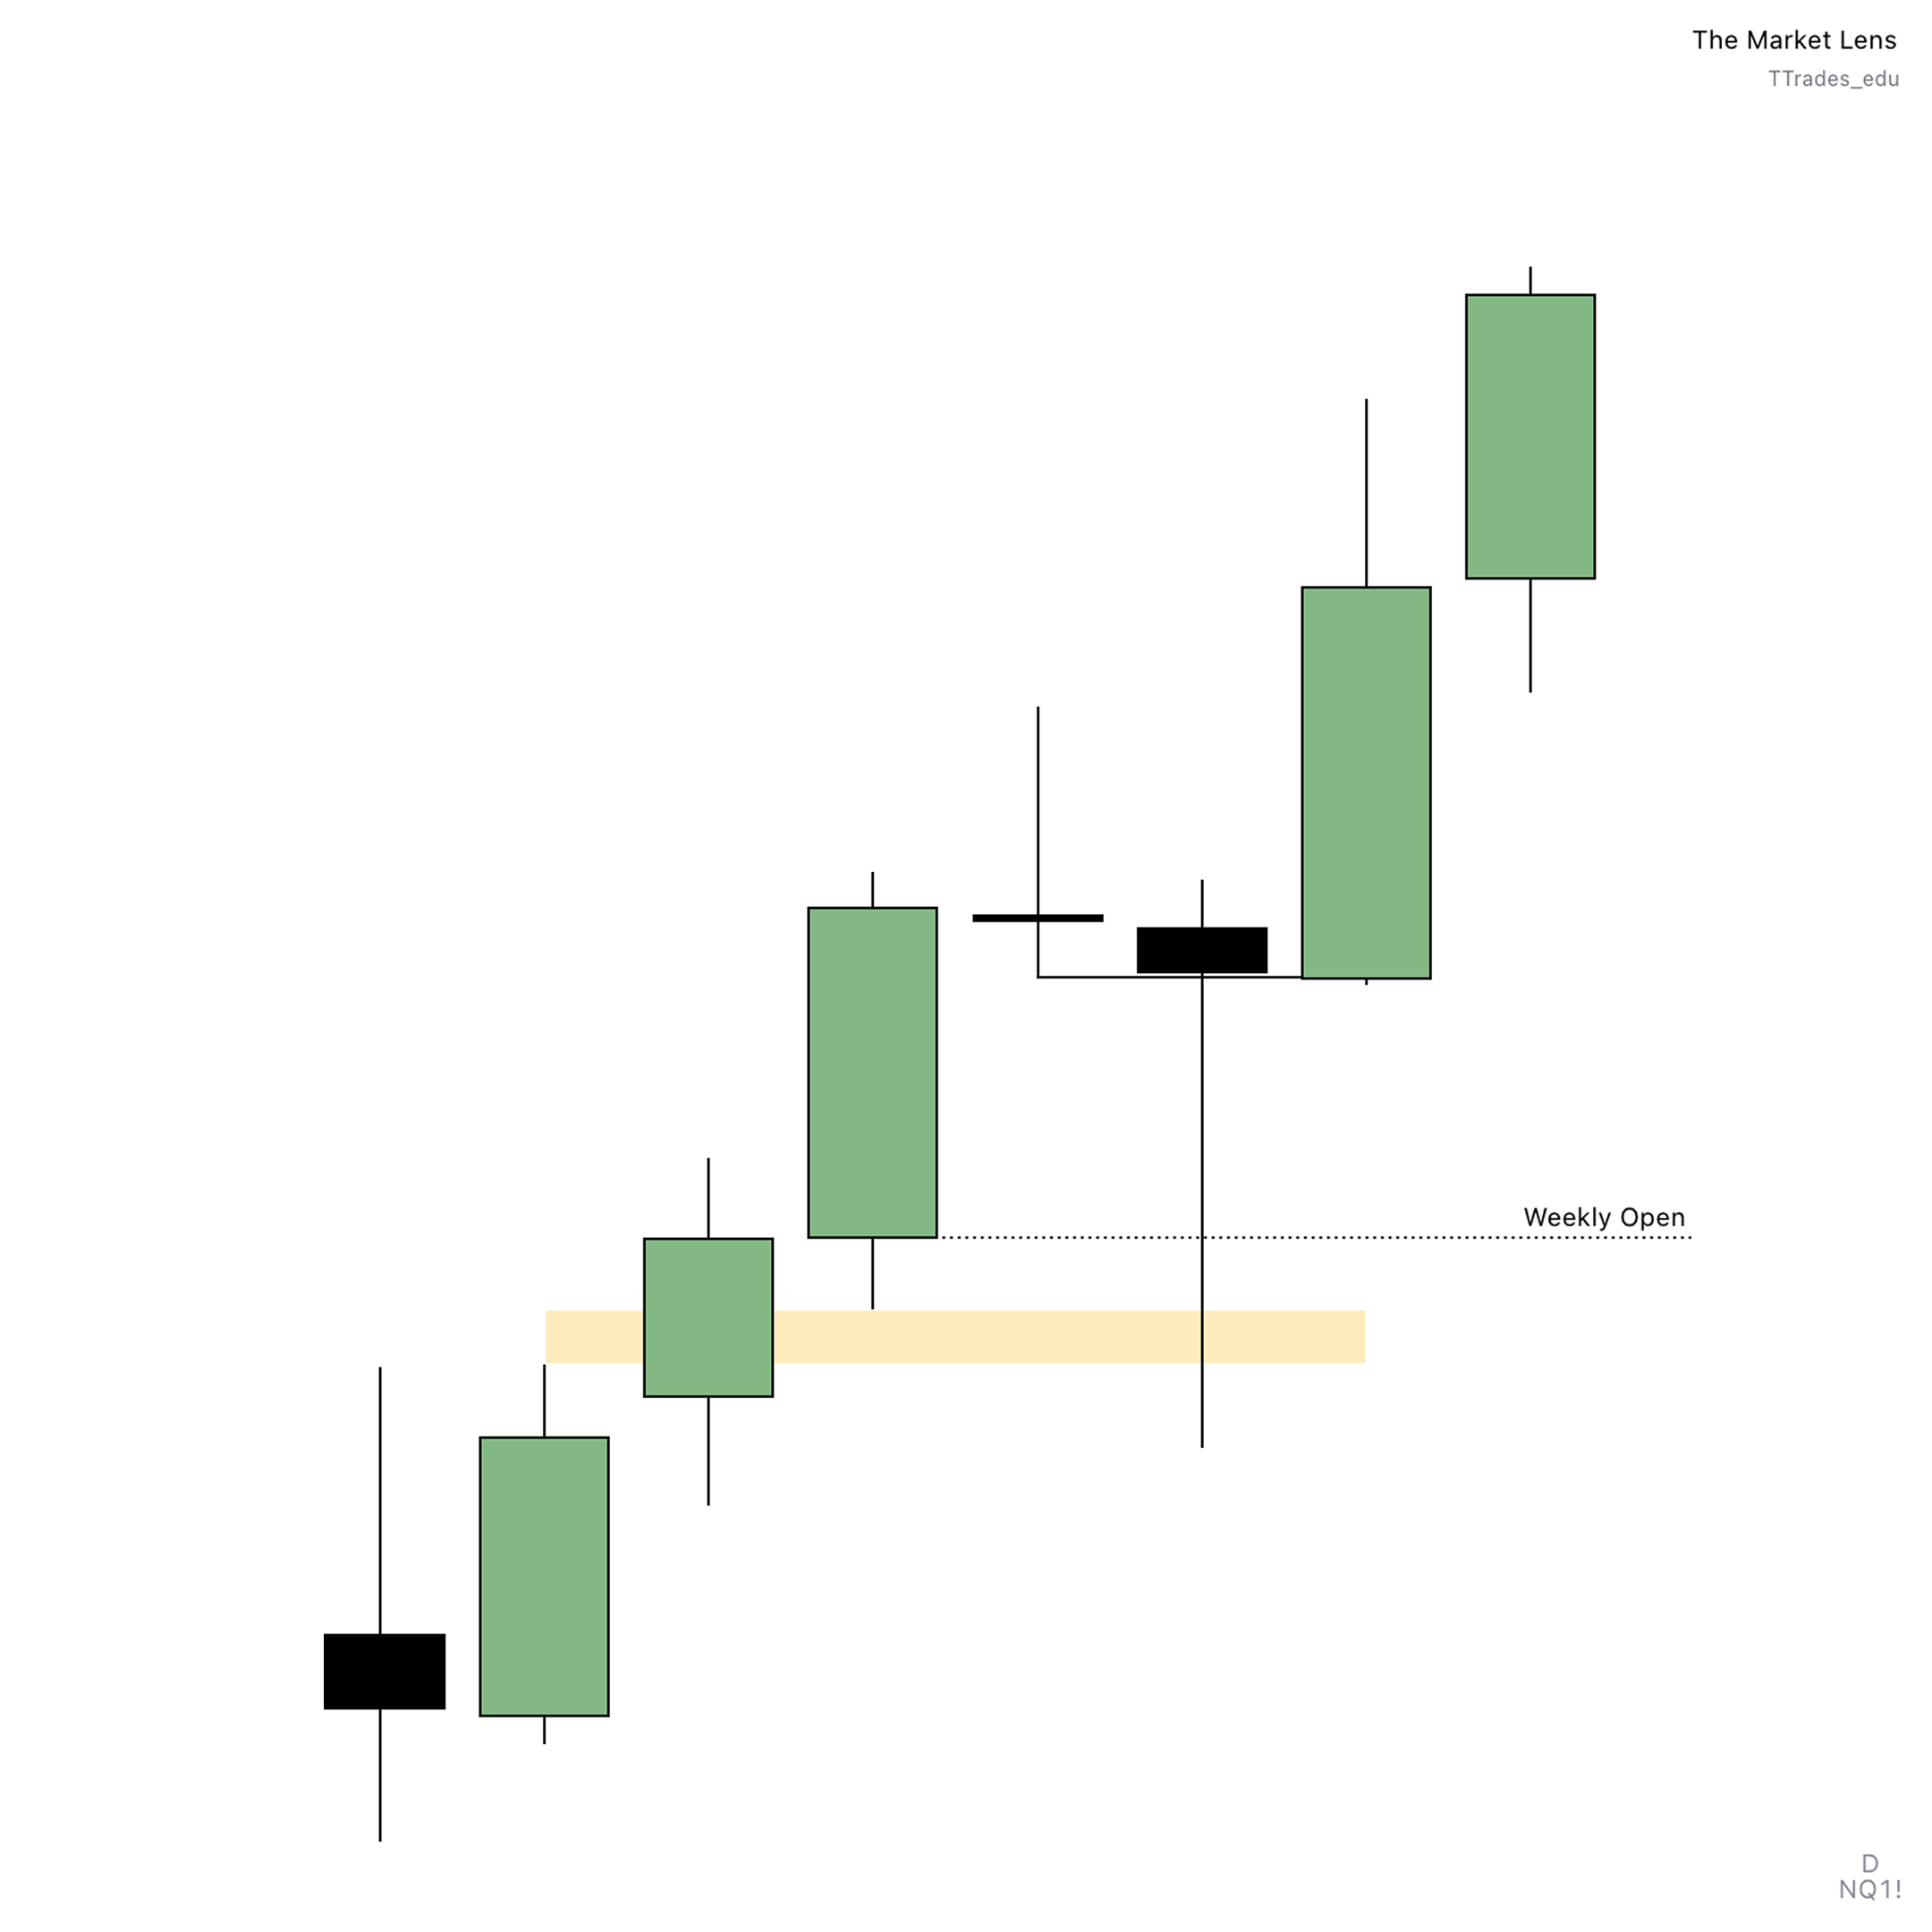
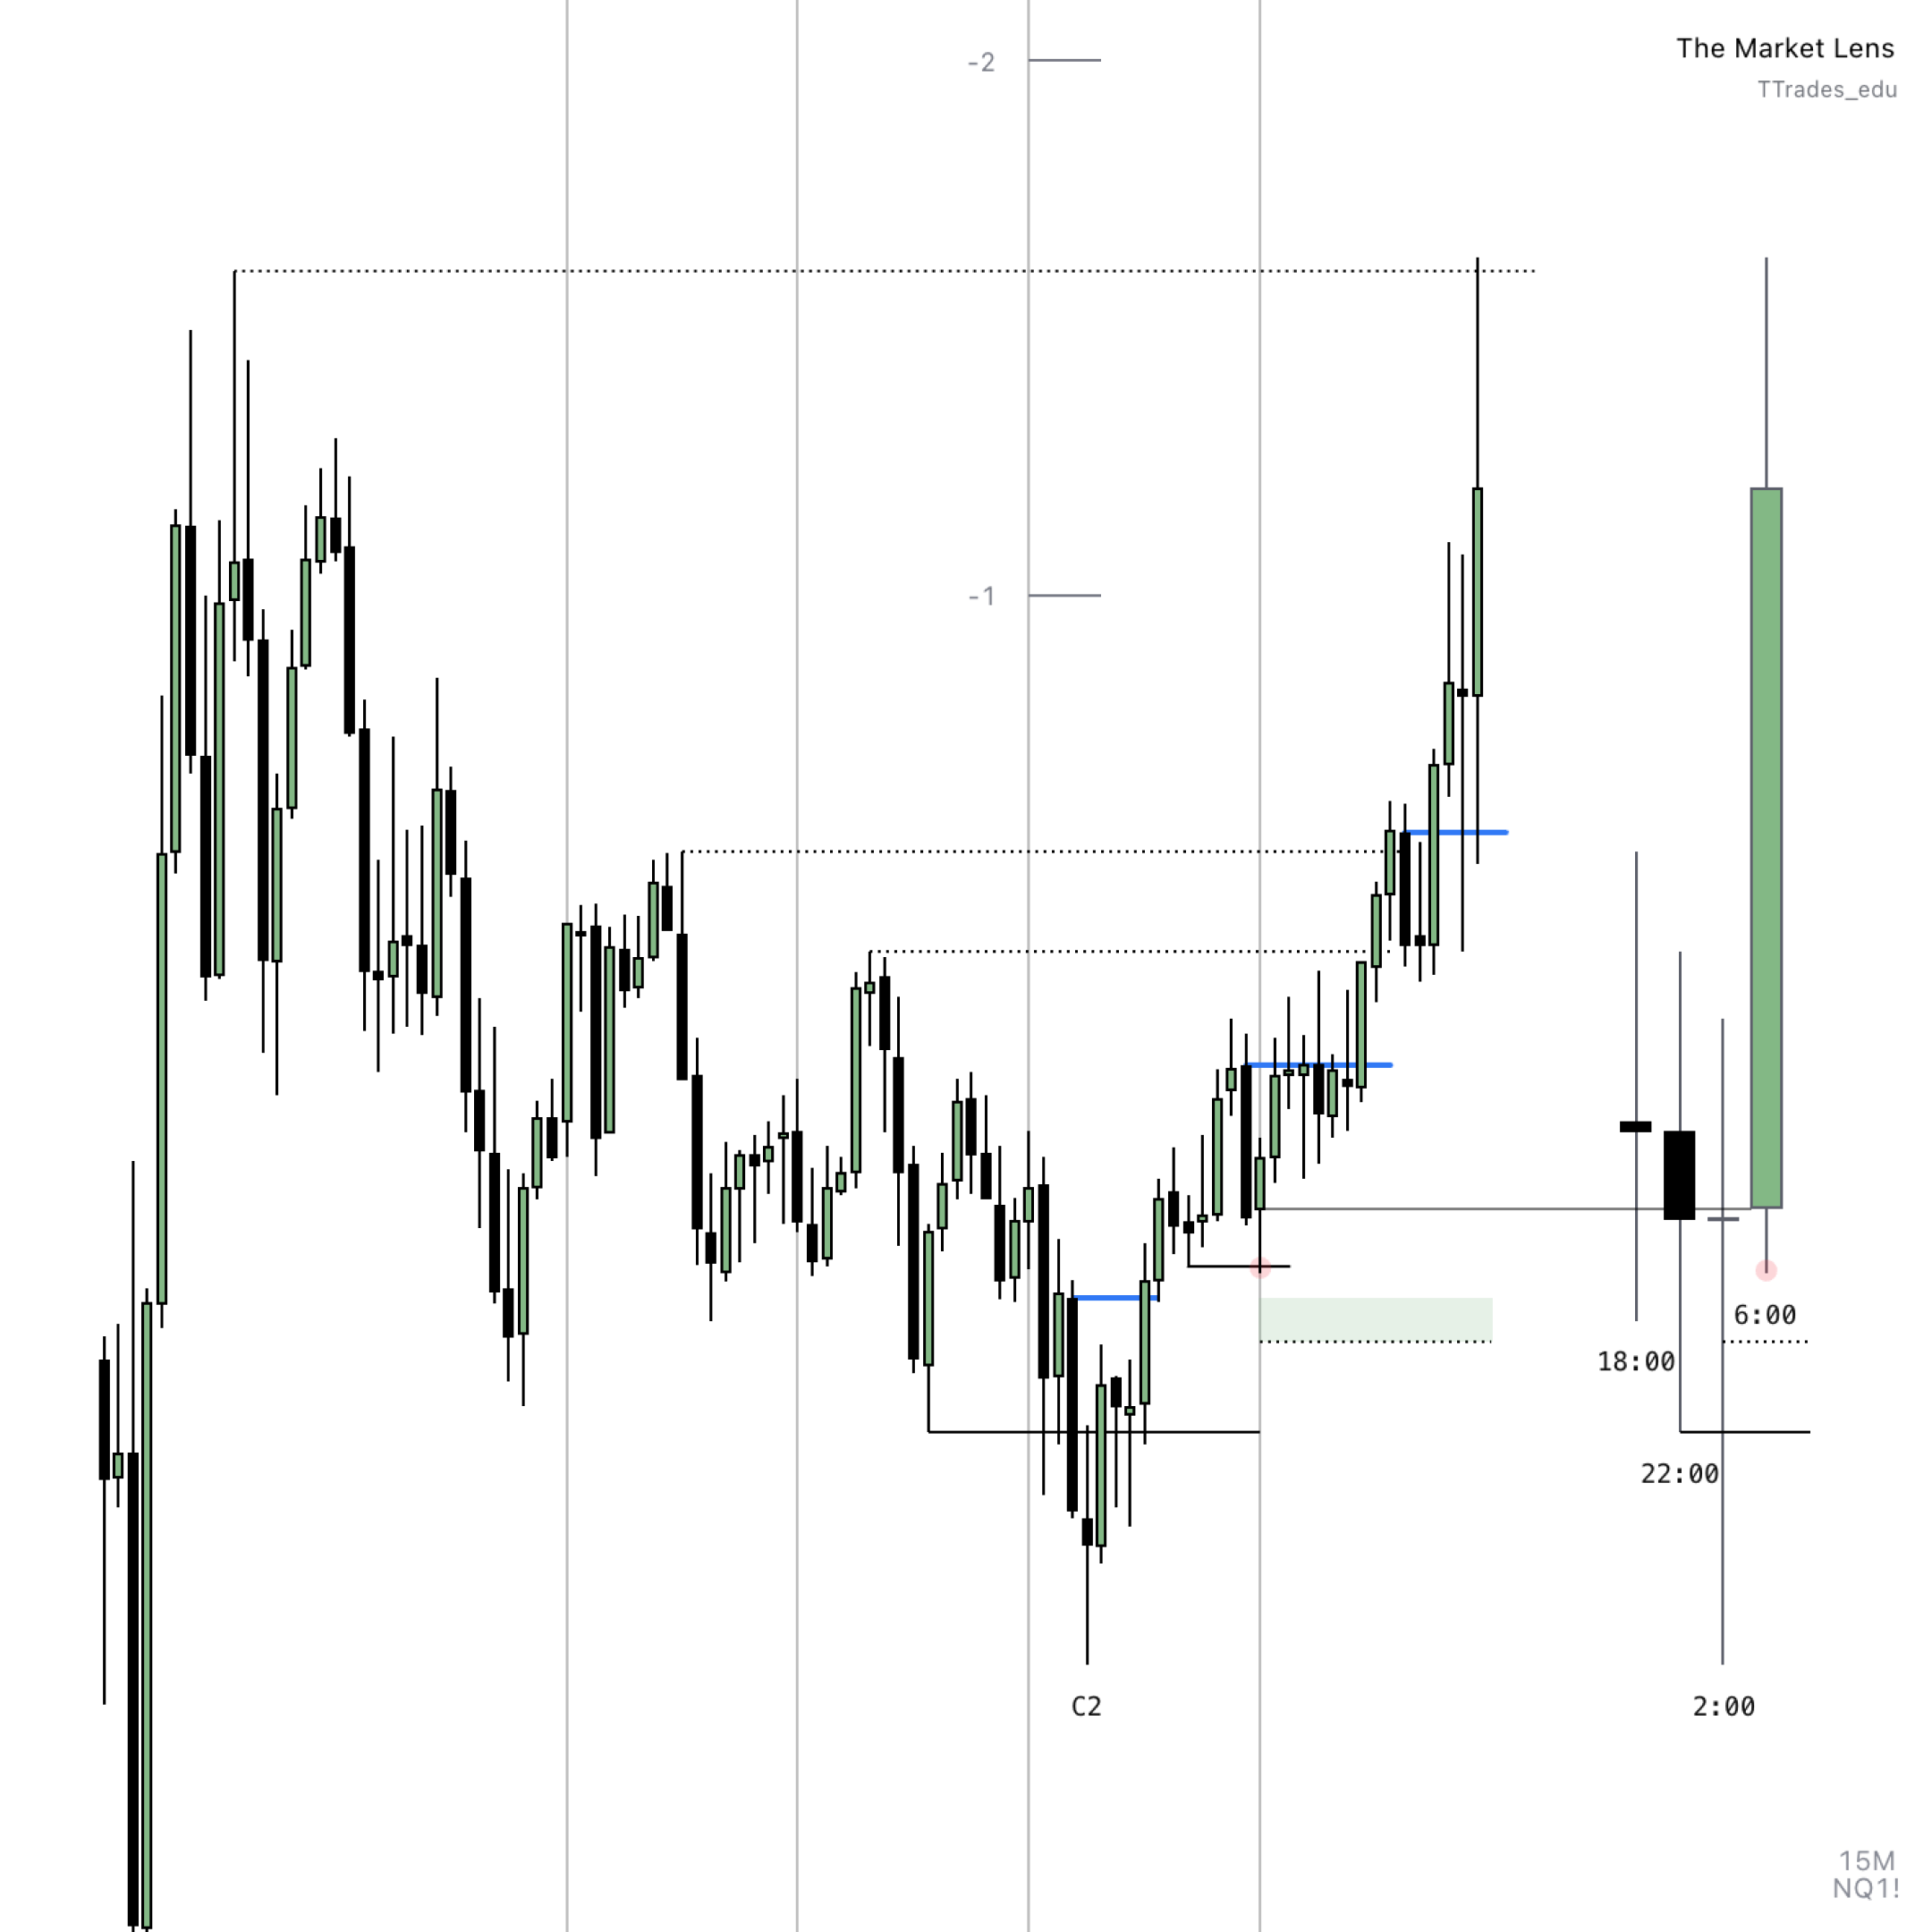
Practical Example
Suppose Wednesday closes with a reversal candle, and Thursday delivers a strong continuation higher. You can anticipate Friday to continue that move, especially if Thursday closed outside Wednesday’s range.
Friday on the 15-minute chart, you would wait for the closure of the 2:00am candle, which creates a reversal candle. Upon the open of the 6:00am candle, wait for the 15-minute chart to create a protected swing, then trade to previous day high.
💡 Pro Tip: Look to align 1-hour & 5-minute or 30-minute & 3-minute Fractal Models with the 4-hour and daily charts for true expansion! .
Final Thoughts
Trading the 4-hour Power of 3 is about patience and timing. Always let the wick form before entering, then trade the expansion in line with the daily candle. Whether you’re trading futures or forex, aligning the 4-hour structure with lower timeframe confirmations provides high-probability entries. The most important phrase to remember is simple: “Let the wick form, then trade the body.”