Introduction
In this breakdown, I’m going to walk you through my favorite fractal trading model, the one I personally prefer to catch clean expansions with clarity and confidence. The entire approach is built around timeframe alignment, starting with the daily for bias, using the 4 hour for swing structure, and executing on the 15 minute timeframe.
This is not about predicting tops or bottoms. It is about letting the market show its hand and then stepping in when multiple expansion candles line up in the same direction.
The Foundation: Daily Bias Comes First
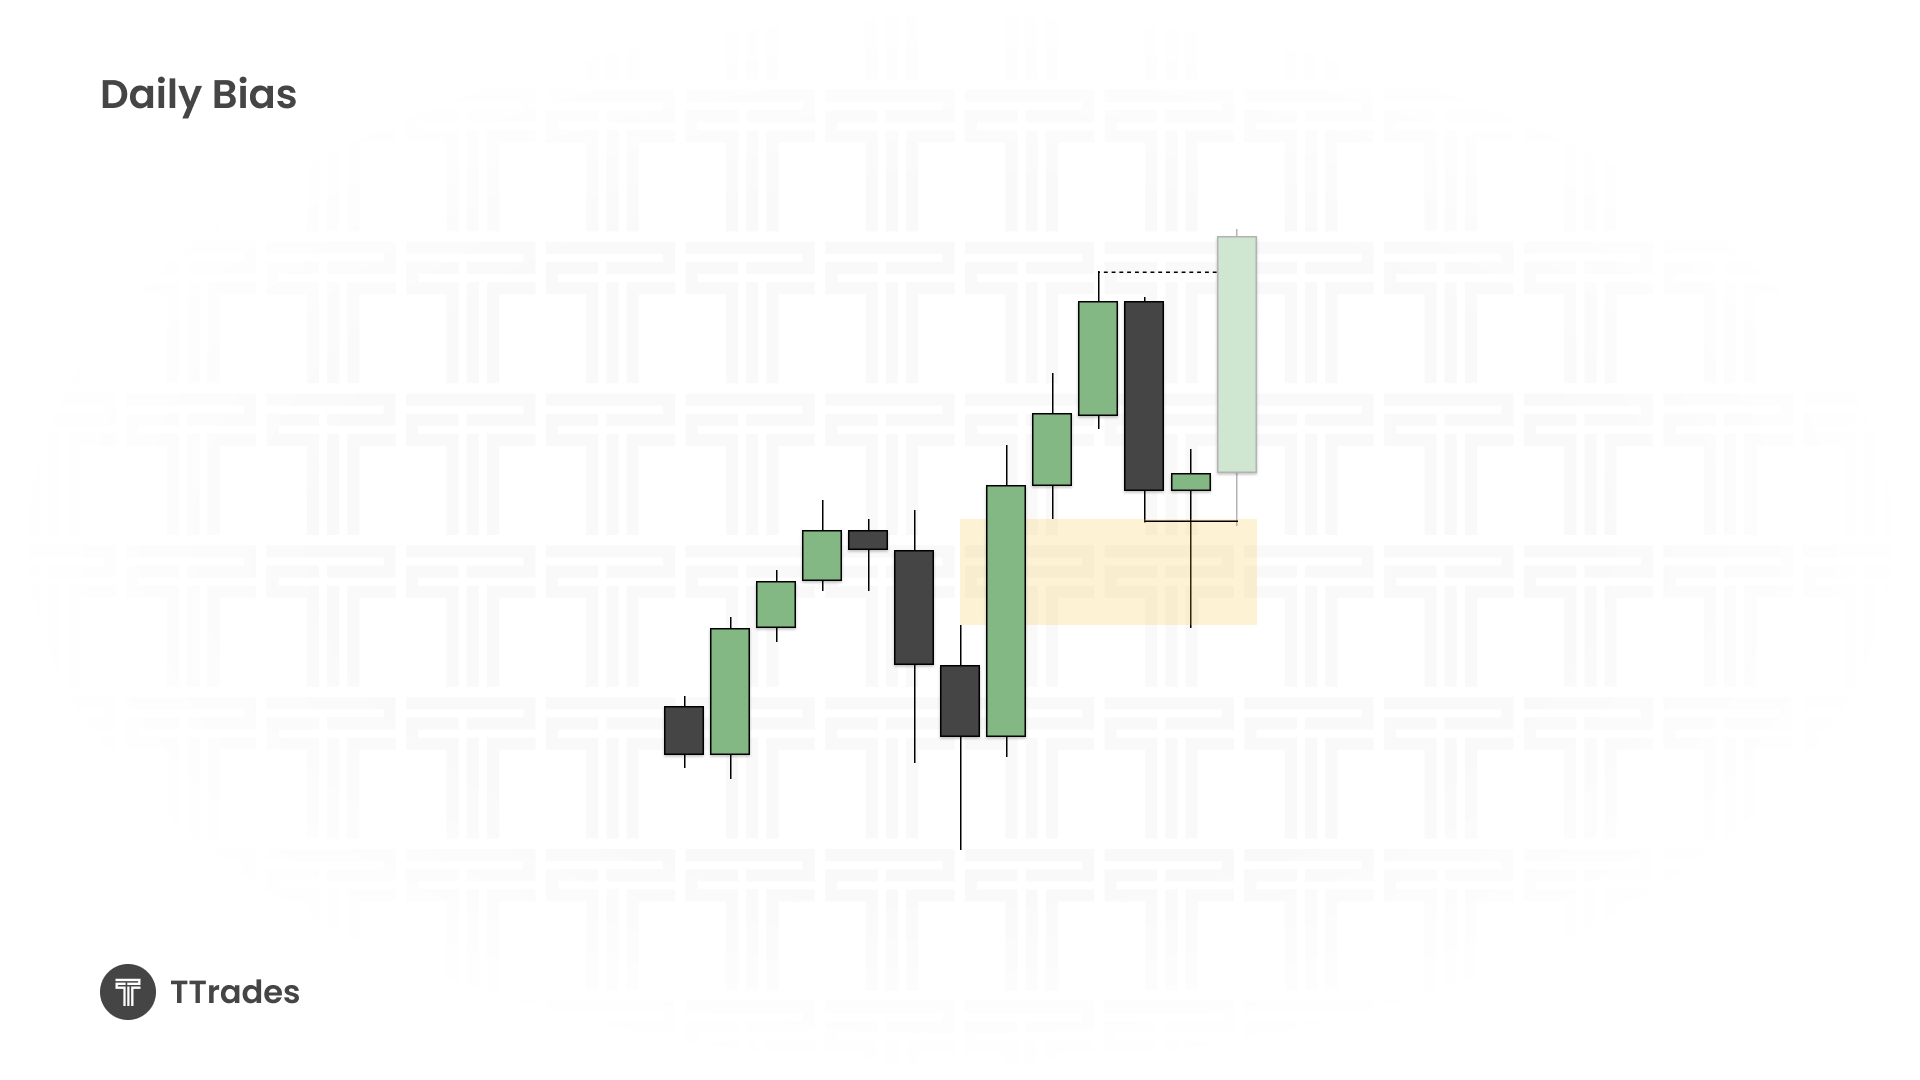
Everything starts with the daily chart. Before looking at lower timeframes, there needs to be a clear daily bias.
The simplest way to get that bias is through a candle to closure at a meaningful point of interest. That point of interest can be a prior high, a prior low, or a fair value gap. What matters is that price shows acceptance through a daily close.
I am either looking for a daily candle to close as a candle 2 closure. When this happens, I can anticipate expansion in the following daily candle, which is what I refer to as candle three. That is the day I am interested in trading.
Trading Candle Three on the Daily
Once the daily bias is established, the objective is simple. I want to let the daily wick form and then trade the body of the candle rather than chasing extremes.
In a bullish scenario, I want price to open and trade lower first. That lower move forms the wick of the daily candle. Once that wick is likely complete, I can then look for continuation higher as the body expands. This approach helps avoid emotional entries and keeps me aligned with the trend.
Using the 4 Hour Chart for Swing Structure
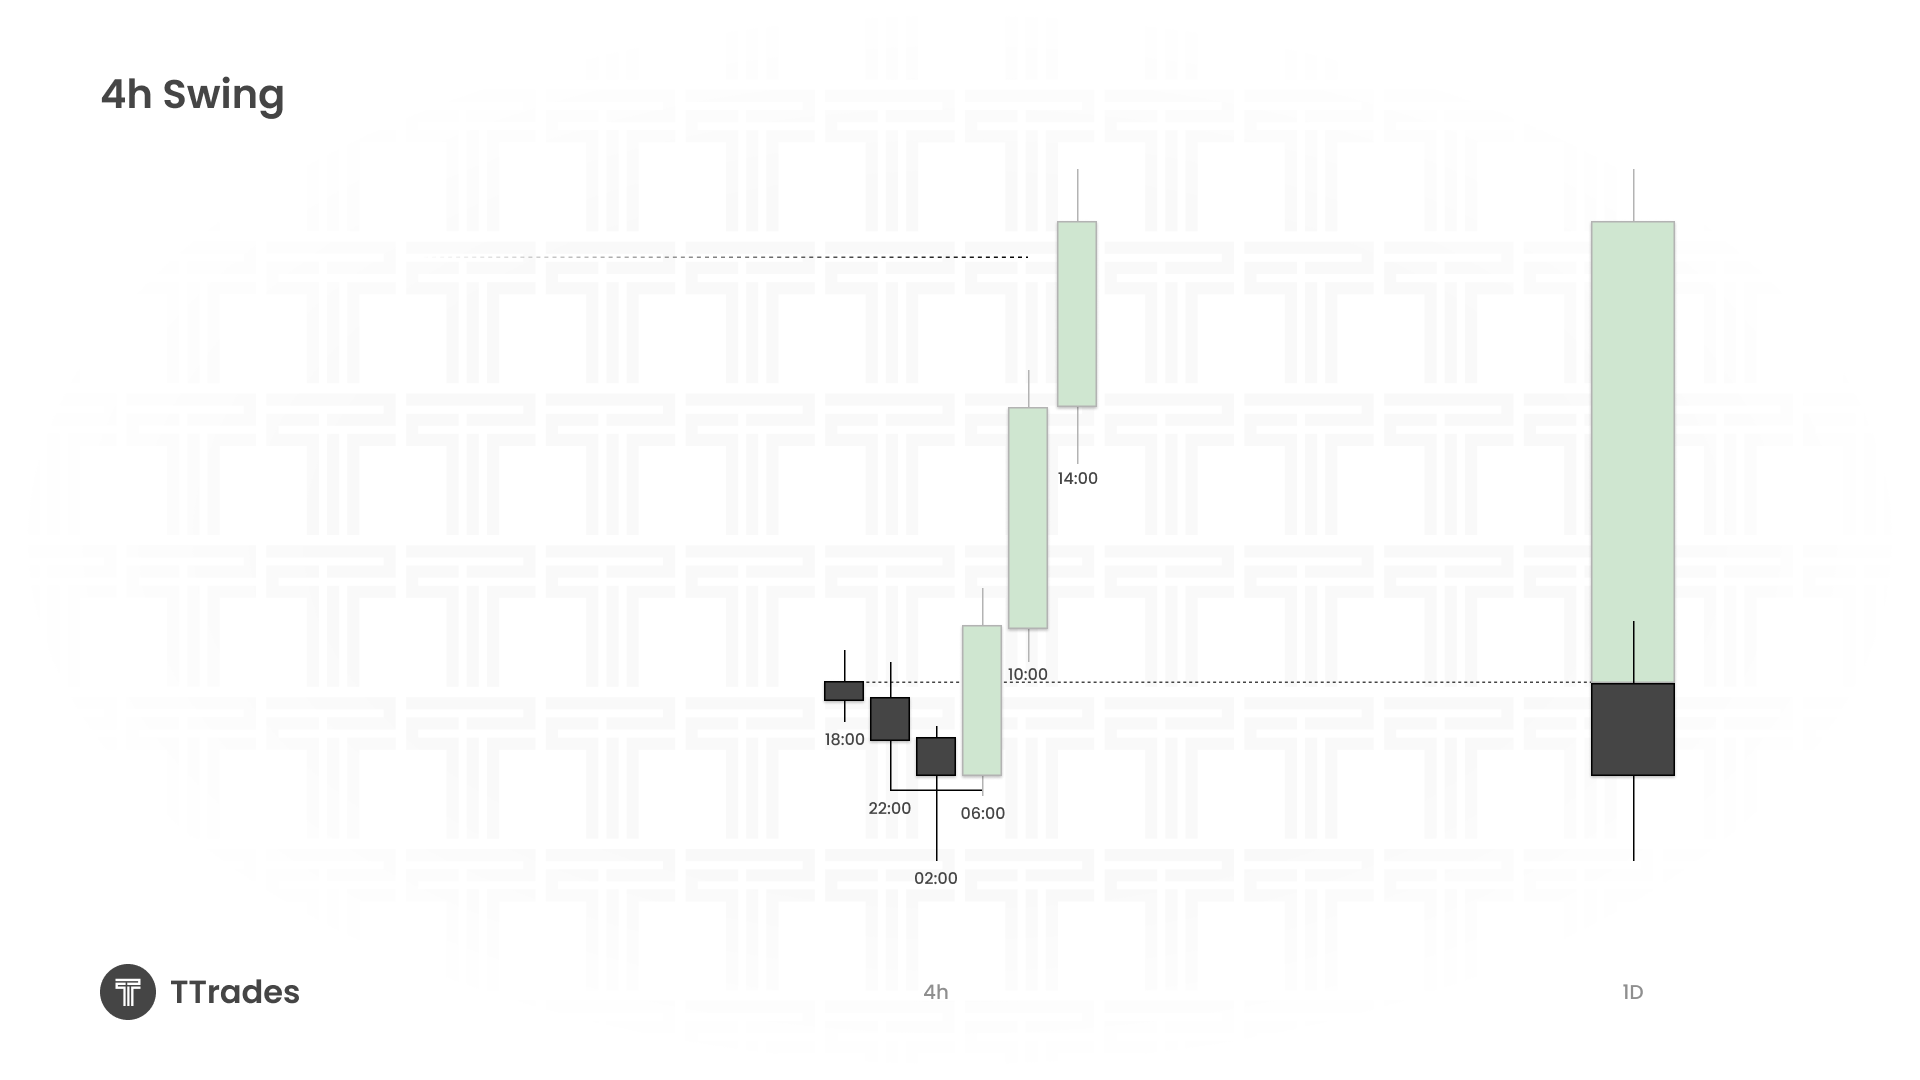
With the daily bias in place, I drop down to the 4 hour timeframe. This chart is used to define intraday swing points and to help anticipate where the daily wick finishes forming.
On the 4 hour chart, I am looking for a candle to closure that aligns with the daily bias. This closure tells me that the market is likely done forming the wick and is preparing to expand. Often this appears as an engulfing candle, a liquidity sweep followed by strong displacement, or a clear change in the state of delivery.
When this occurs early in the trading day, it gives me confidence that the next 4 hour candle, candle three, can expand toward higher timeframe liquidity.
Letting the Wick Form on Every Timeframe
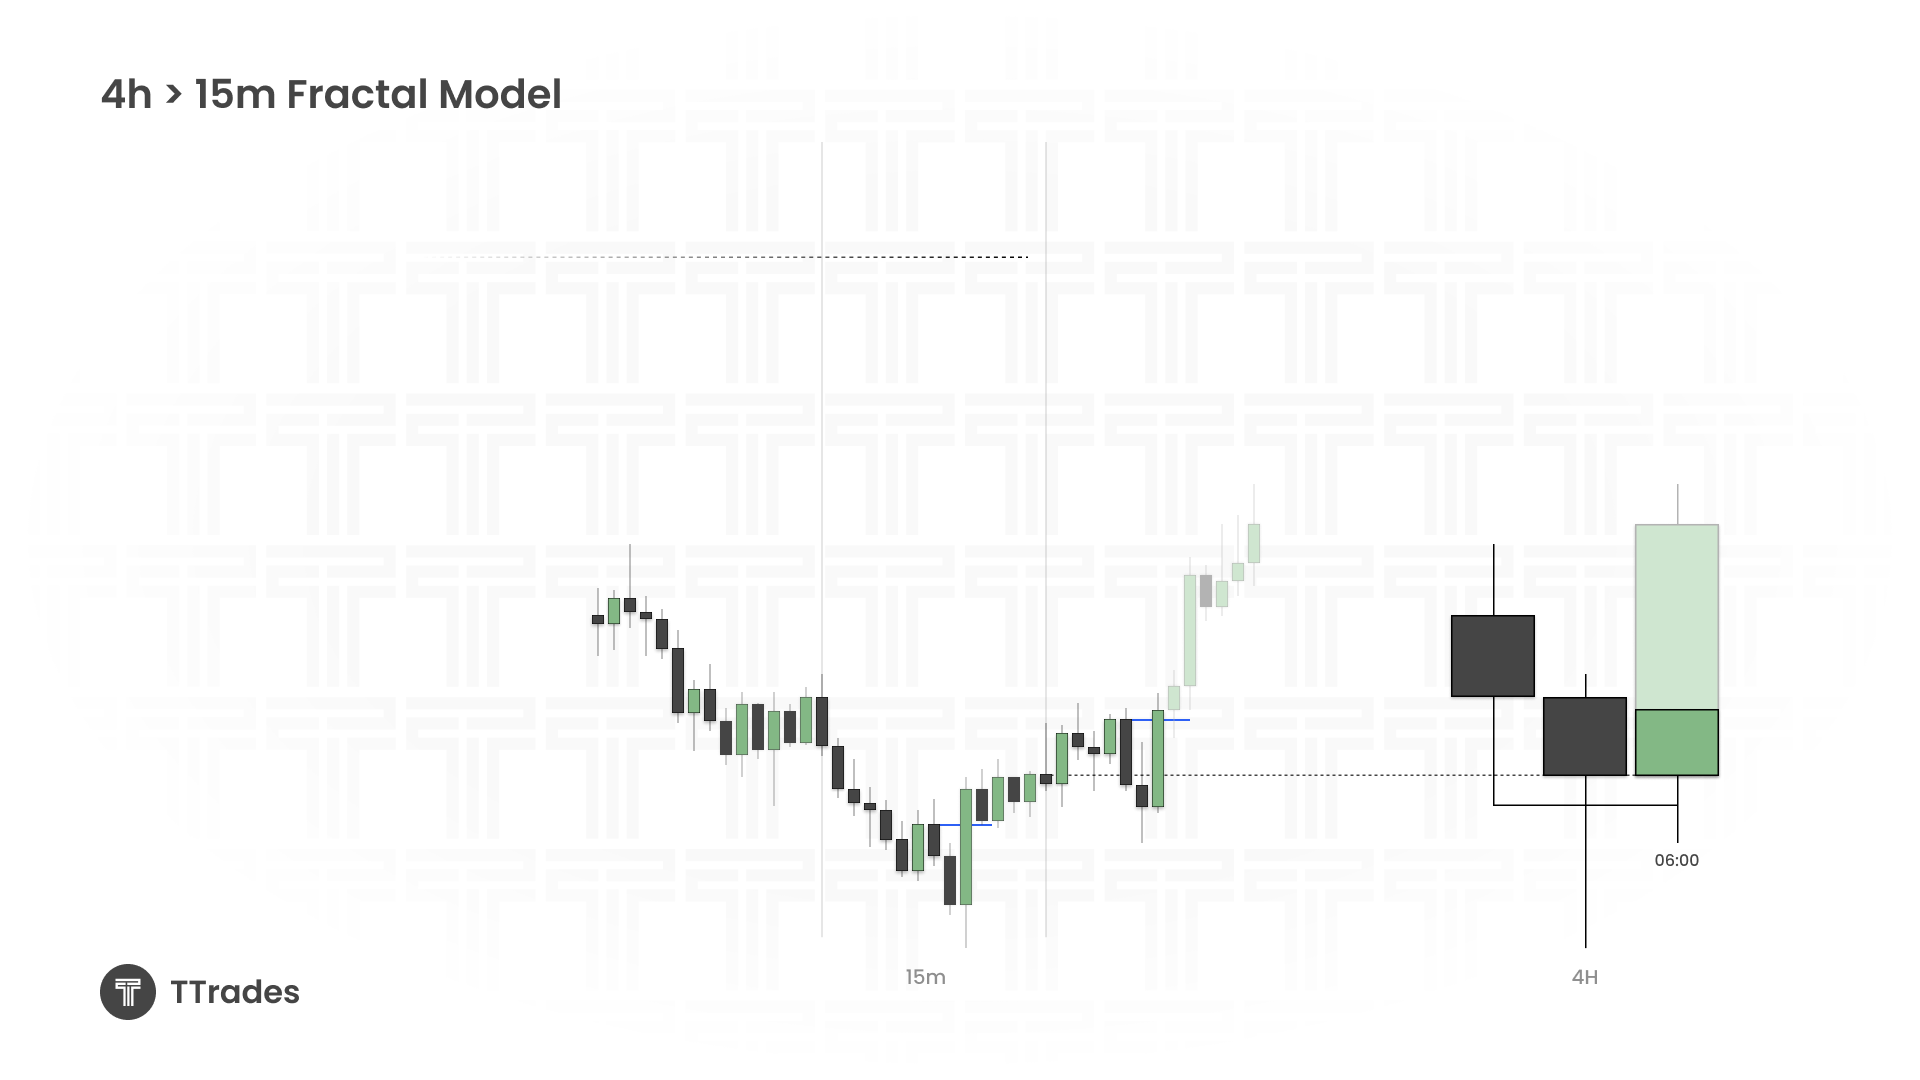
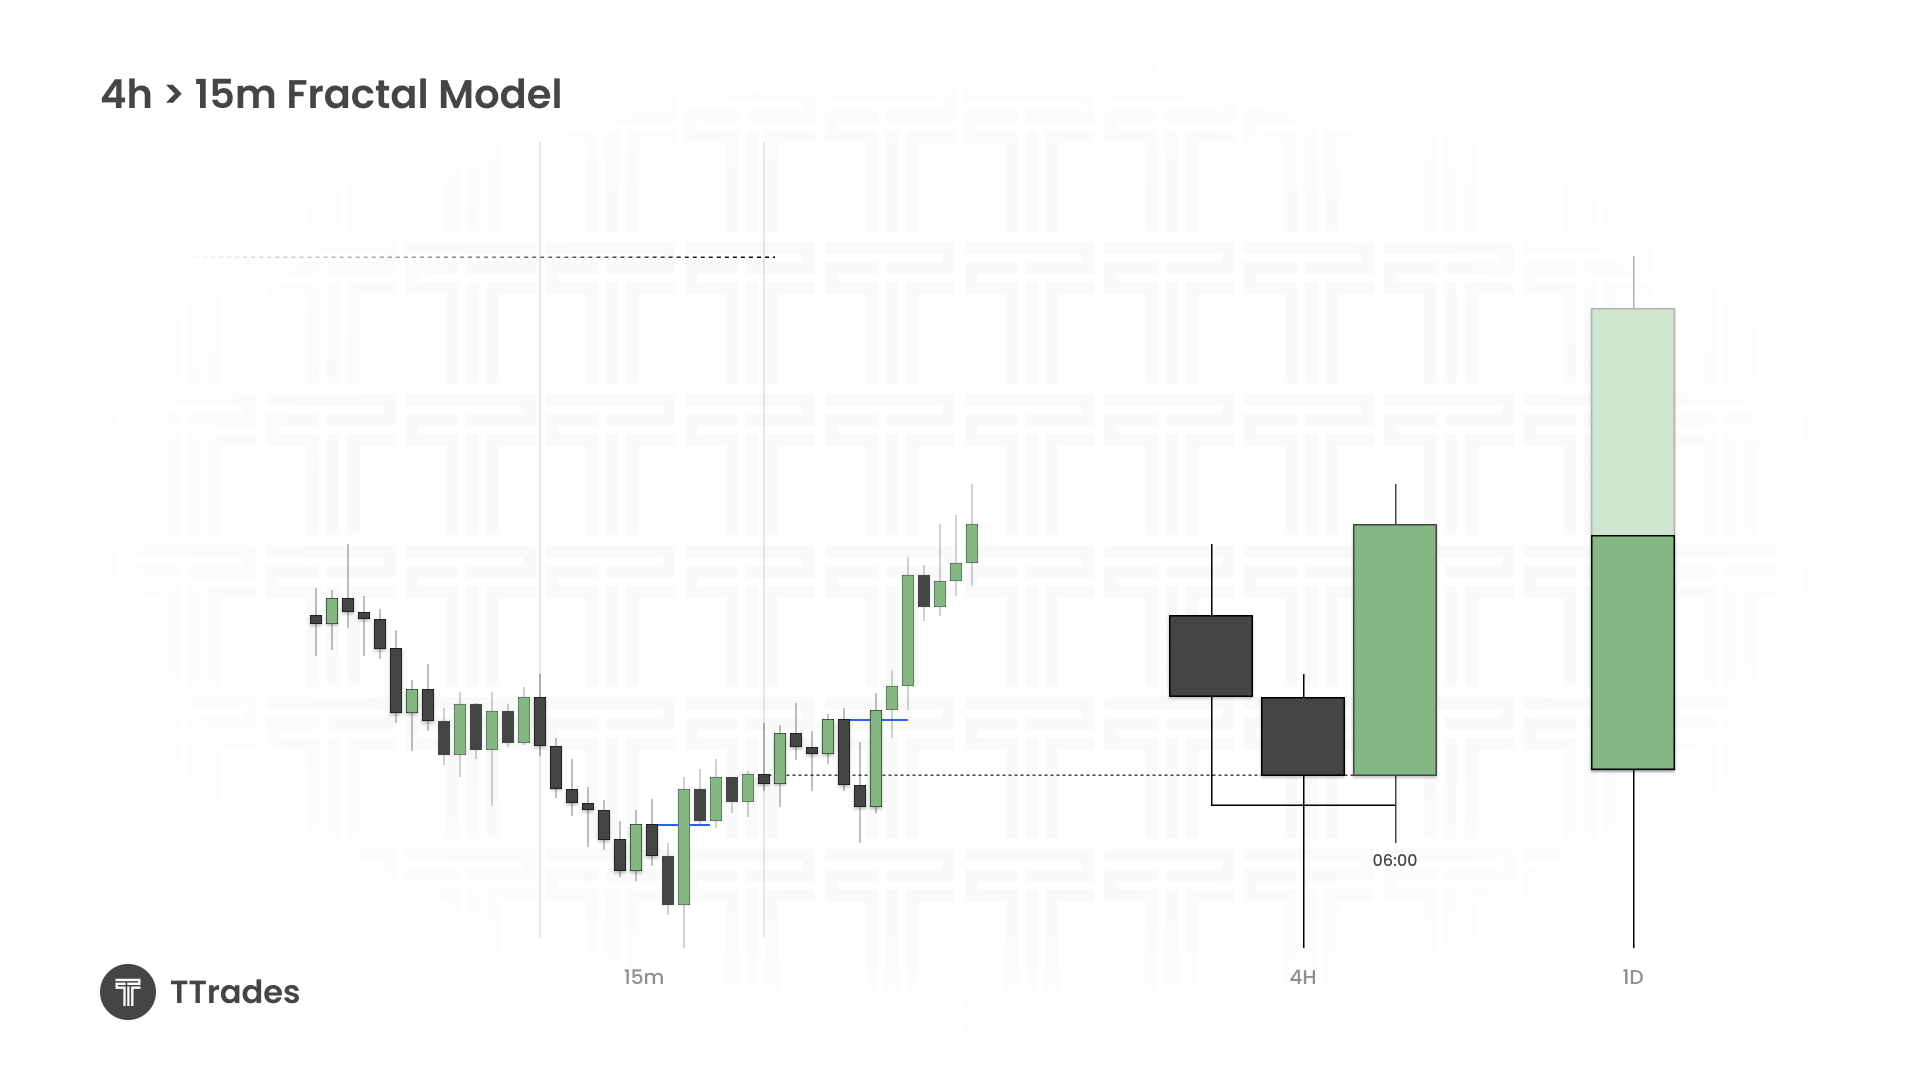
This is where the fractal nature of the model becomes clear. The same logic applies across all timeframes.
First, the daily wick forms and the body expands. Then the 4 hour wick forms and the body expands. Finally, the same process plays out on the 15 minute chart. At every stage, I am waiting for the market to show completion of the wick before looking for continuation.
Executing on the 15 Minute Timeframe
On the 15 minute timeframe, I am not trying to catch the first reversal. Instead, I am looking for confirmation through continuation.
Price needs to react from a clear point of interest, typically sweeping short term liquidity and producing a sharp recovery. Once I see a closure that confirms a change in delivery, I have a protected swing that defines my risk.
Entries are taken on the next continuation candle. The stop is placed beyond the protected swing, and targets are set either at a fixed two to one or at higher timeframe objectives such as failure swings or equal highs and lows.
Applying the Model Bearish
The exact same framework applies in bearish conditions. After extended upside expansion and liquidity runs, a daily candle to closure allows me to anticipate a bearish candle three.
From there, the 4 hour chart provides a swing point, and the 15 minute chart offers a continuation entry. Targets naturally align with prior daily lows or unfilled inefficiencies. The structure does not change, only the direction.
Advanced Alignment and Larger Risk Reward Trades
The largest risk to reward opportunities occur when the daily, 4 hour, and 15 minute timeframes are all expanding in the same direction.
In these situations, a small 15 minute invalidation can be used to target much higher timeframe liquidity. This is how extended trades develop, even if partial profits are still taken at two to one.
Why This Model Works
This model works because it removes the need to predict. Instead of fighting the market, you are trading with expansion and momentum.
By aligning multiple timeframes and waiting for confirmation, trend becomes the path of least resistance. Entries become cleaner, invalidations become clearer, and trades feel more structured rather than forced.
Final Thoughts
The easiest expansions occur when candle three is traded across multiple timeframes. Start with the daily for bias, use the 4 hour to define the swing, and execute with precision on the 15 minute chart.
This approach replaces guesswork with structure. When everything aligns, the trade often feels obvious, and that is exactly how it should feel.