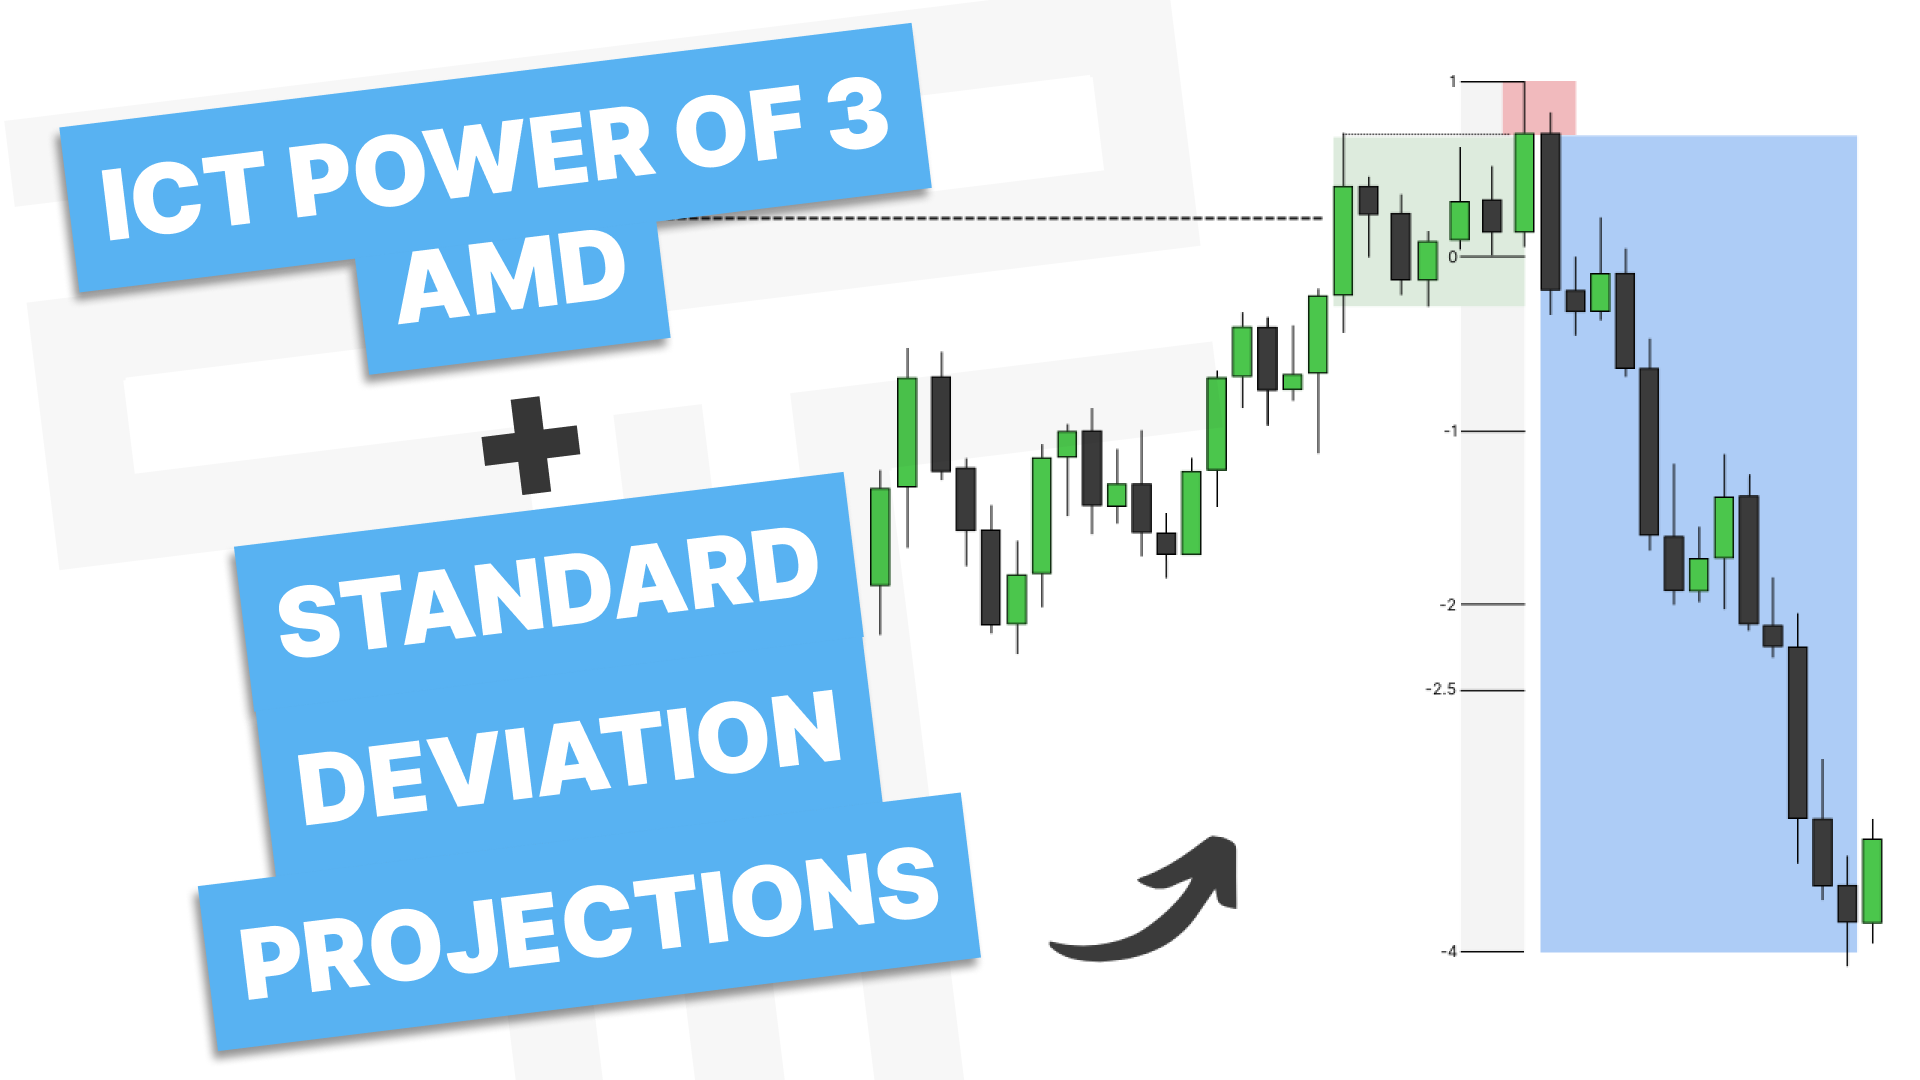
Introduction
In this lesson, we’re going to break down how to combine standard deviation projections with Accumulation, Manipulation, and Distribution (AMD). This approach adds objective targets to an already powerful framework, helping you anticipate where price is likely to deliver after manipulation occurs. By the end, you’ll understand how to identify the manipulation leg, project it forward, and align entries using structure, order blocks, and fair value gaps.
A Brief Review of Accumulation, Manipulation, and Distribution
Before diving into projections, let’s quickly ground the concept.
AMD is a three-phase price behavior:
Accumulation: consolidation or range-bound price action.
Manipulation: a false move or fake breakout designed to trap participants.
Distribution: the real directional move, opposite the manipulation.
On a candlestick chart, this typically appears as price consolidating, making an aggressive move outside the range, then sharply reversing and delivering in the opposite direction.
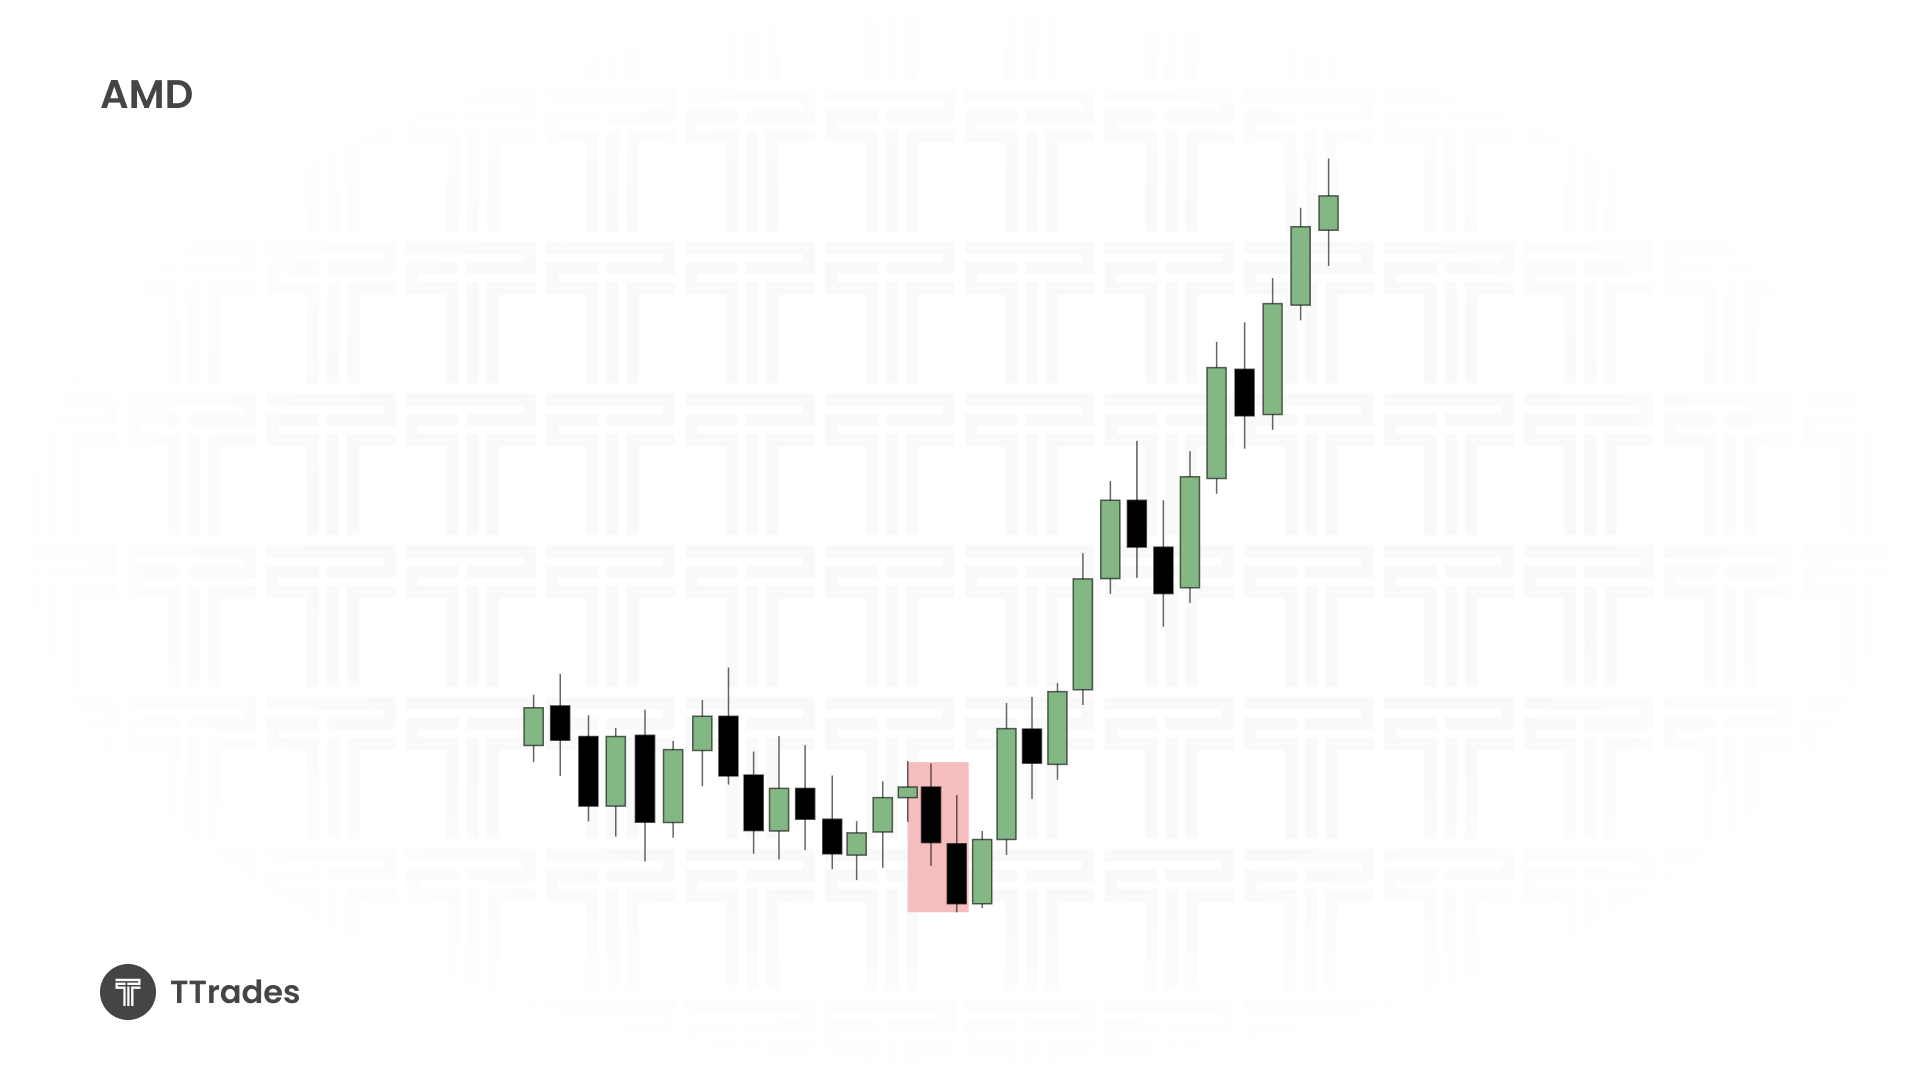
Identifying the Manipulation Leg
When applying standard deviation projections, the most important piece is the manipulation leg itself.
Instead of projecting random swings, we focus on:
The leg that created the high before the real sell-off
The leg that created the low before the real buy-side expansion
This often aligns with:
A breaker formation
A change in state of delivery
A market structure shift
Once identified, we measure from the high to the low, or low to high, of that manipulation leg and project it forward.
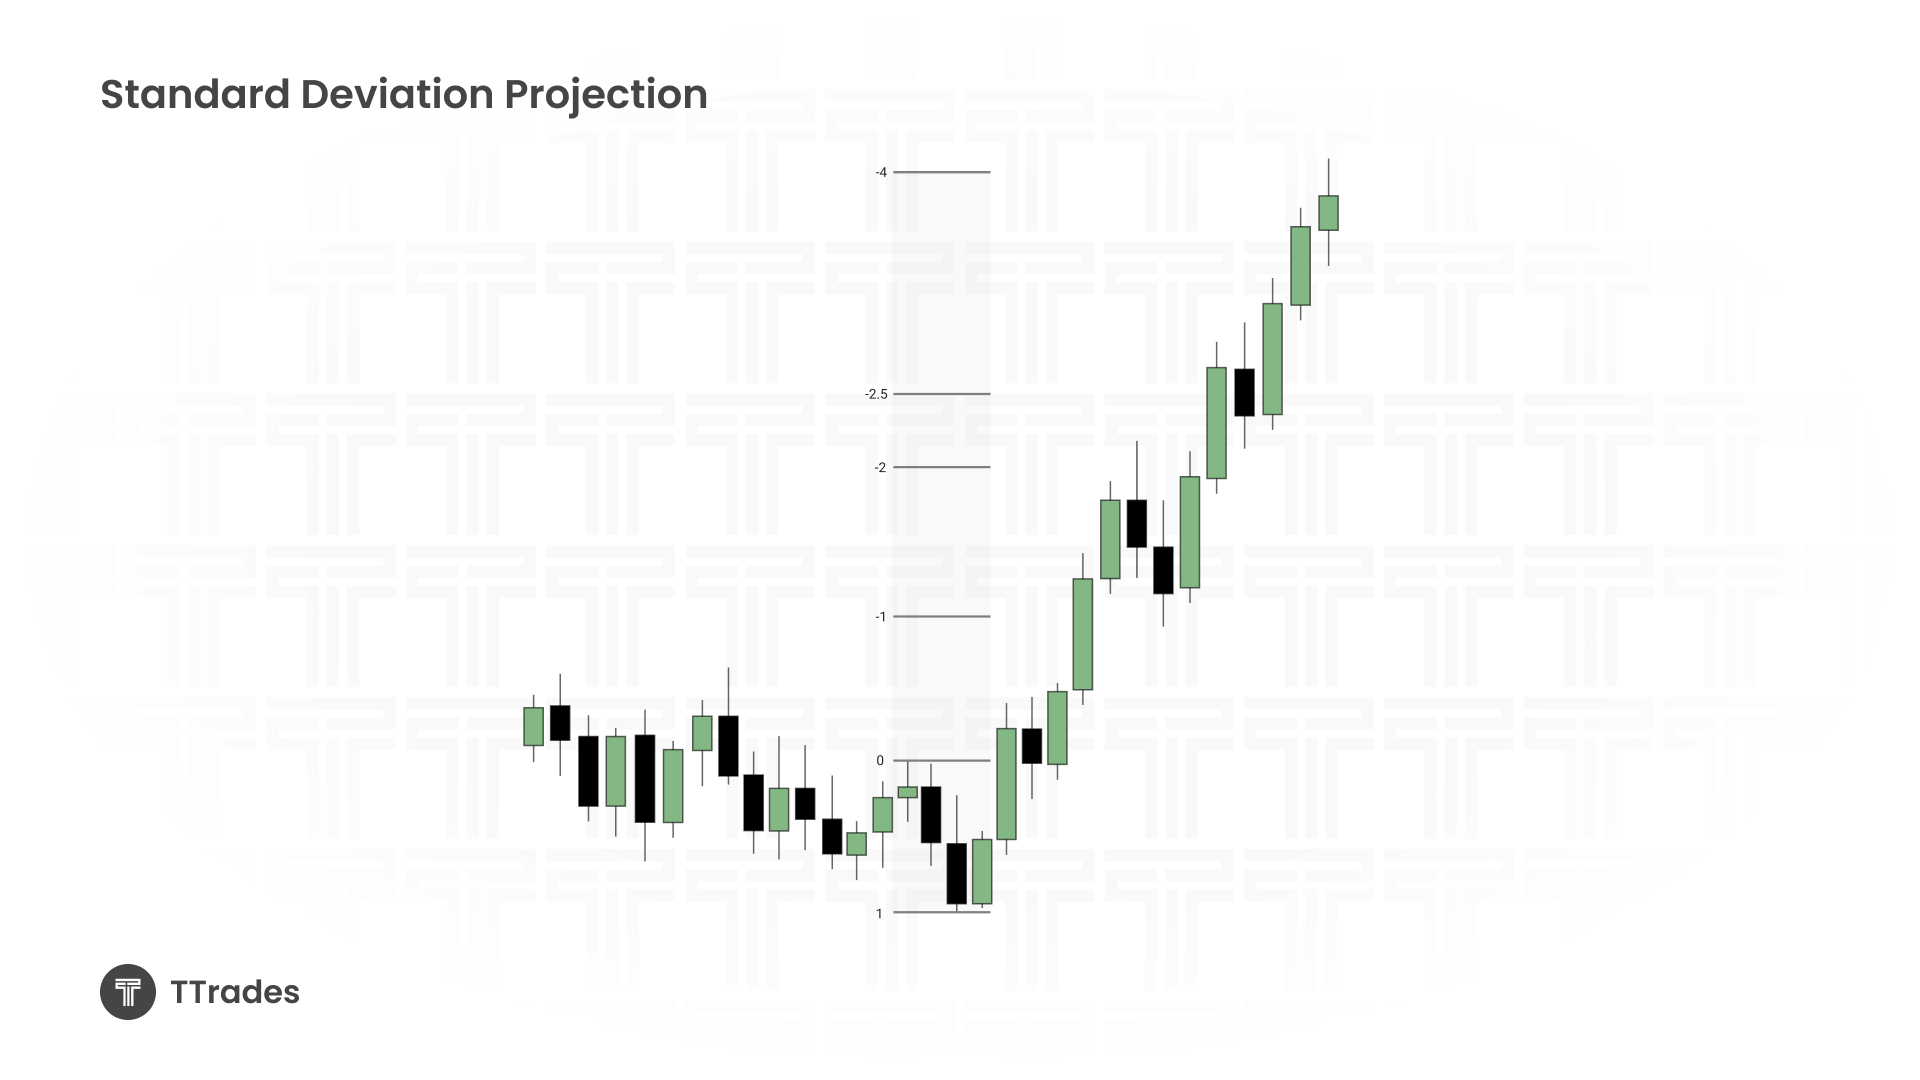
Standard Deviation Targets That Matter
When projecting the manipulation leg, there are two areas I prioritize.
The -2 to -2.5 standard deviation
This is the first high-probability reaction zone and often acts as a partial or full target.The -4 standard deviation
This is the max expansion target when momentum and structure support continuation.
These levels give us objective delivery zones instead of guessing how far price might go.
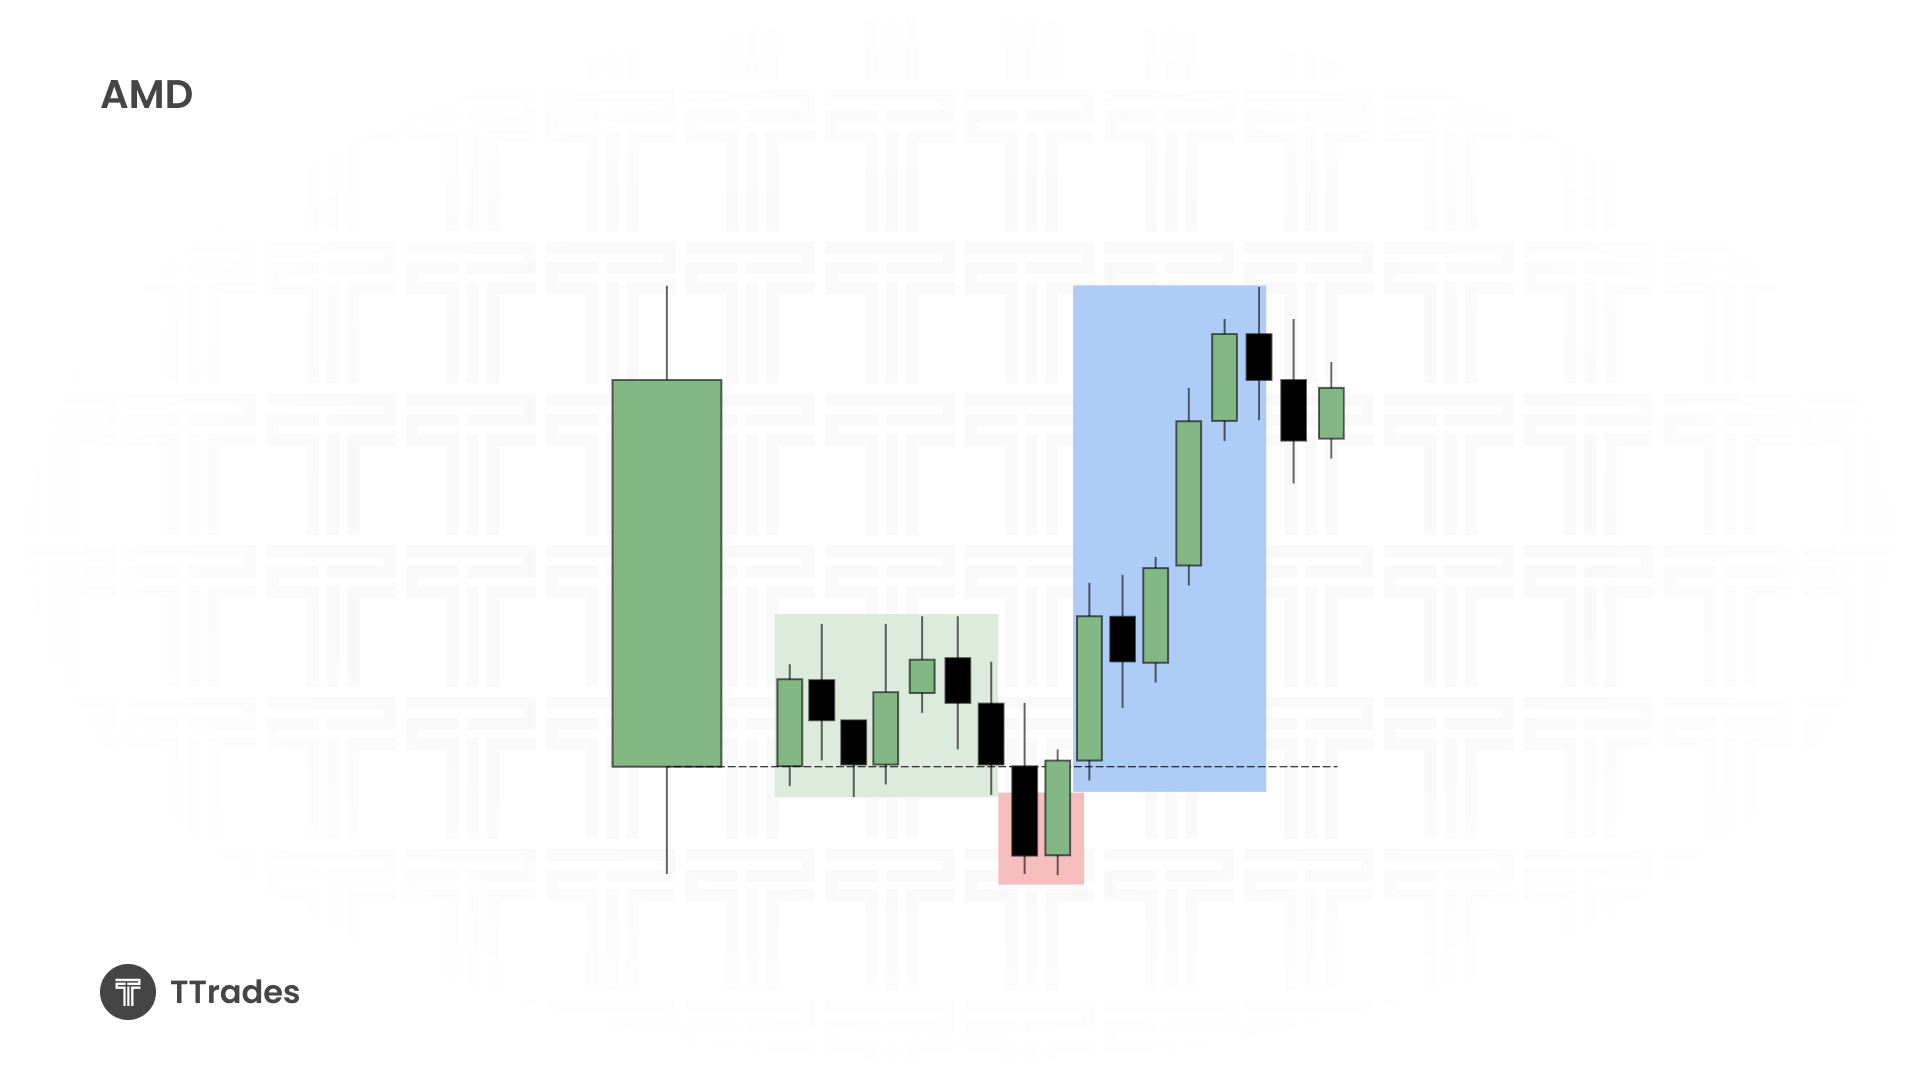
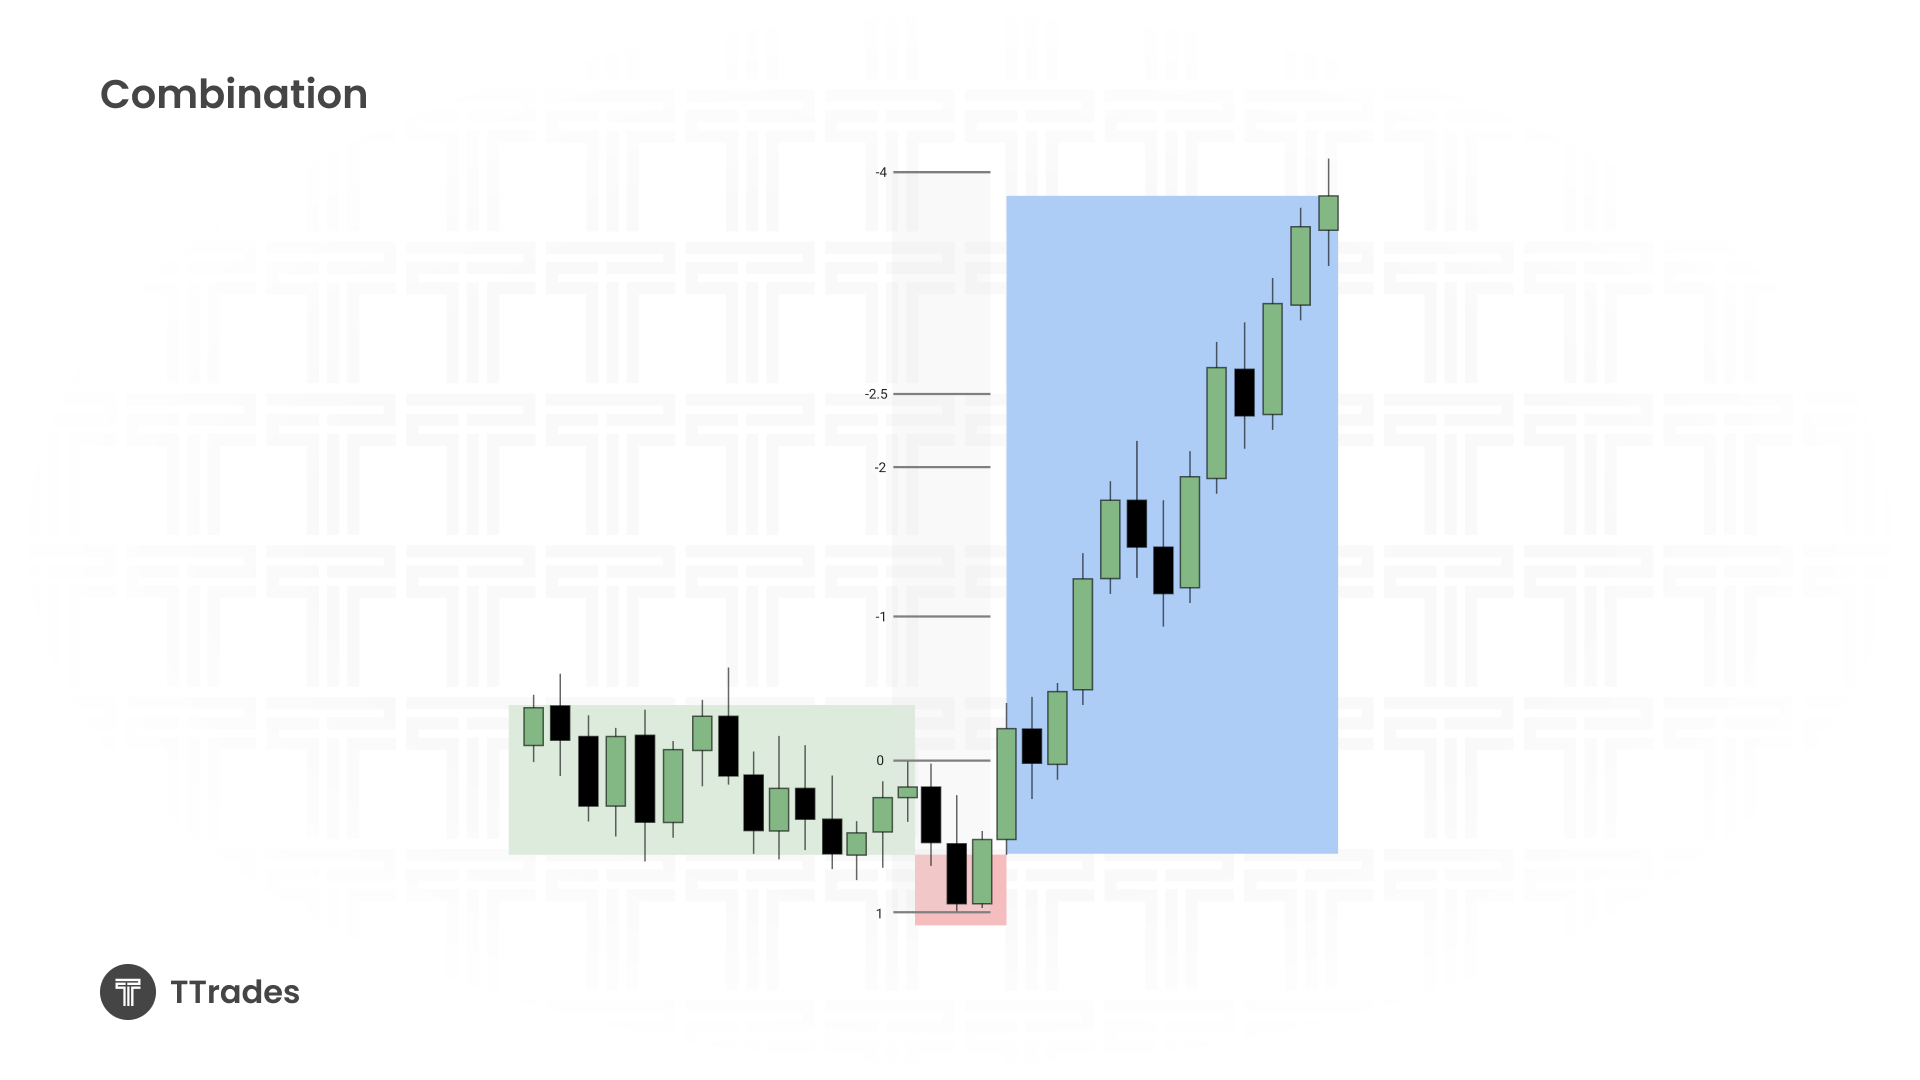
Combining AMD and Projections
In the next example, we integrate AMD with projections
Here’s how it works:
Identify consolidation using candle bodies
Anything beyond the box becomes potential manipulation
Expect distribution back through or beyond the range
Once manipulation is identified:
Measure the manipulation leg from the high to the low that made the high
Use the CISD as your entry reference
Target the proejctions
Focus on a “V-Shaped” reversal at the manipulation point.
AMD Across Trading Sessions
In the final example, we apply AMD between sessions.
A common session-based narrative:
Asia accumulates
London manipulates
New York distributes
Asia forms a clean consolidation range. As London opens, price aggressively sweeps the Asia high or low, then displaces back inside. This confirms London manipulation.
From there:
Identify the Manipulation
Project from that low to the high that made it or from the high to the low that made it
The -2 to -2.5 standard deviation aligns with a failure swing and prior highs
As New York approaches:
Price retraces into a point of interest including a Fair Value Gap or sweeping out liquidity
Entry can be taken with stops below the London low or new protected low
Target is the projections
Price delivers as expected, completing the AMD cycle across sessions.
Final Thoughts
By combining standard deviation projections with AMD, you gain clear manipulation identification, objective delivery targets, and better trade management. This framework removes much of the ambiguity and helps you stay aligned with how price typically delivers after manipulation.