Introduction
In this guide, we’re breaking down standard deviation projections and how to use them as precise targets for retracements, reversals, and confluence within existing models. The focus is on practical application: how to set up the tool, where to anchor it, what to expect at key deviation levels, and how to pair projections with PD arrays across multiple timeframes.
What Standard Deviation Projections Are Used For
Standard deviation projections help define where price can reach relative to a manipulation leg. These areas can be used to identify likely retracement zones, anticipate reversal points, add confluence to an existing strategy, and define max expansion targets.
They are especially effective when combined with the TTrades Fractal Model.
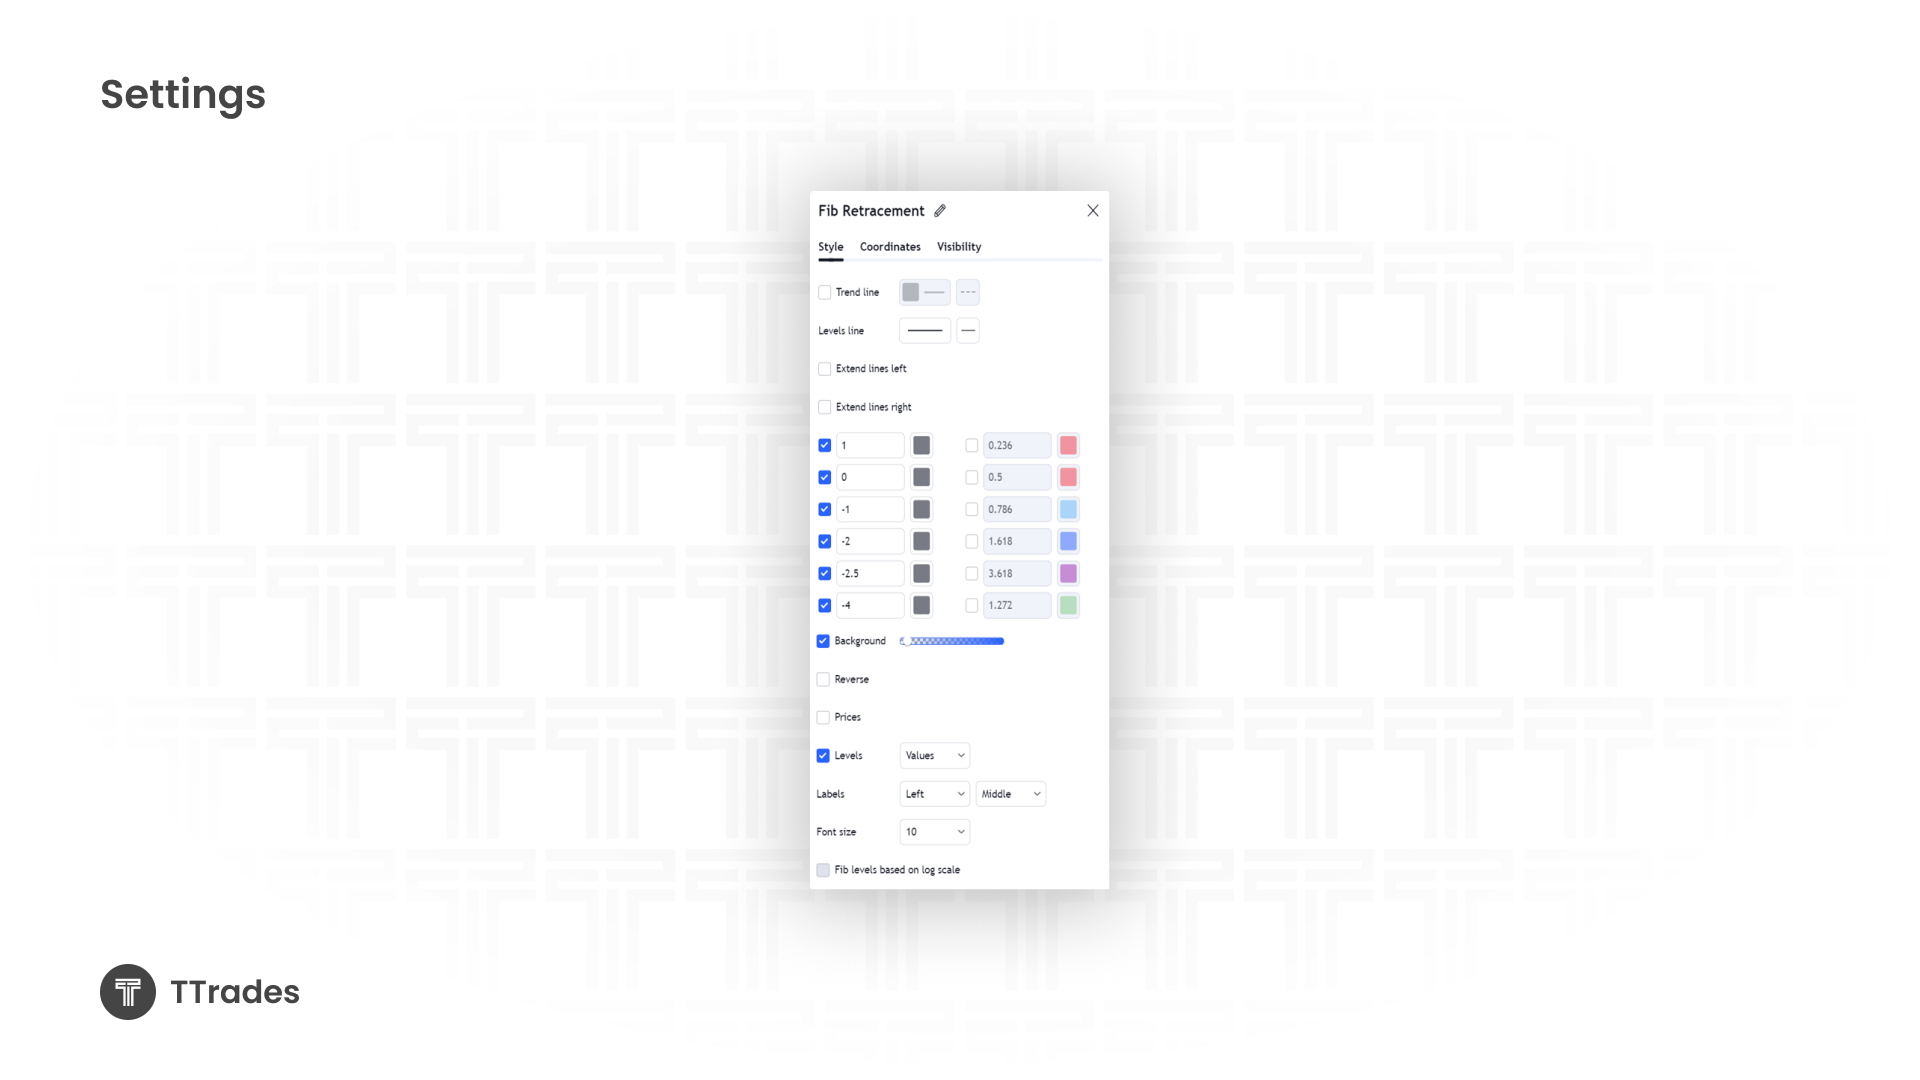
Fibonacci Settings for Standard Deviation Projections
To build these projections, we use the Fibonacci retracement tool on TradingView with custom levels.
The key levels used are:
1
0
-1
-2
-2.5
-4
Visual settings include values displayed on the left side, a font size of 10, a clean semi-transparent background, and consistent colors for easy recognition. The most important levels to focus on are the -2 to -2.5 and the -4 standard deviations.
How to Anchor the Tool Correctly
The most important step is anchoring the projection to the correct price leg. You are not projecting random swings. You are projecting the manipulation leg.
A manipulation leg is the swing that sweeps liquidity and occurs just before a change in the state of delivery. It is the final high before a bearish CISD or the final low before a bullish CISD.
Once identified, bearish setups are projected from high to low, while bullish setups are projected from low to high.
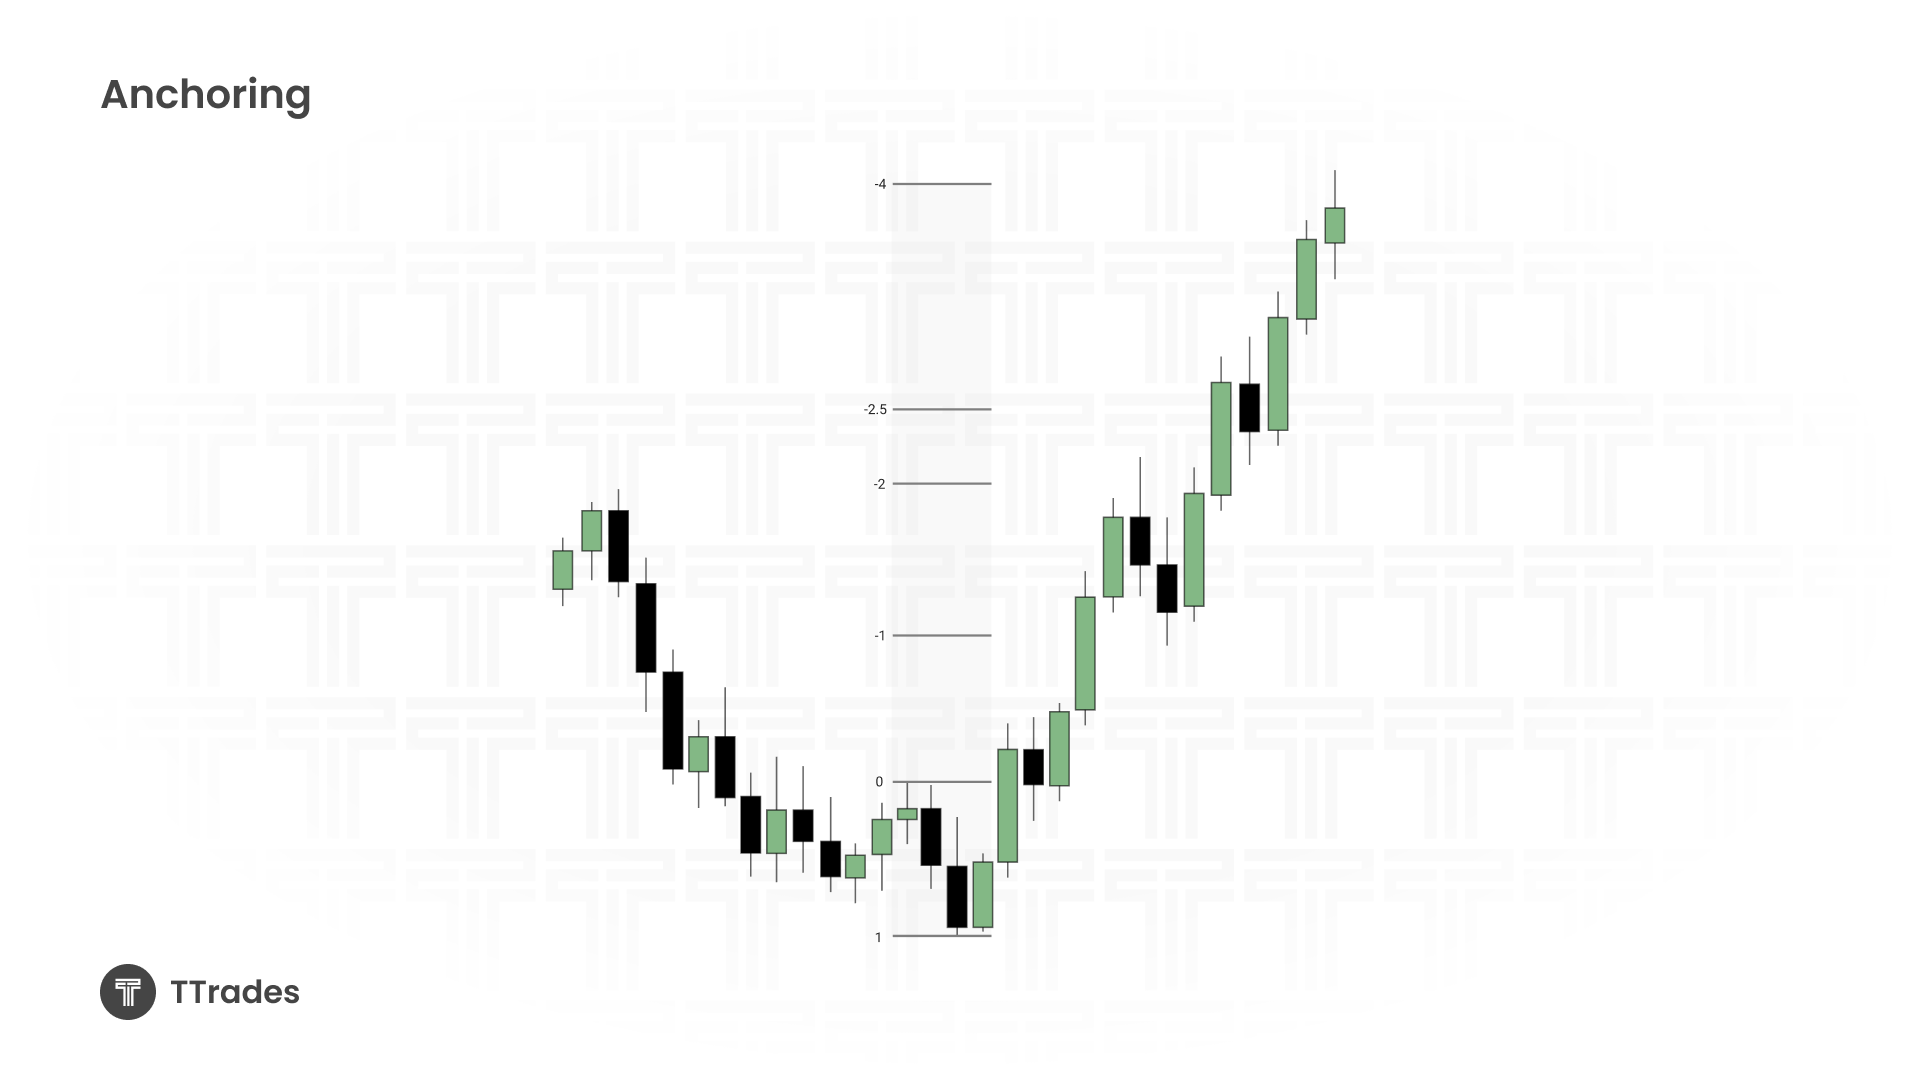
Identifying the Manipulation Leg
A common structure includes price trending in one direction, sweeping liquidity, and then aggressively displacing in the opposite direction.
To identify the manipulation leg, ask which leg made the new high before the sell-off or which leg made the new low before the rally. That swing is the leg used for projection..
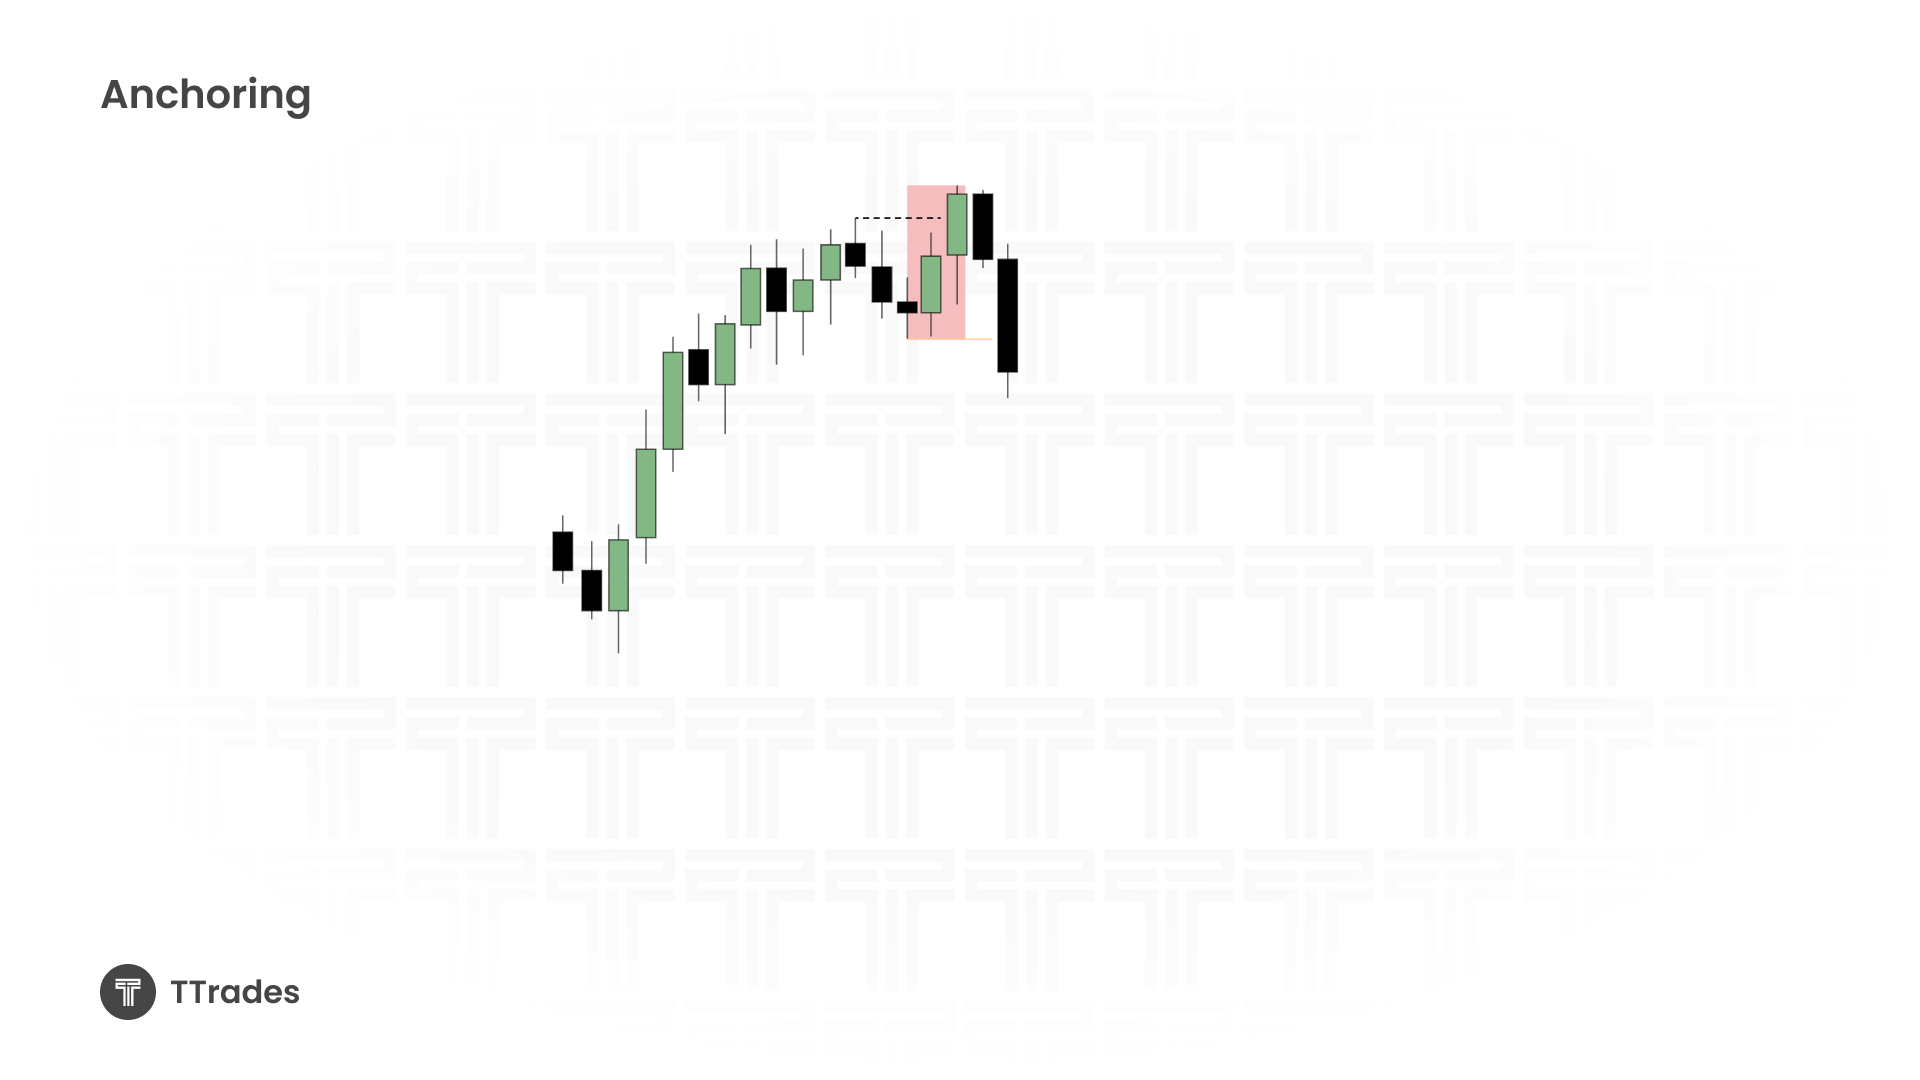
Interpreting the Key Standard Deviation Levels
Each deviation level carries a specific expectation.
The -2 to -2.5 standard deviation is the primary area of interest where price often reacts with a retracement or reversal and is commonly considered low-hanging fruit.
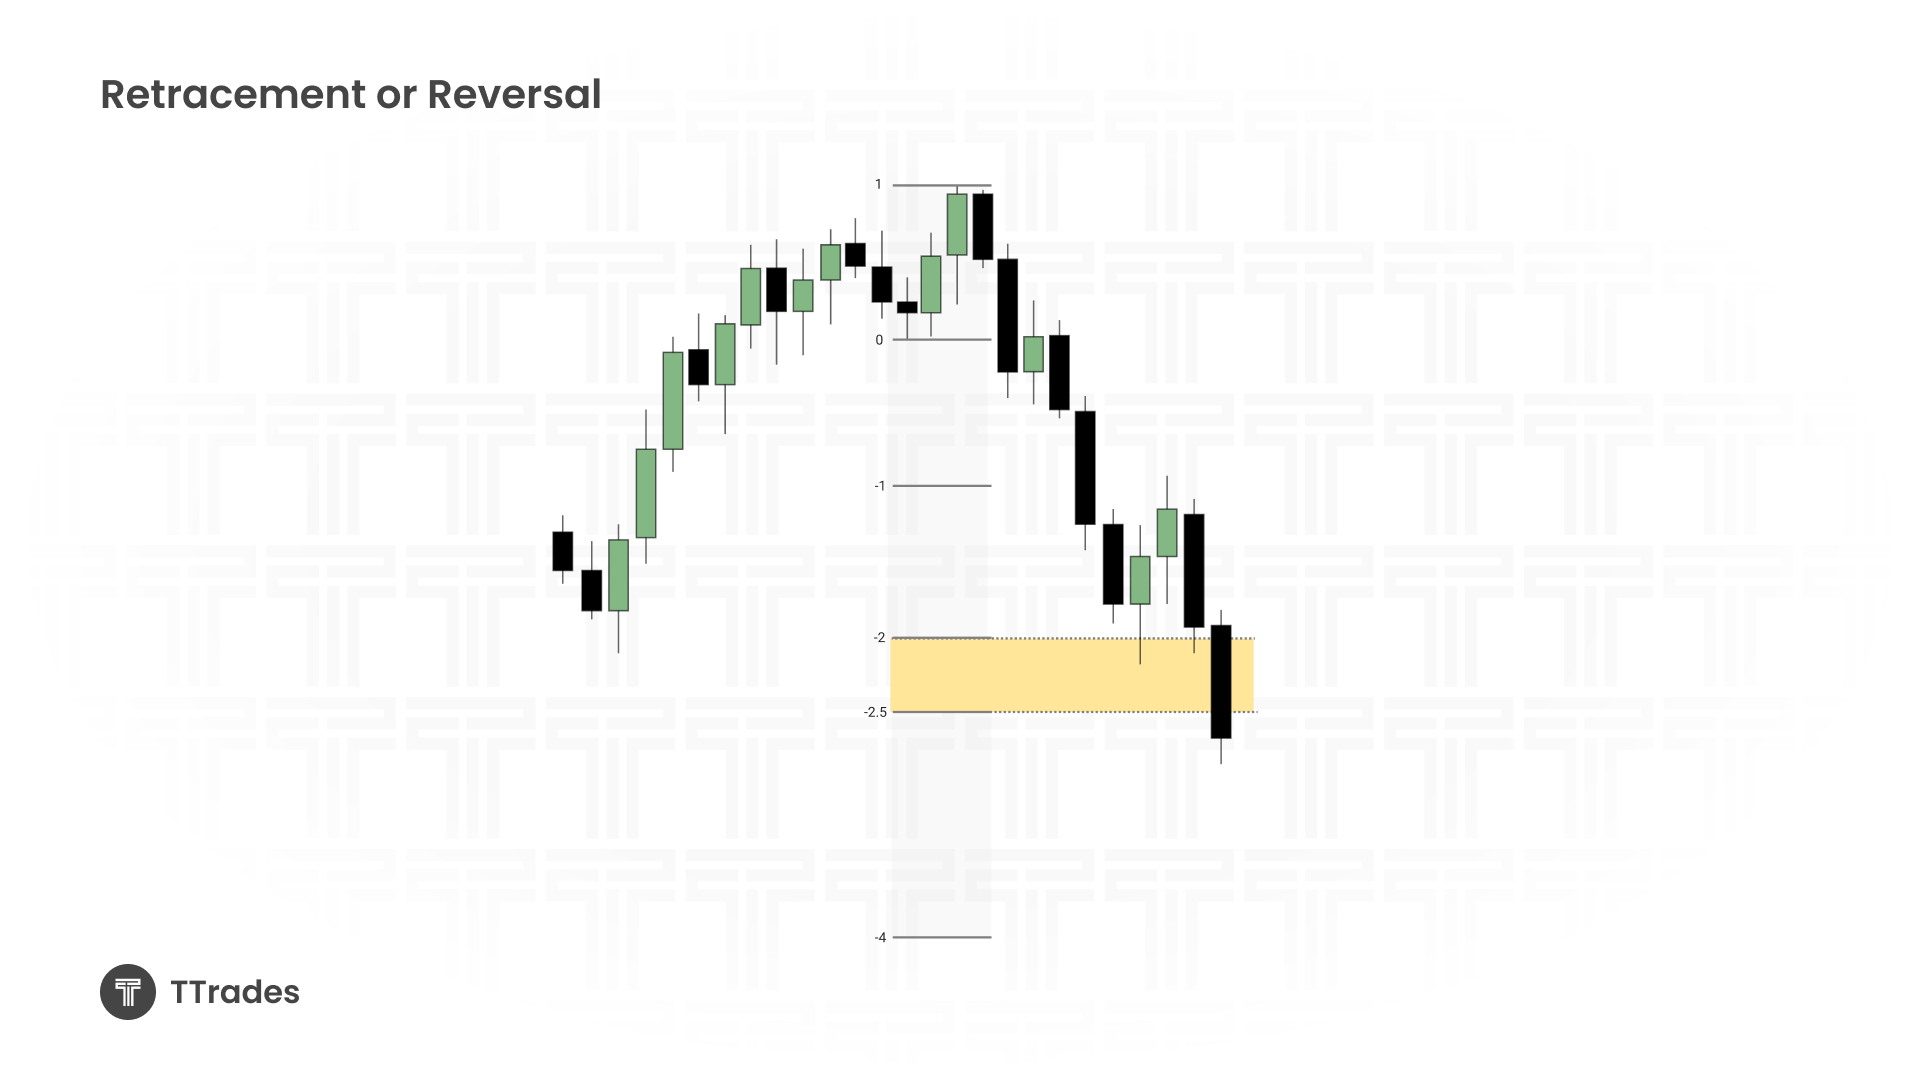
If price displaces and closes beyond the -2 or -2.5 level, continuation becomes more likely and increases the probability of reaching max expansion.
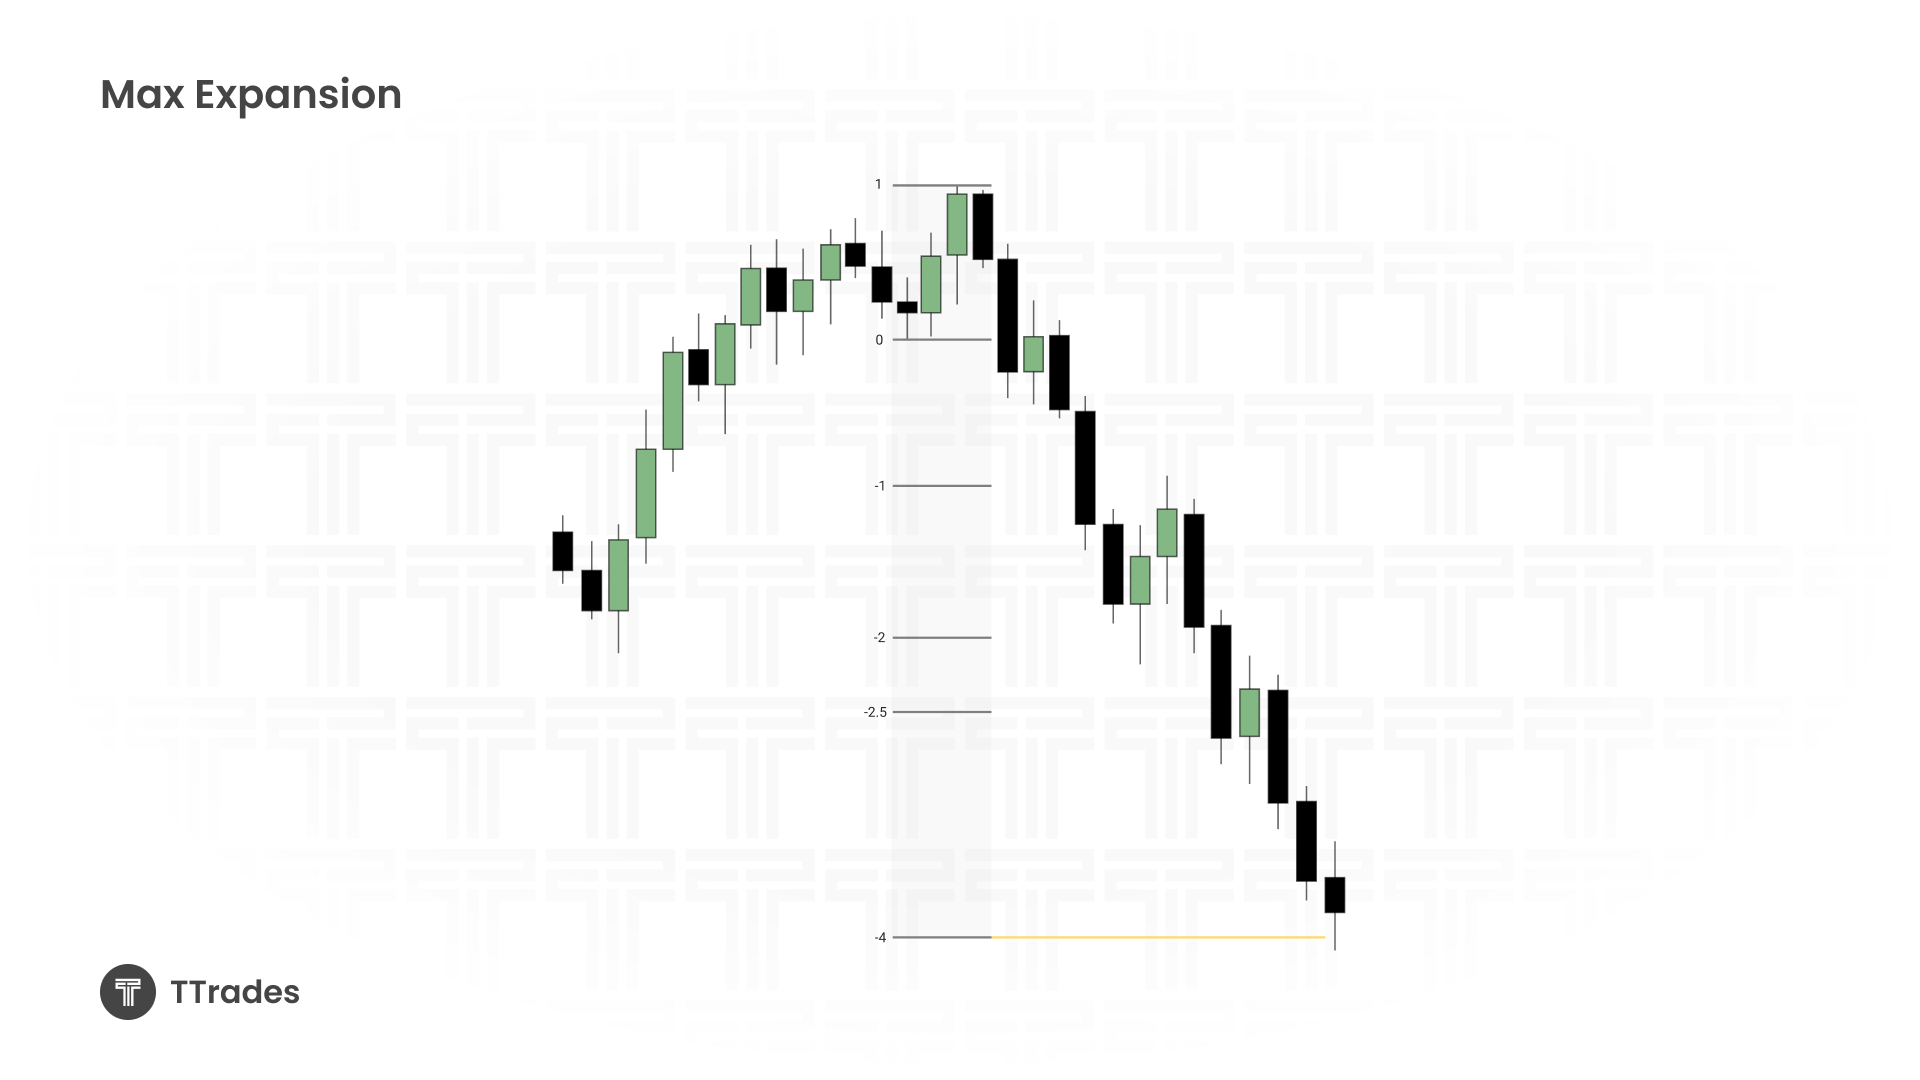
The -4 standard deviation represents max expansion. Strong reactions are common here, and it is an ideal area to look for discount or premium equilibrium retracements.
Pairing Standard Deviations With PD Arrays
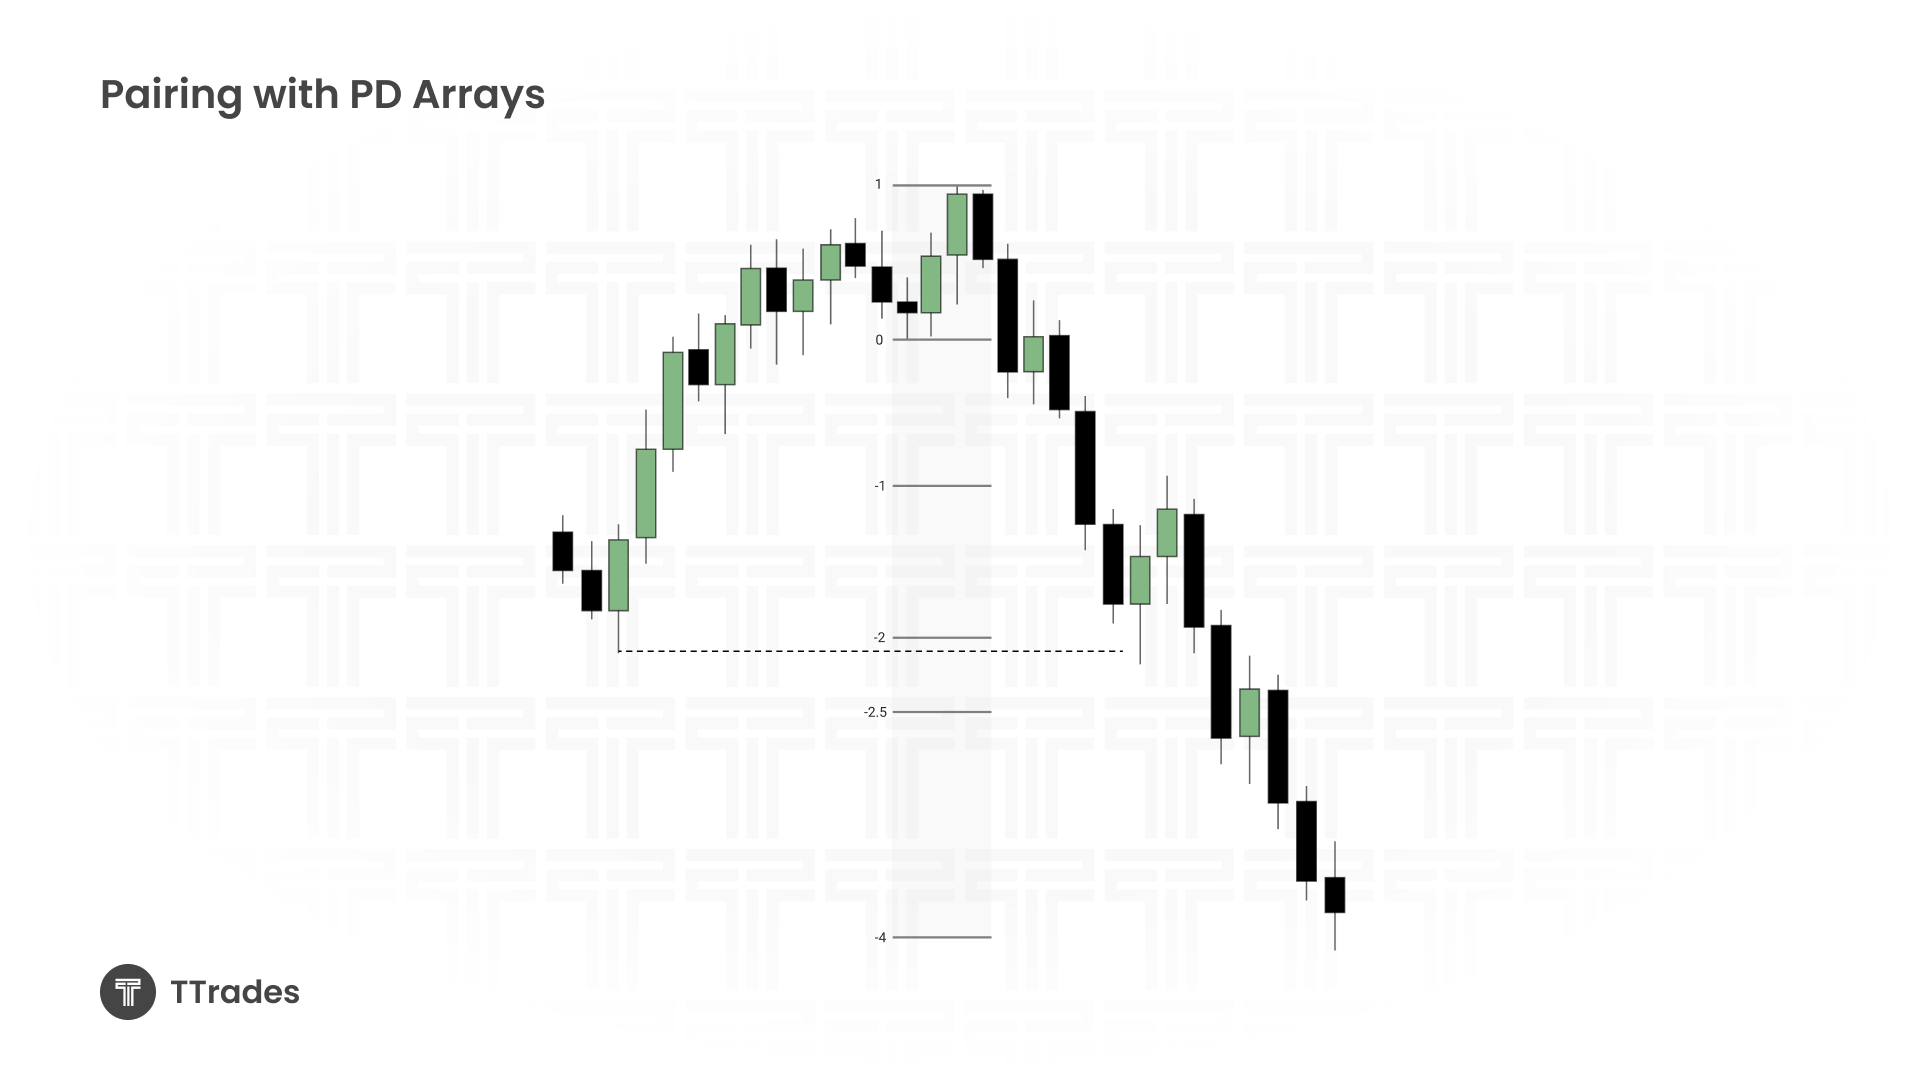
Standard deviation levels gain more significance when they align with PD arrays.
Common forms of confluence include equal highs or lows, fair value gaps, or failure swings. For example, a standard deviation level lining up with a fair value gap or resting just beneath equal highs provides context and confirmation rather than a standalone signal.
Using Multiple Projections for Added Confluence
Multiple manipulation legs often exist within a single trend. Projecting more than one leg allows deviation levels to overlap.
When the -4 standard deviation of one projection aligns with the -2 to -2.5 standard deviation of another, that area becomes a high-probability reaction zone and an important level to monitor.
Applying Standard Deviations Across Timeframes
Standard deviation projections work best in a top-down framework.
Higher timeframes define narrative and key PD arrays, mid timeframes identify manipulation and project targets, and lower timeframes refine execution and risk. This alignment allows for objective targets and precise entries.
Final Thoughts
Standard deviation projections are not a standalone strategy. They are a targeting and confluence tool designed to complement existing strategies such as the TTrades Fractal Model.
Used correctly, they help clarify expectations, improve patience, reduce emotional decision-making, and strengthen top-down analysis. When combined with accumulation, manipulation, and distribution, they become a powerful addition to any trading model.