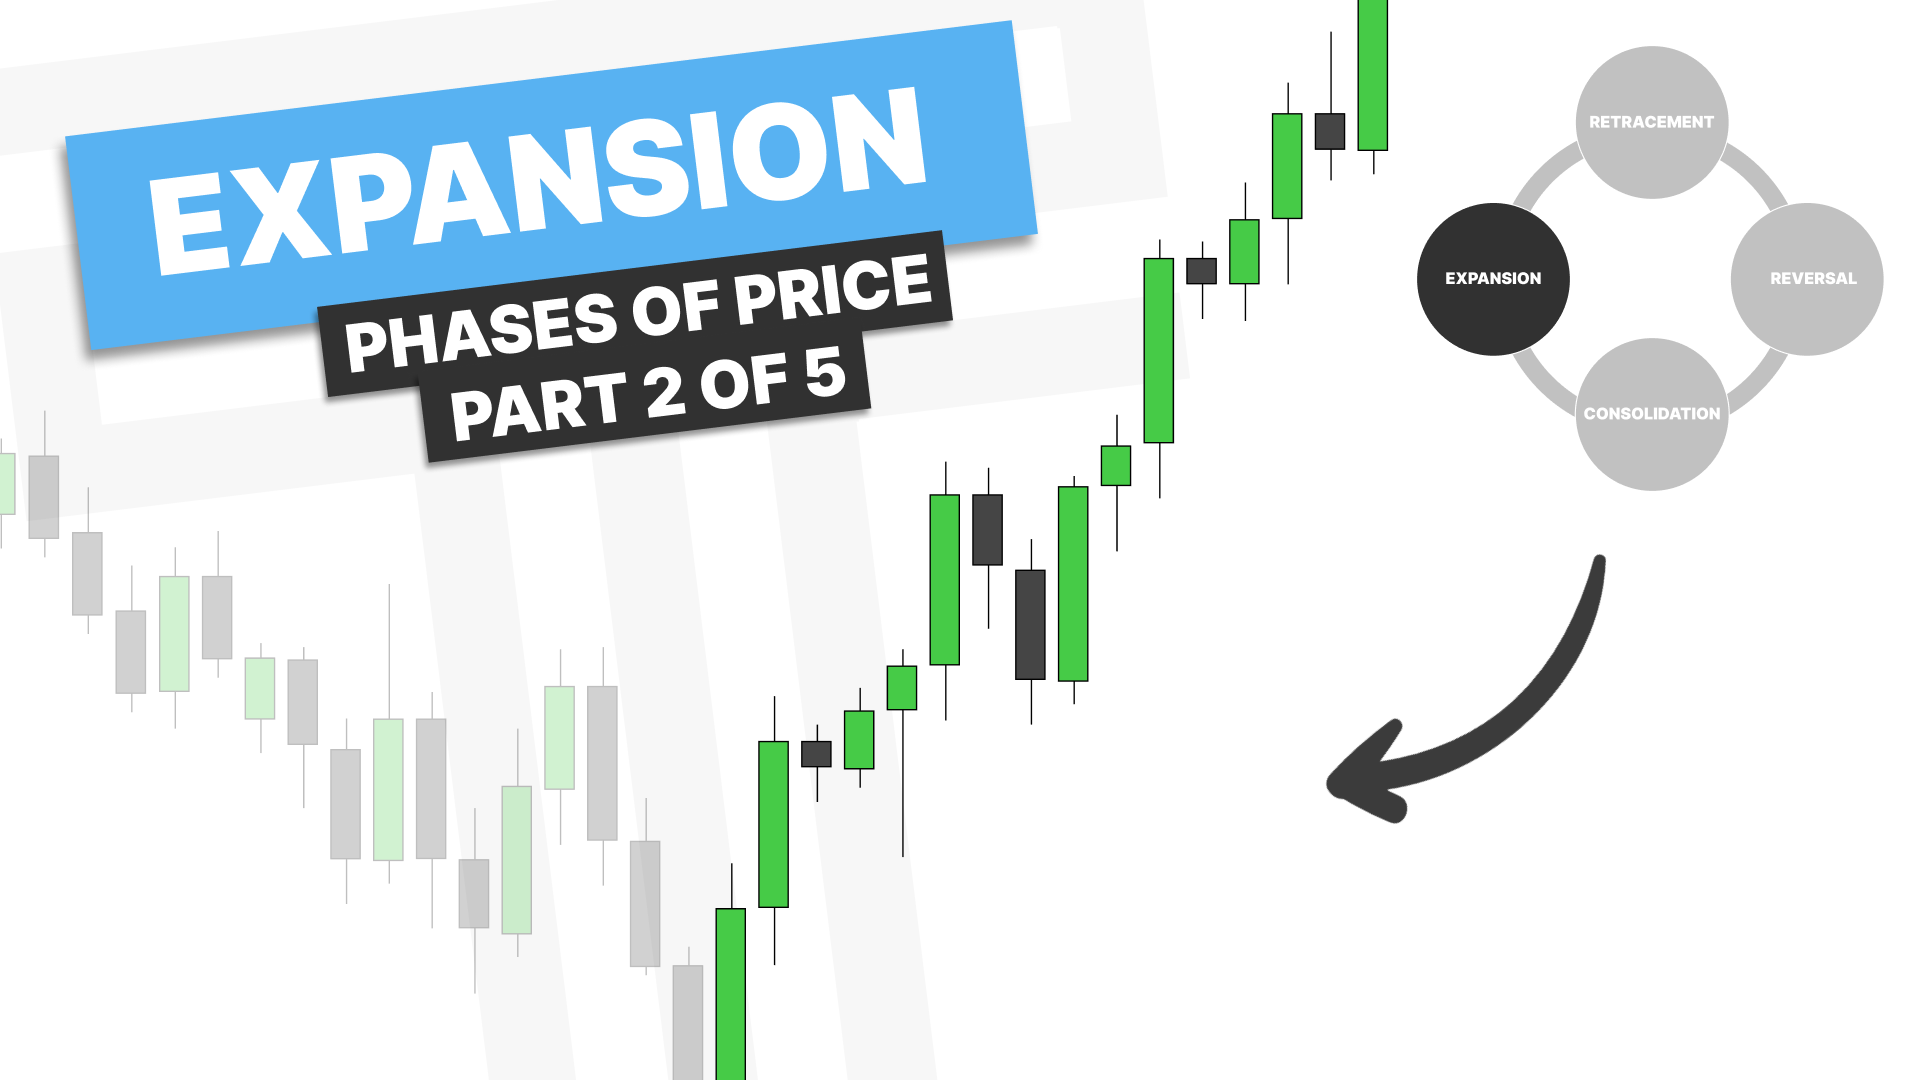
Introduction
Welcome to Part Two of the Phases of Price series.
If you haven’t yet reviewed Part One: Consolidation, I recommend starting there, because expansion often begins right where consolidation ends.
In this lesson, we’ll cover:
- What expansion is and how to recognize it.
- Where expansion tends to occur in price.
- How to trade expansion phases effectively.
- Common patterns and pitfalls to watch for.
- Real chart examples on both daily and intraday time frames.
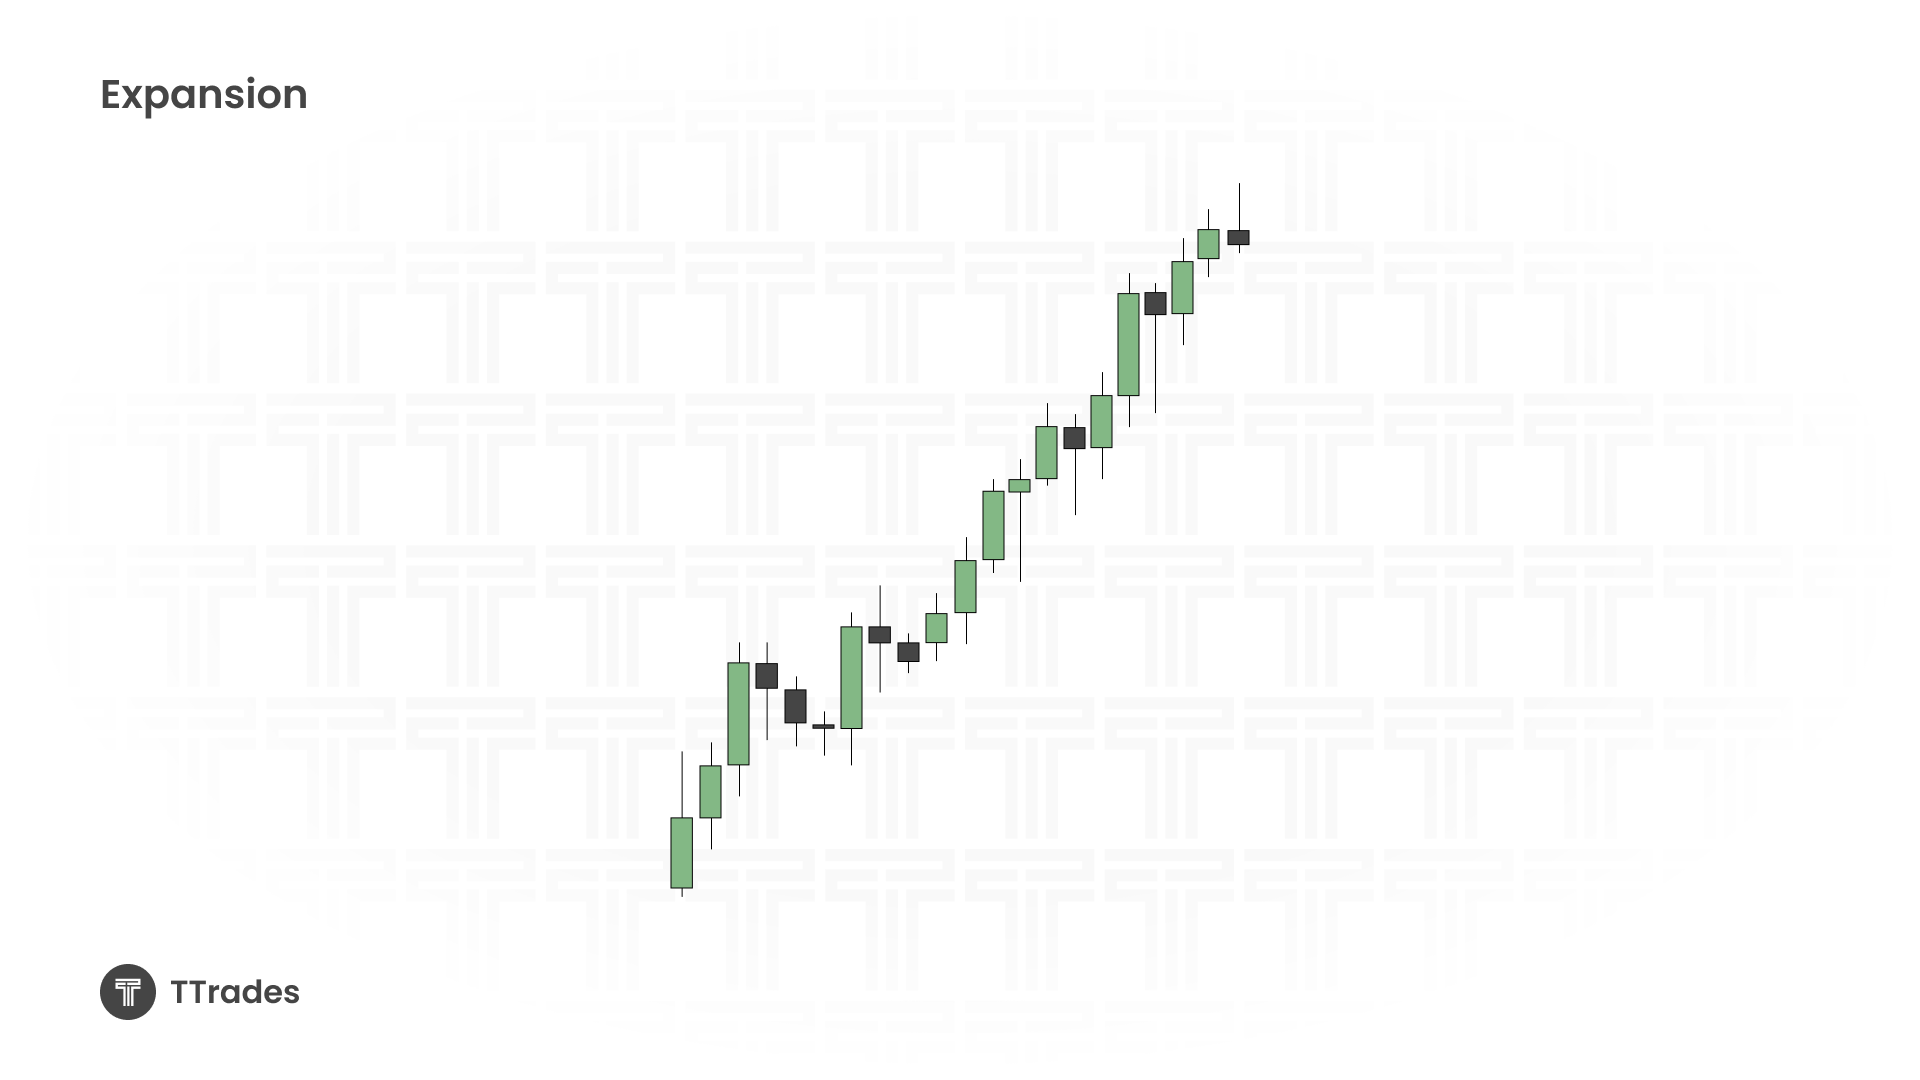
What Is Expansion?
Expansion is a one-sided trending move in the market.
It’s defined by:
- Large range candles moving decisively in one direction.
- Very shallow moves against the trend, small pullbacks that fail to reach deep discounts (in bullish trends) or premiums (in bearish trends).
- In a bullish expansion, price trends upward with only minor pullbacks.
- In a bearish expansion, price trends downward with only minor bounces.
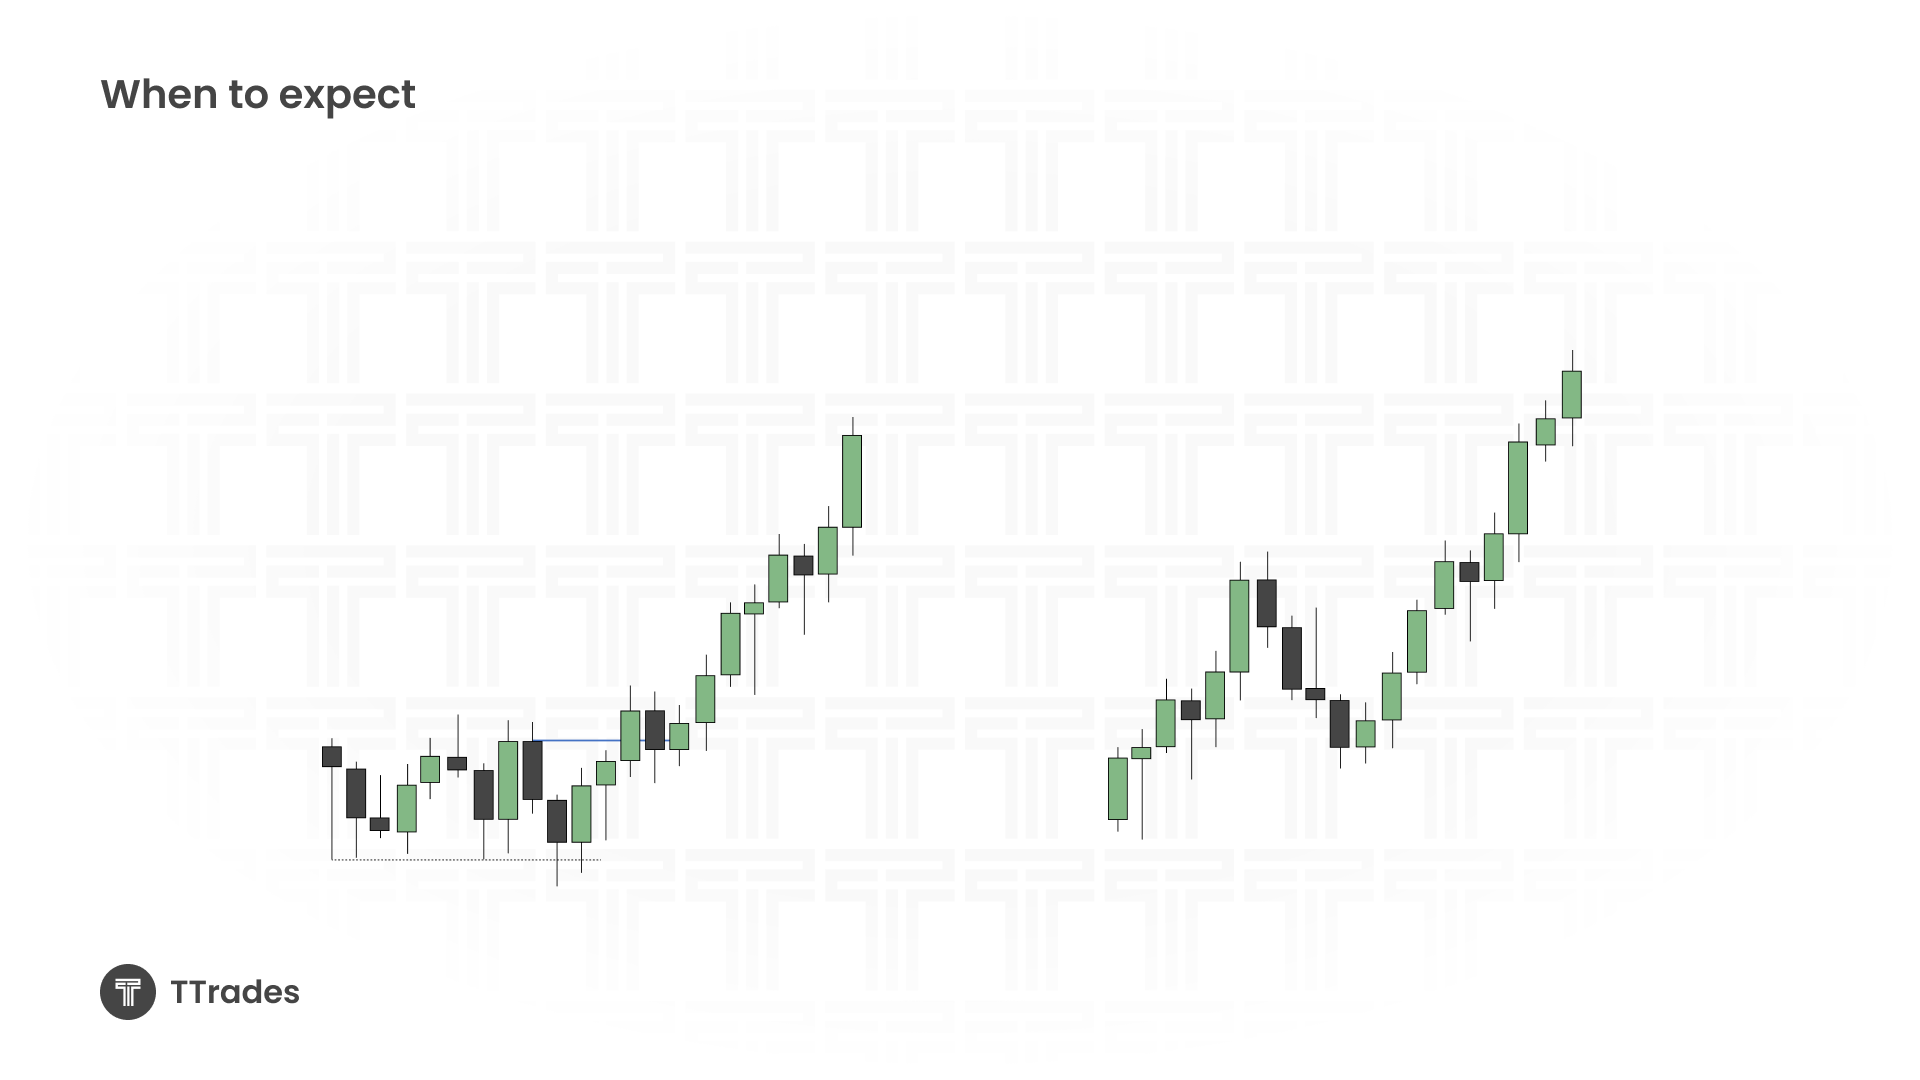
When Does Expansion Occur?
Expansion usually forms after a smaller range:
- After a Consolidation – Price breaks out of a range with momentum.
- After a Retracement – A shallow pullback ends and trend resumes.
This reflects the market’s natural cycle:
- Small range → large range
How to Recognize Expansion
Expansion phases have a signature “look”:
- Shallow pullbacks against the main trend.
- Protected swings forming along the way.
- Price often respects opposing candles:
- Bullish trend: Down-close candles act as support.
- Bearish trend: Up-close candles act as resistance.
💡Pro Tip: Use my EQ (Equilibrium) method to focus on the upper half of the higher time frame candle in bullish setups, and the lower half in bearish setups.
How to Trade Expansion
Identify Higher Time Frame Context
- Use the daily chart or higher timeframe to spot reversals or breakouts that could trigger expansion.
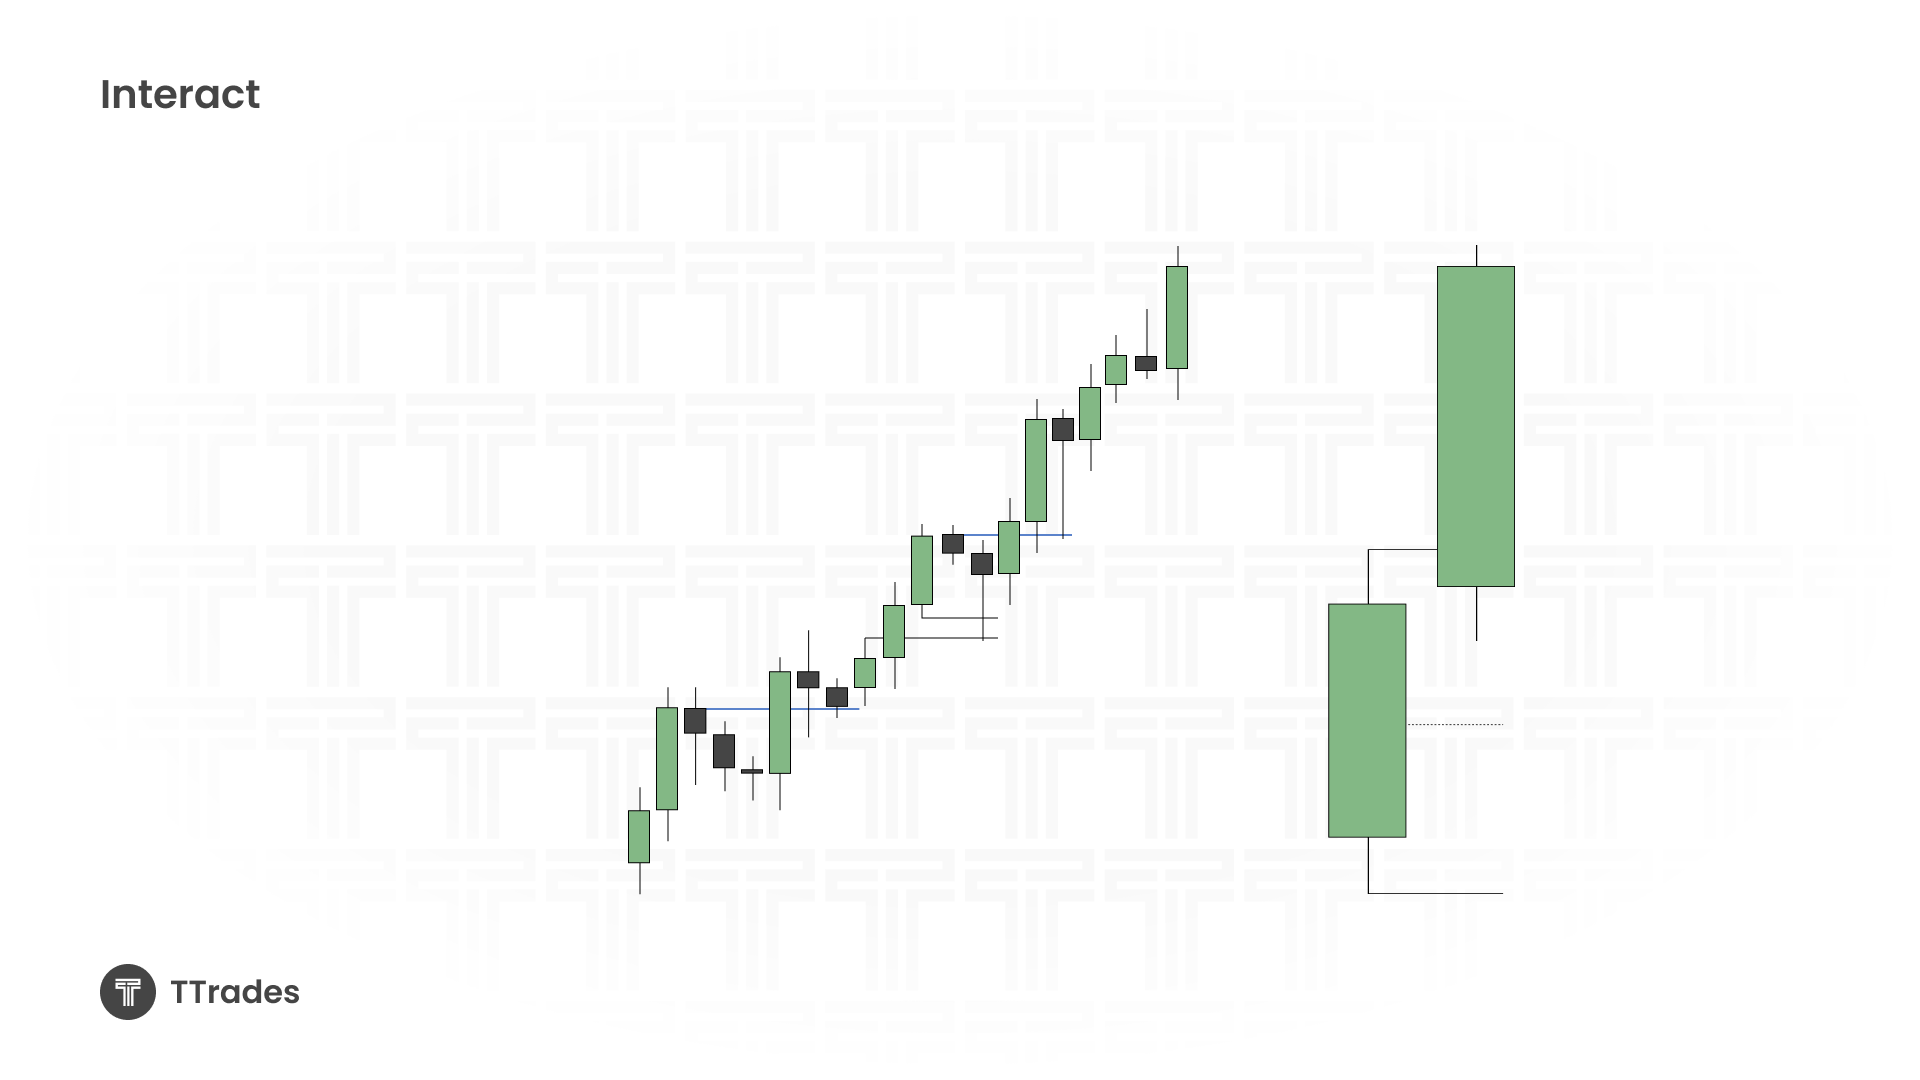
Mark Protected Swings
- After a reversal or breakout, track protected swings on a lower timeframe levels that price should not violate if the trend is to continue.
Look for POI
- When price taps a point of interest, such as a fair value gap, watch for candle closures over (bullish) or under (bearish) the opposing candles.
Execute With Trend
- Enter after confirmation.
- Place stops with the protected swing.
- Target liquidity pools like prior highs or lows.
Chart Examples
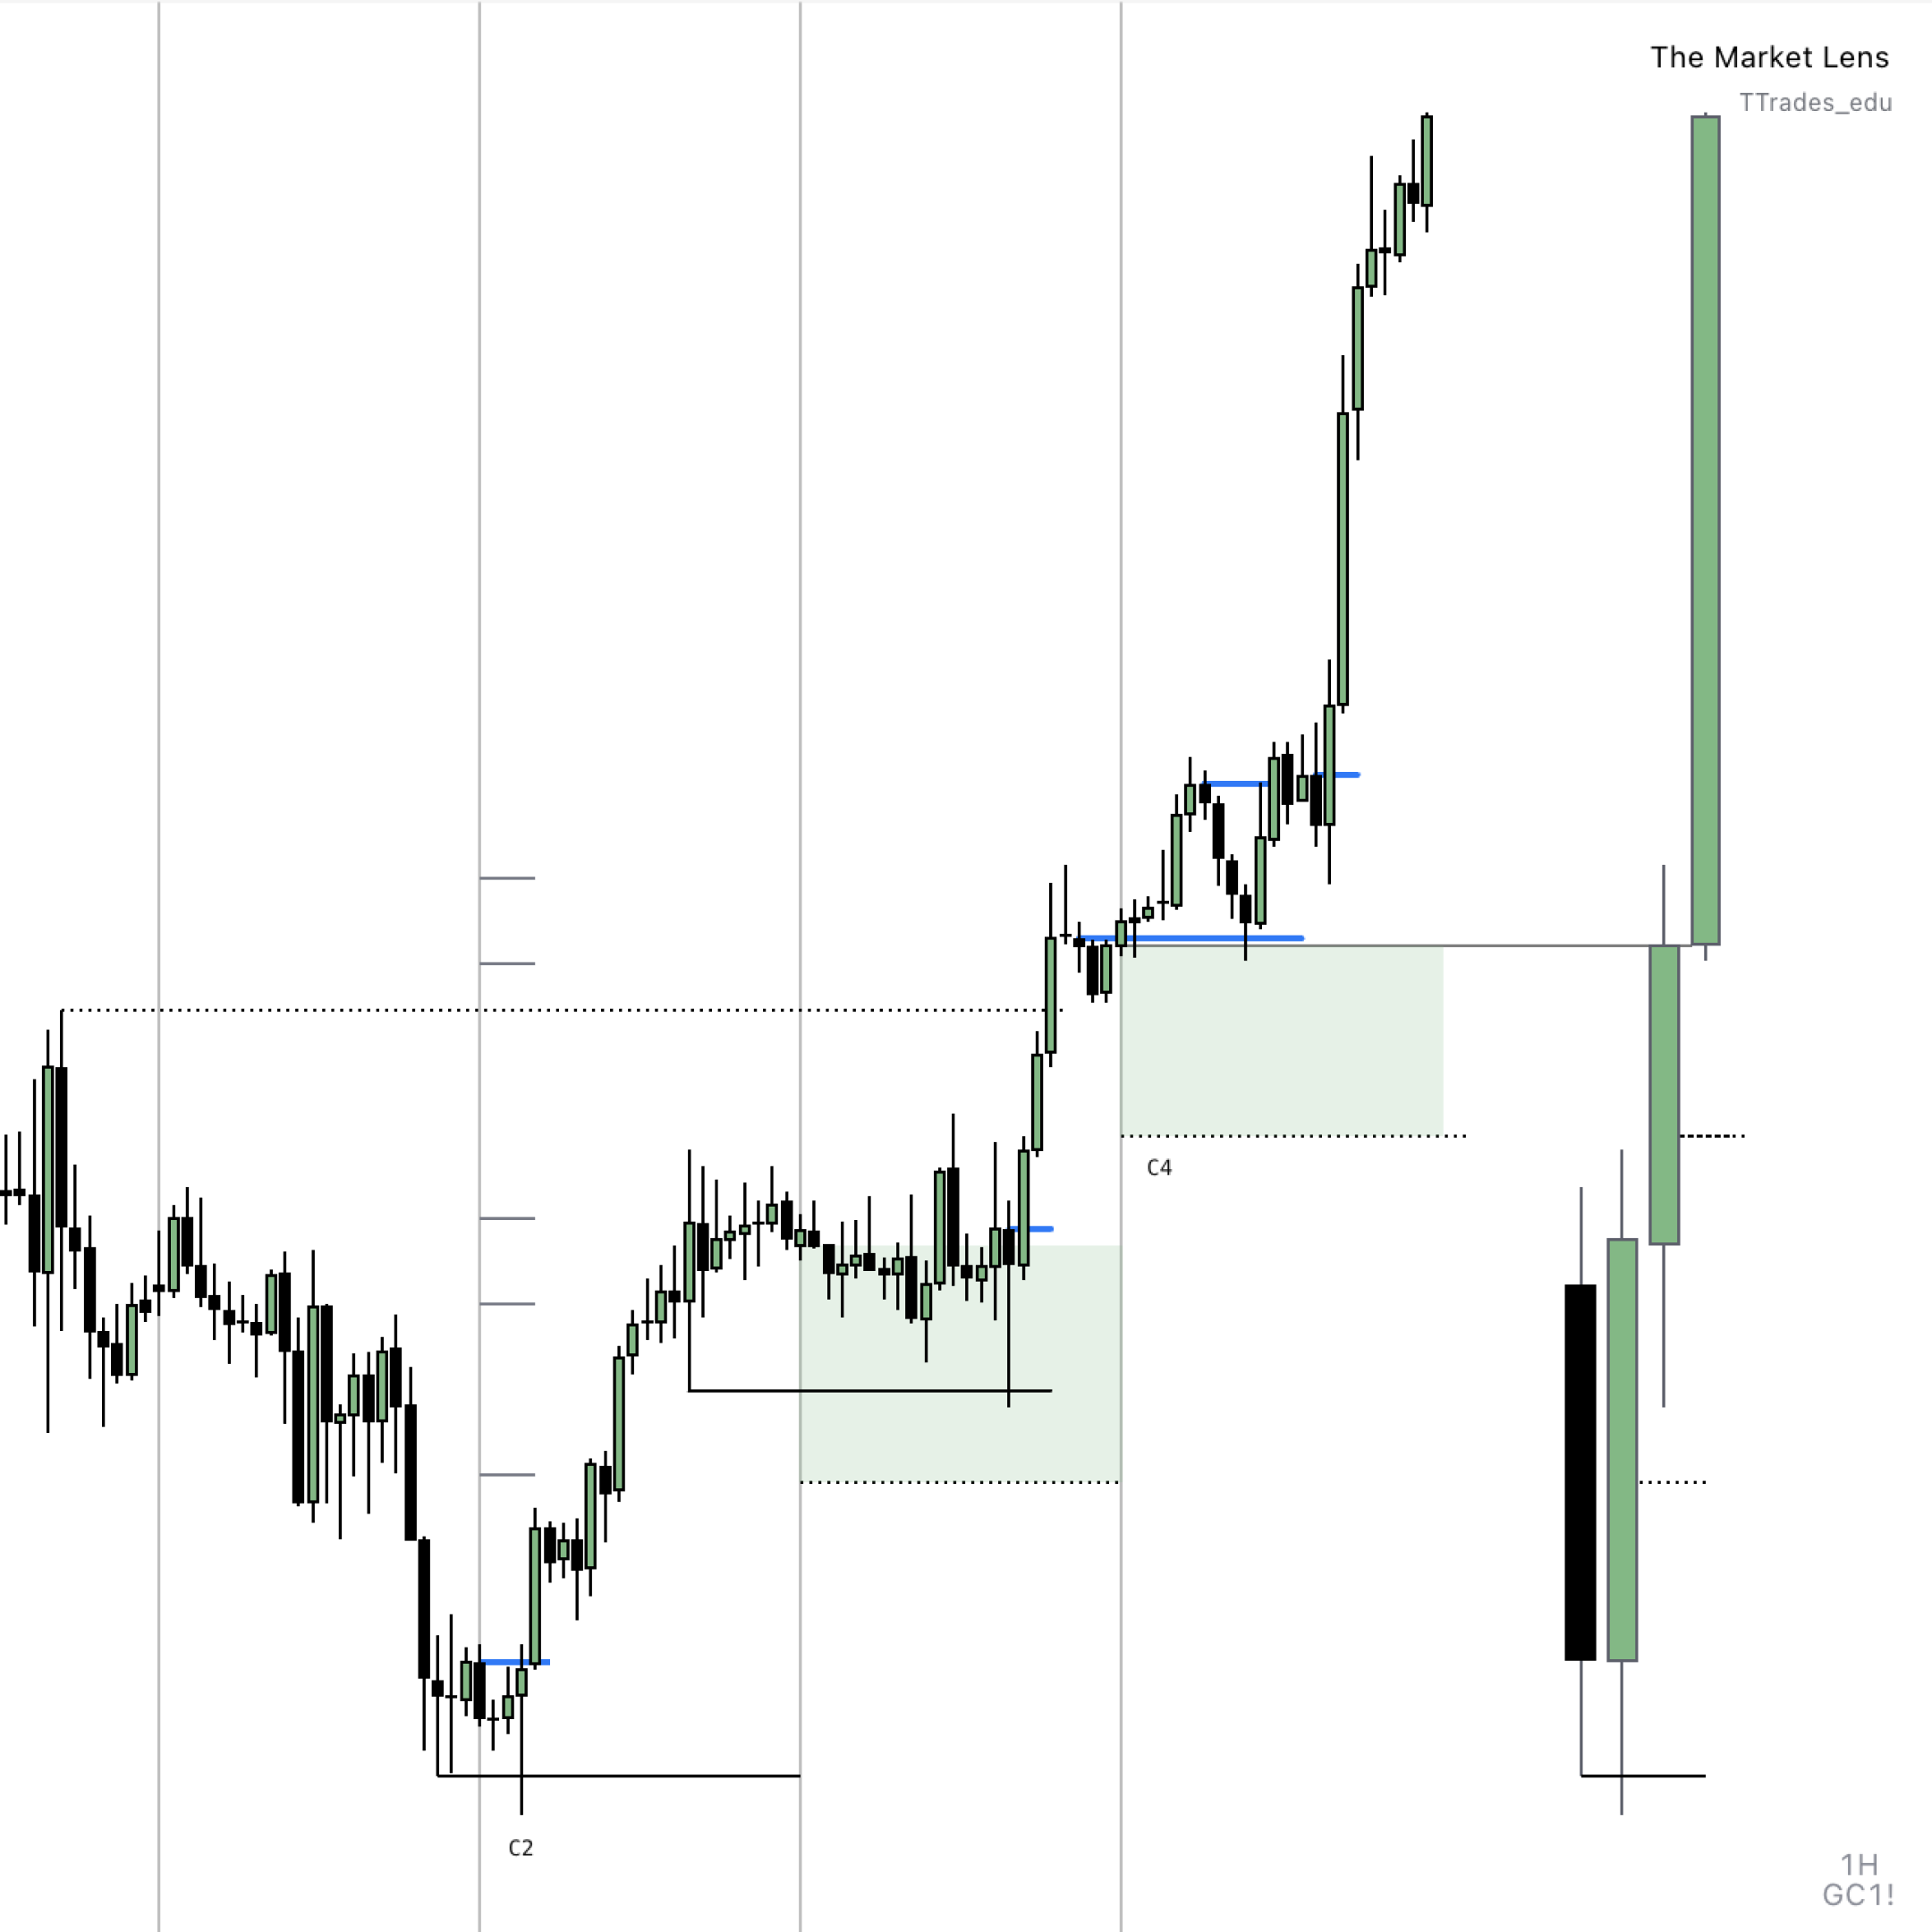
Example 1 – Gold Hourly + Daily Context
- Daily reversal → hourly expansion phase.
- Series of protected swings respected.
- Large range days alternate with small range pullbacks.
💡 Pro Tip: When price consolidates after a large range, wait for an external high or low to be taken before engaging in the market. This will help in avoiding consolidations.
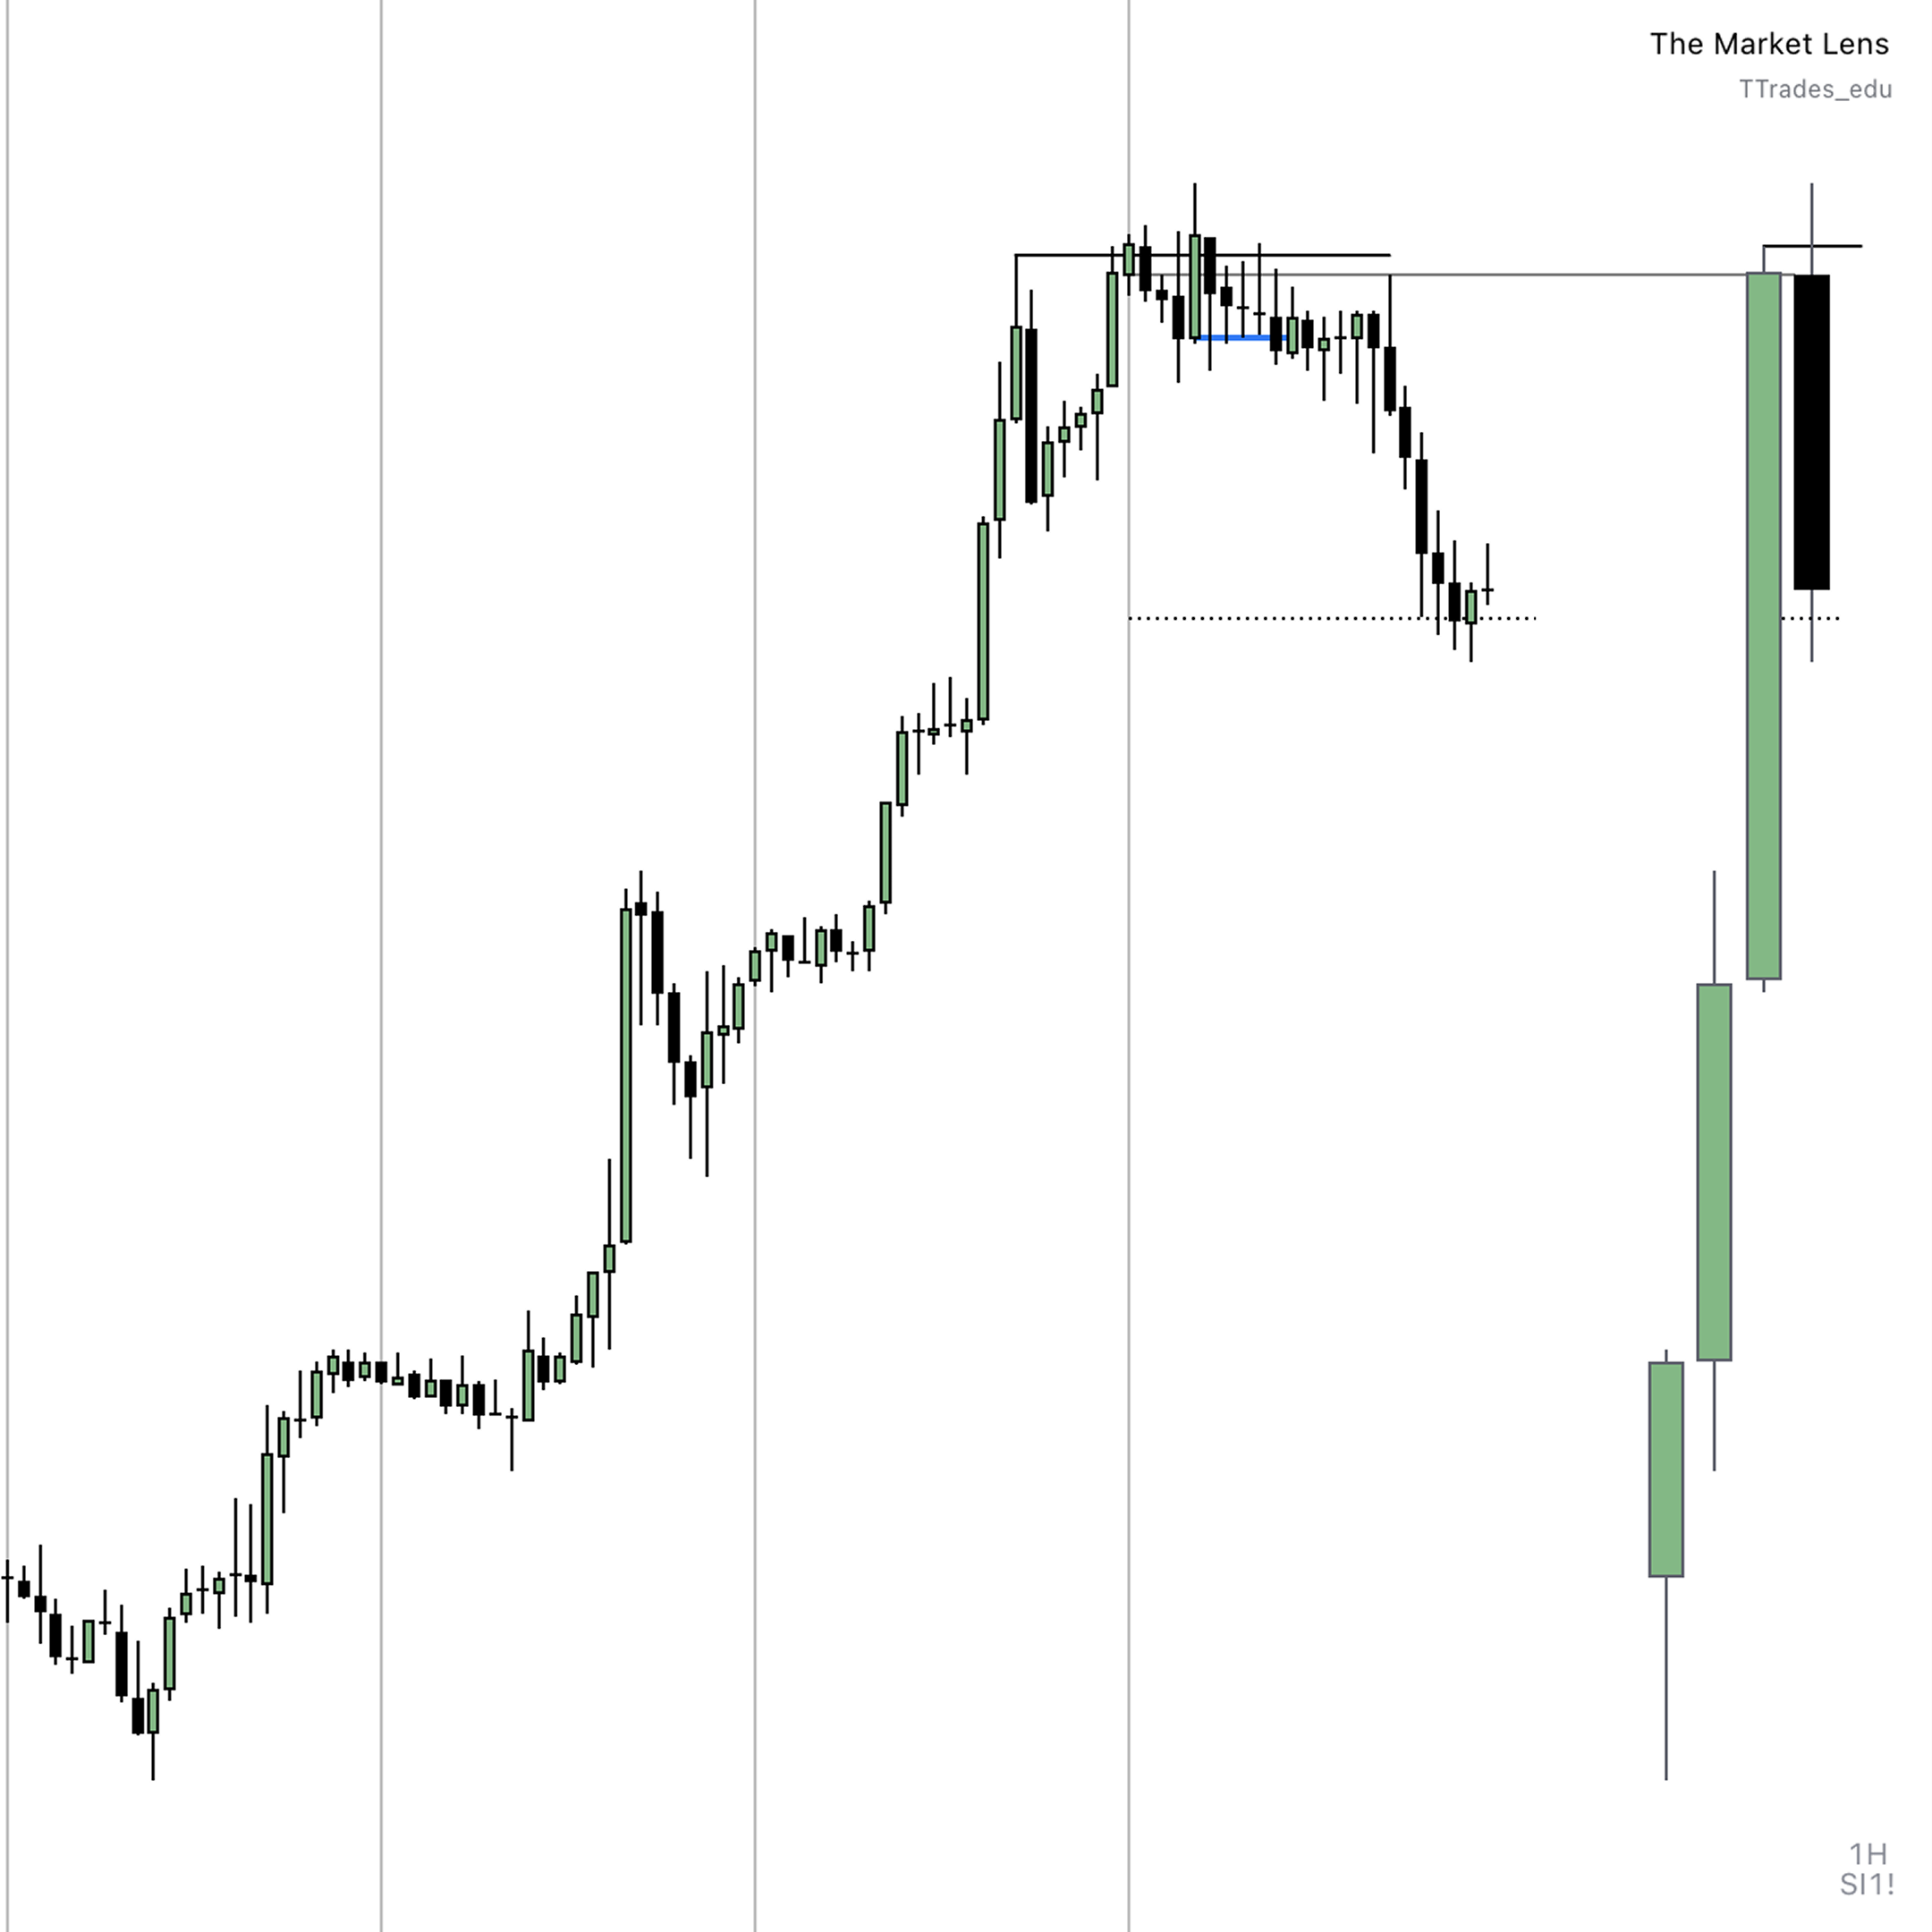
Example 2 – Silver Daily
- Three-day expansion hits an objective.
- Market shifts to a new phase, either consolidation, retracement, or reversal.
💡 Pro Tip: Avoid trading price in the same direction after 3 days of expansion. It is possible for a new phase of price to occur. This is a general rule from AM Trades.
Expansion Patterns to Watch
- Large Range → Small Range → Large Range: Classic trend continuation pattern.
- Three-Day Rule: Extended expansions often give way to consolidation, retracement, or reversal.
- Failure to Manipulate: If price fails to manipulate (form a reversal) a key level during consolidation, it often resumes in the direction of expansion (breakout).
Expansion Across Time Frames
The concept is fractal:
- Works on daily/hourly for swing trading.
- Works on hourly/5-minute for intraday.
- Works on 15-minute/1-minute for scalping.
- Works on monthly/daily for macro setups.
Time frame alignment can dramatically increase trade probability.
Key Takeaways
- Expansion = strong, one-sided move with shallow retracements.
- Usually follows consolidation or retracement.
- Track protected swings to manage risk and confirm trend.
- Use higher time frame context for directional bias.
- After multiple days of expansion, prepare for a new phase.