
Introduction
One of the biggest challenges traders face is knowing where price is most likely to go next. Instead of guessing or reacting late, the Next Day Model (sometimes called the Next Candle Model) provides a structured way to anticipate price behavior using nothing more than the previous candle. This approach is rooted in fractal concepts, meaning it can be applied across all timeframes, from monthly charts to intraday setups.
In this blog, we’ll break down how the model works, what defines a continuation versus a reversal, and how to combine it with price phases to create higher-probability trade ideas.
Understanding Continuation vs. Reversal
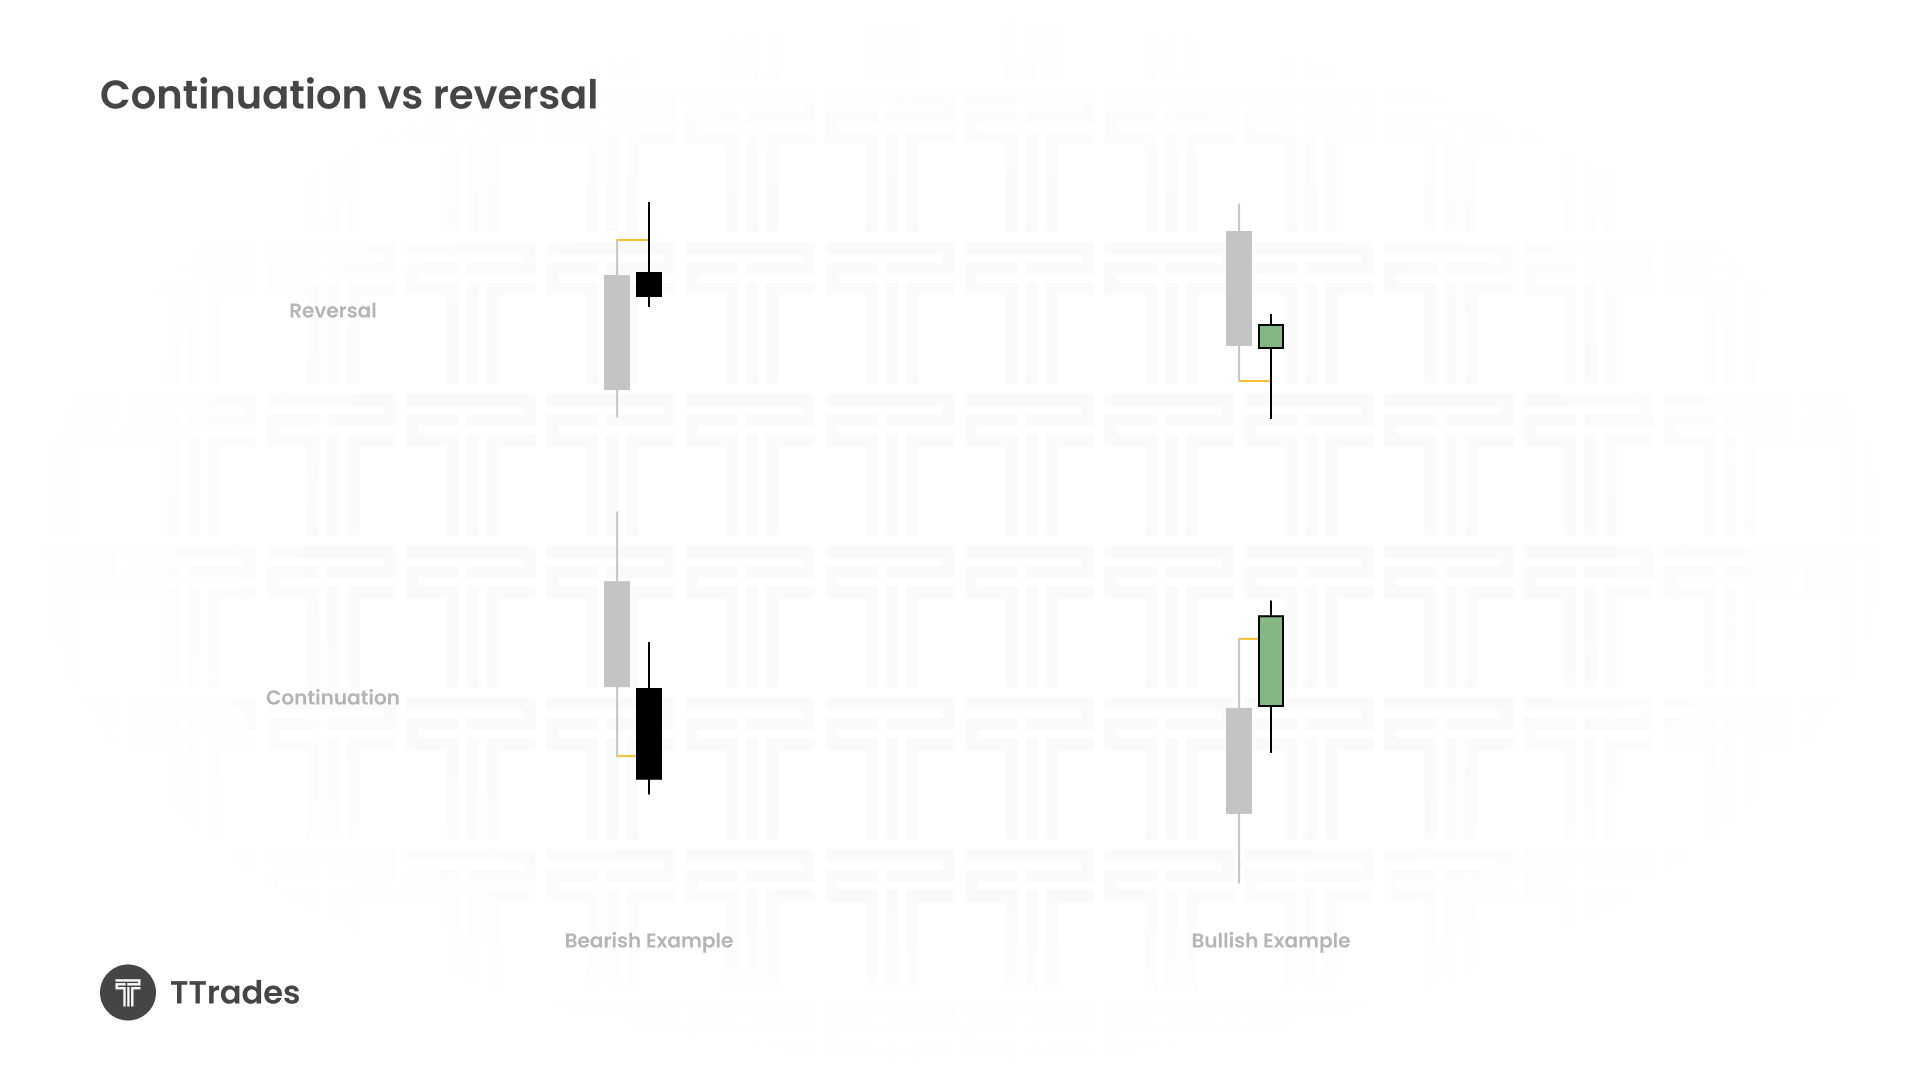
The foundation of the Next Day Model is the relationship between a candle and its previous high or low:
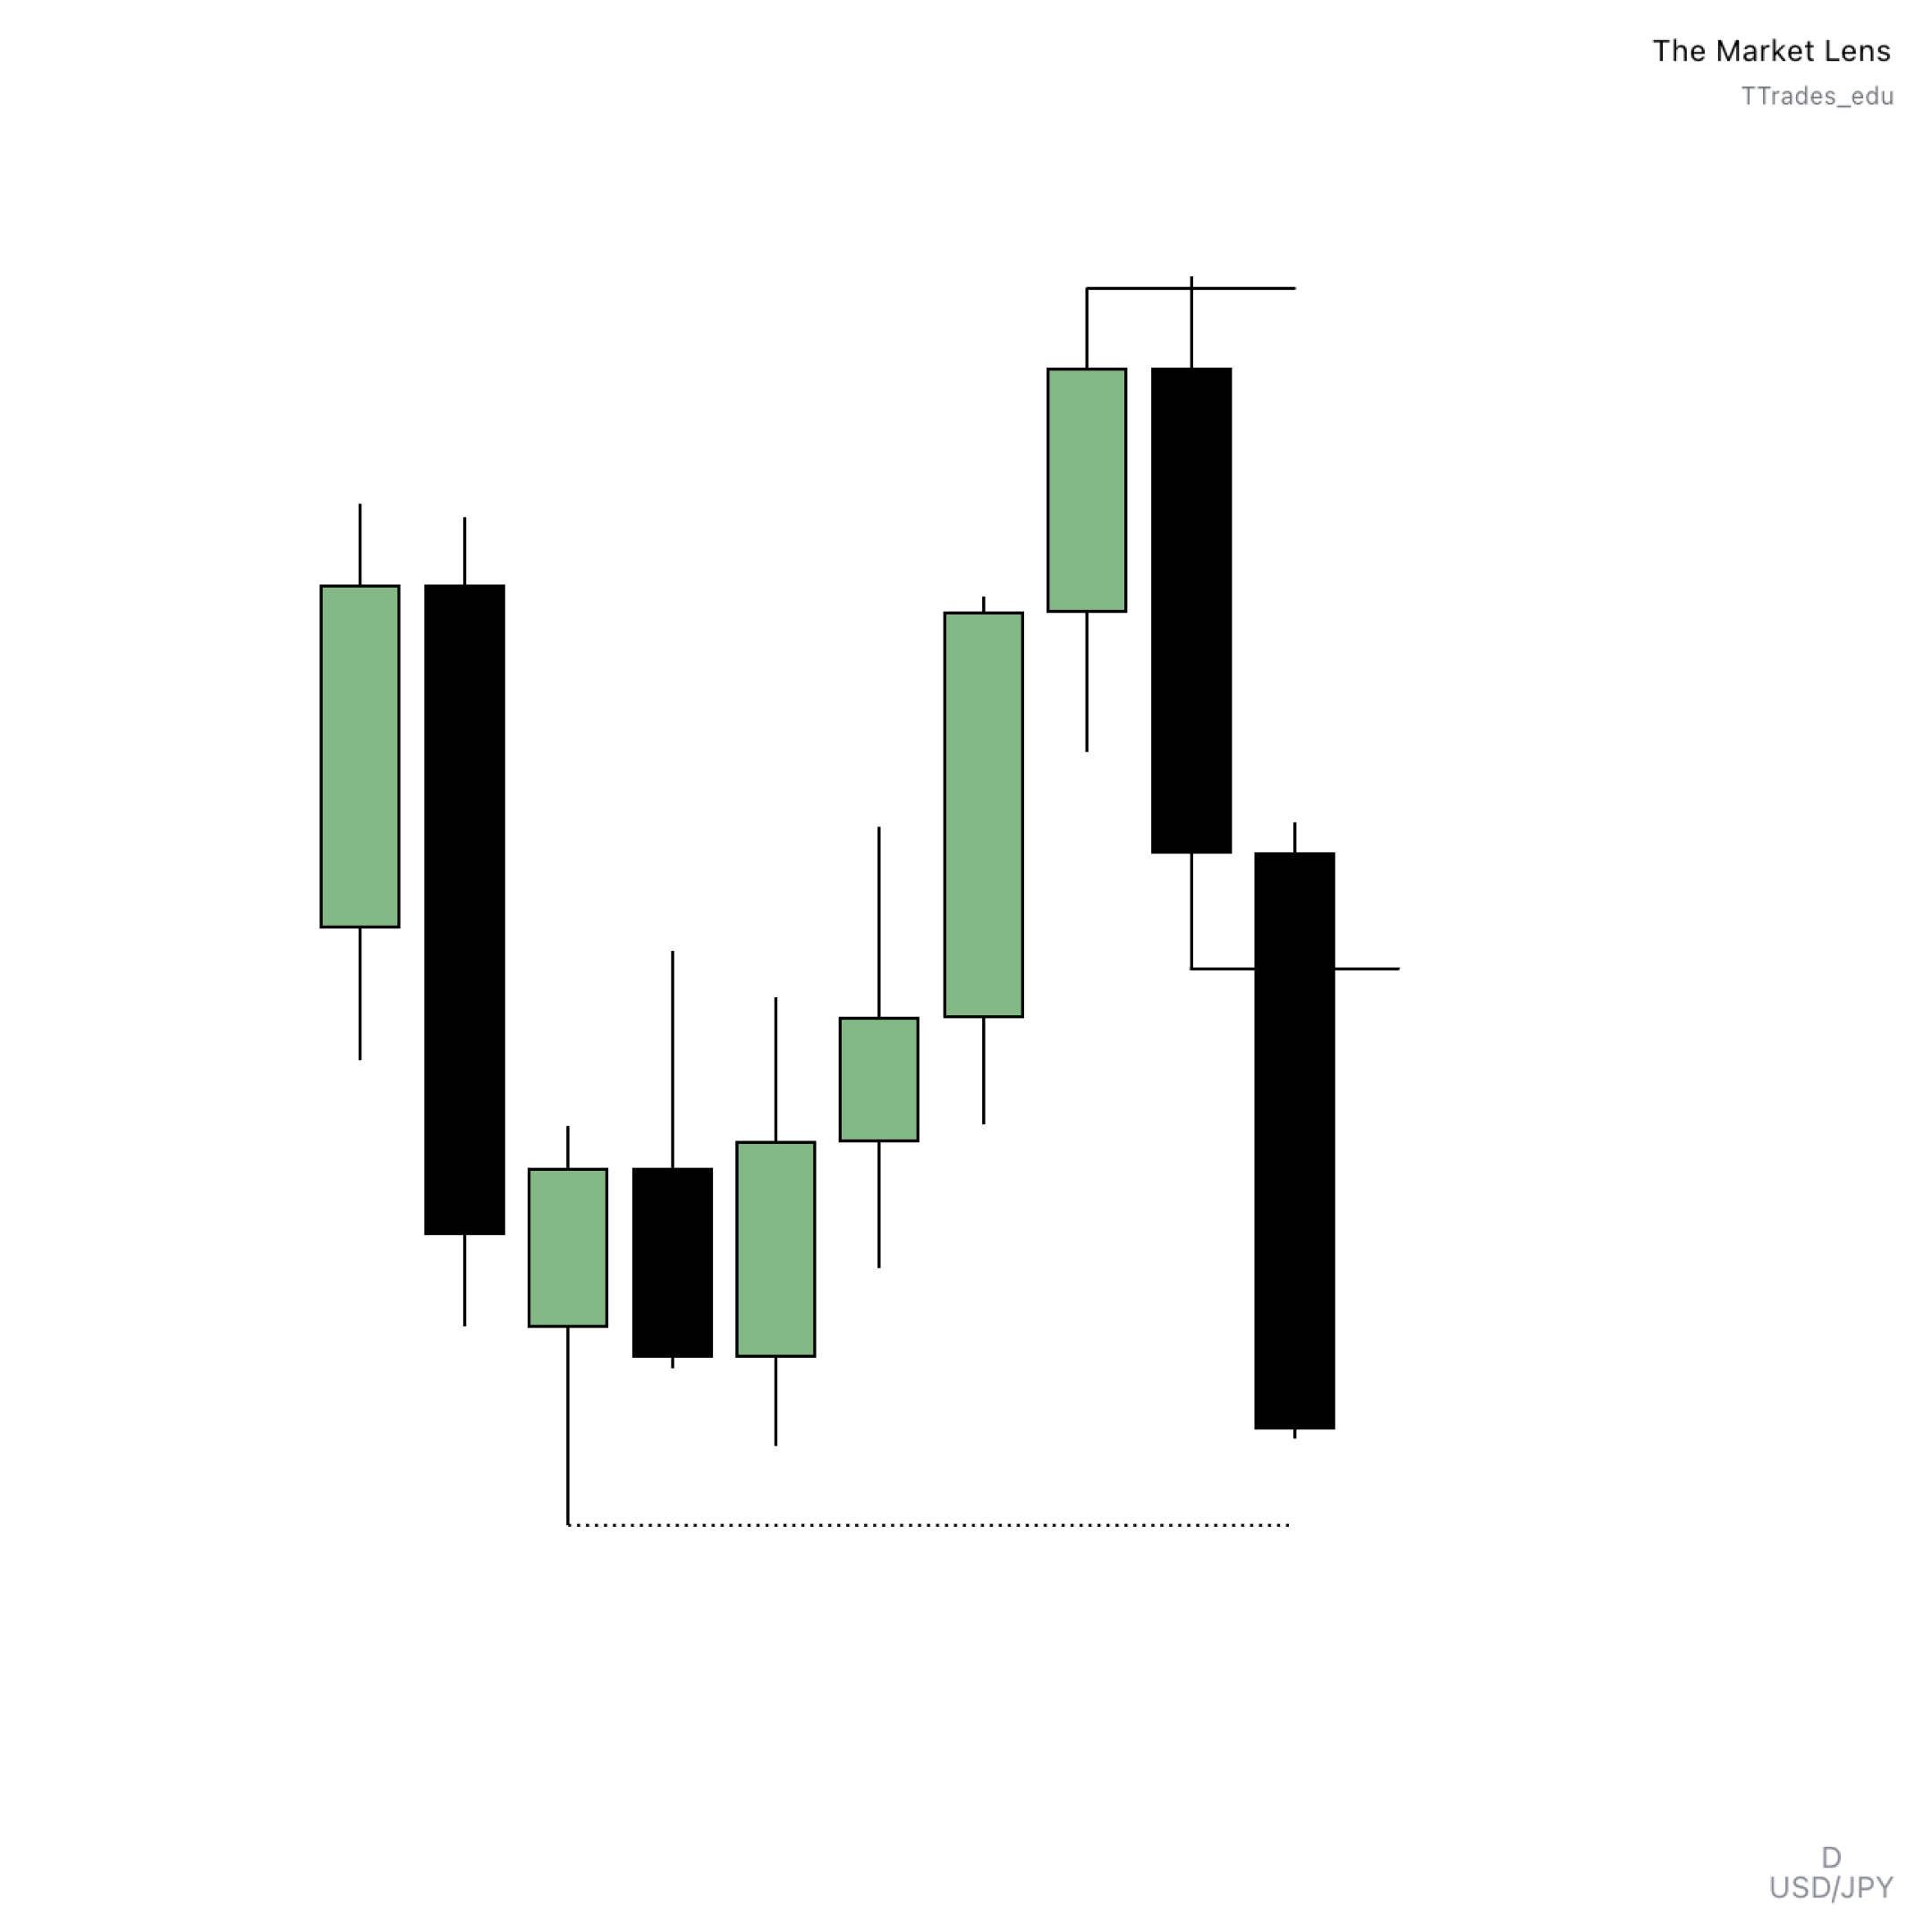
Reversal: Price sweeps the previous candle’s high or low, then closes back inside the range.
Example: If yesterday’s high is swept, but the candle closes back inside, it signals potential bearish continuation the next day.
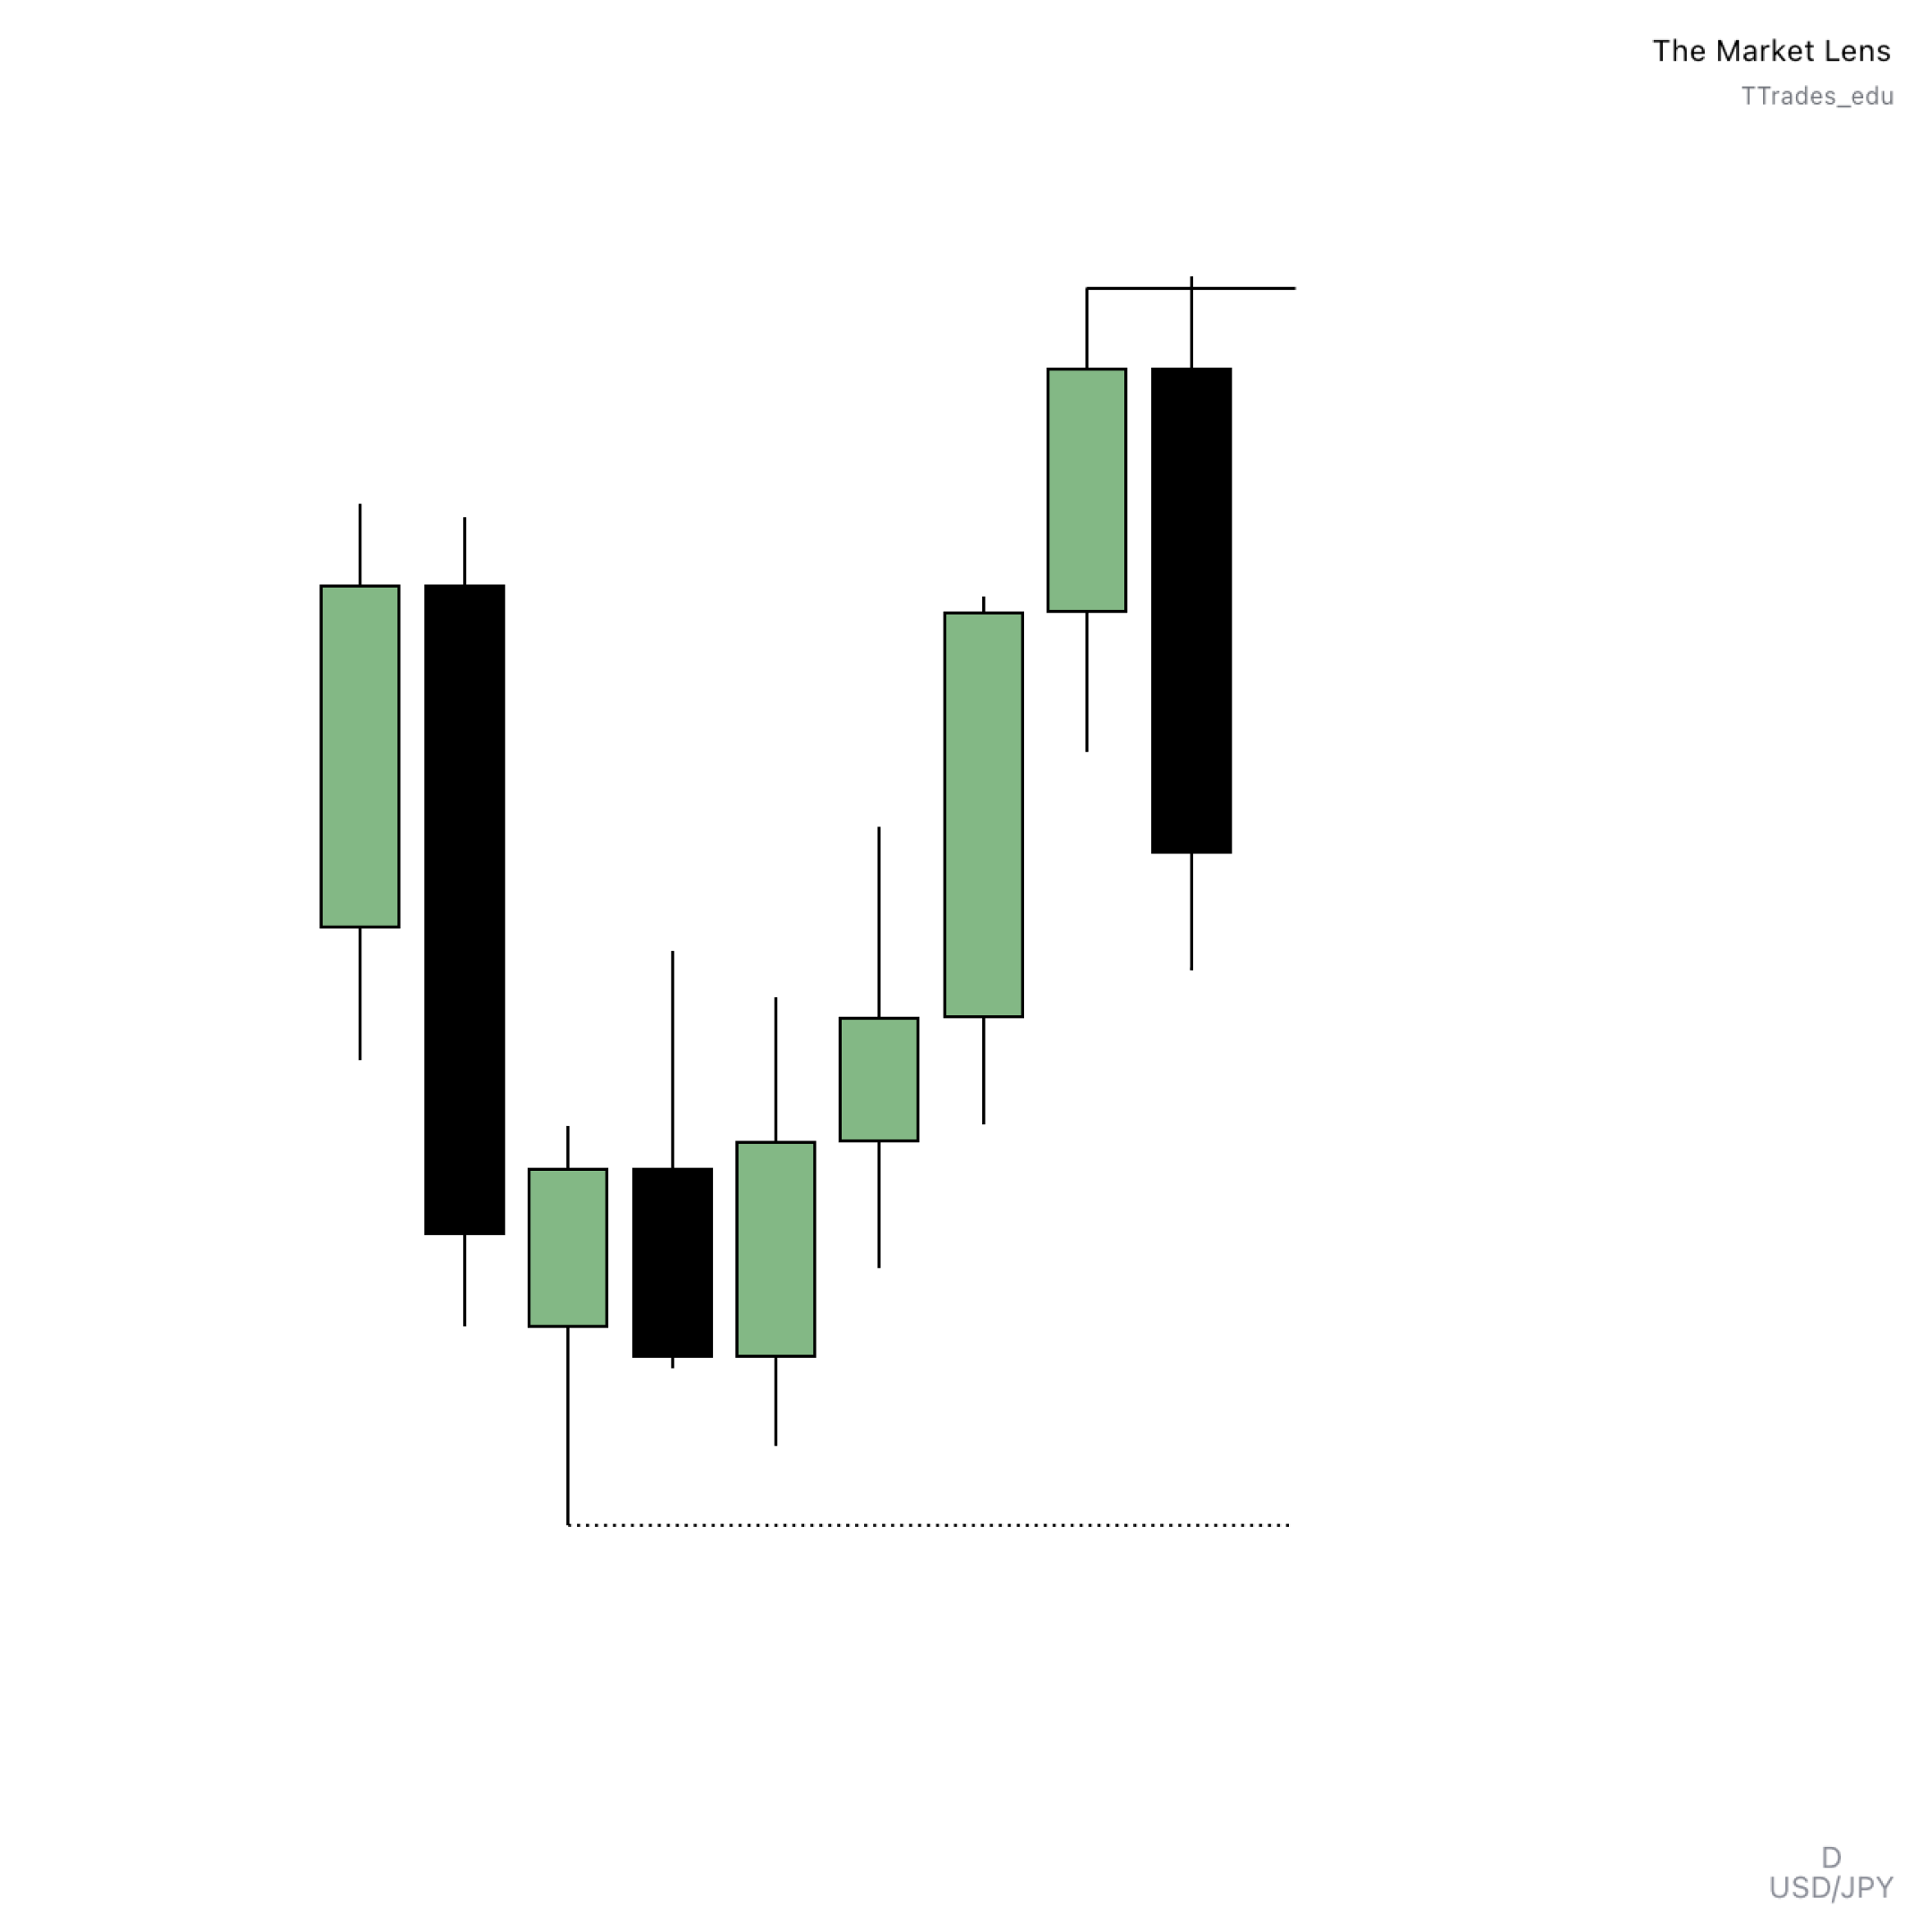
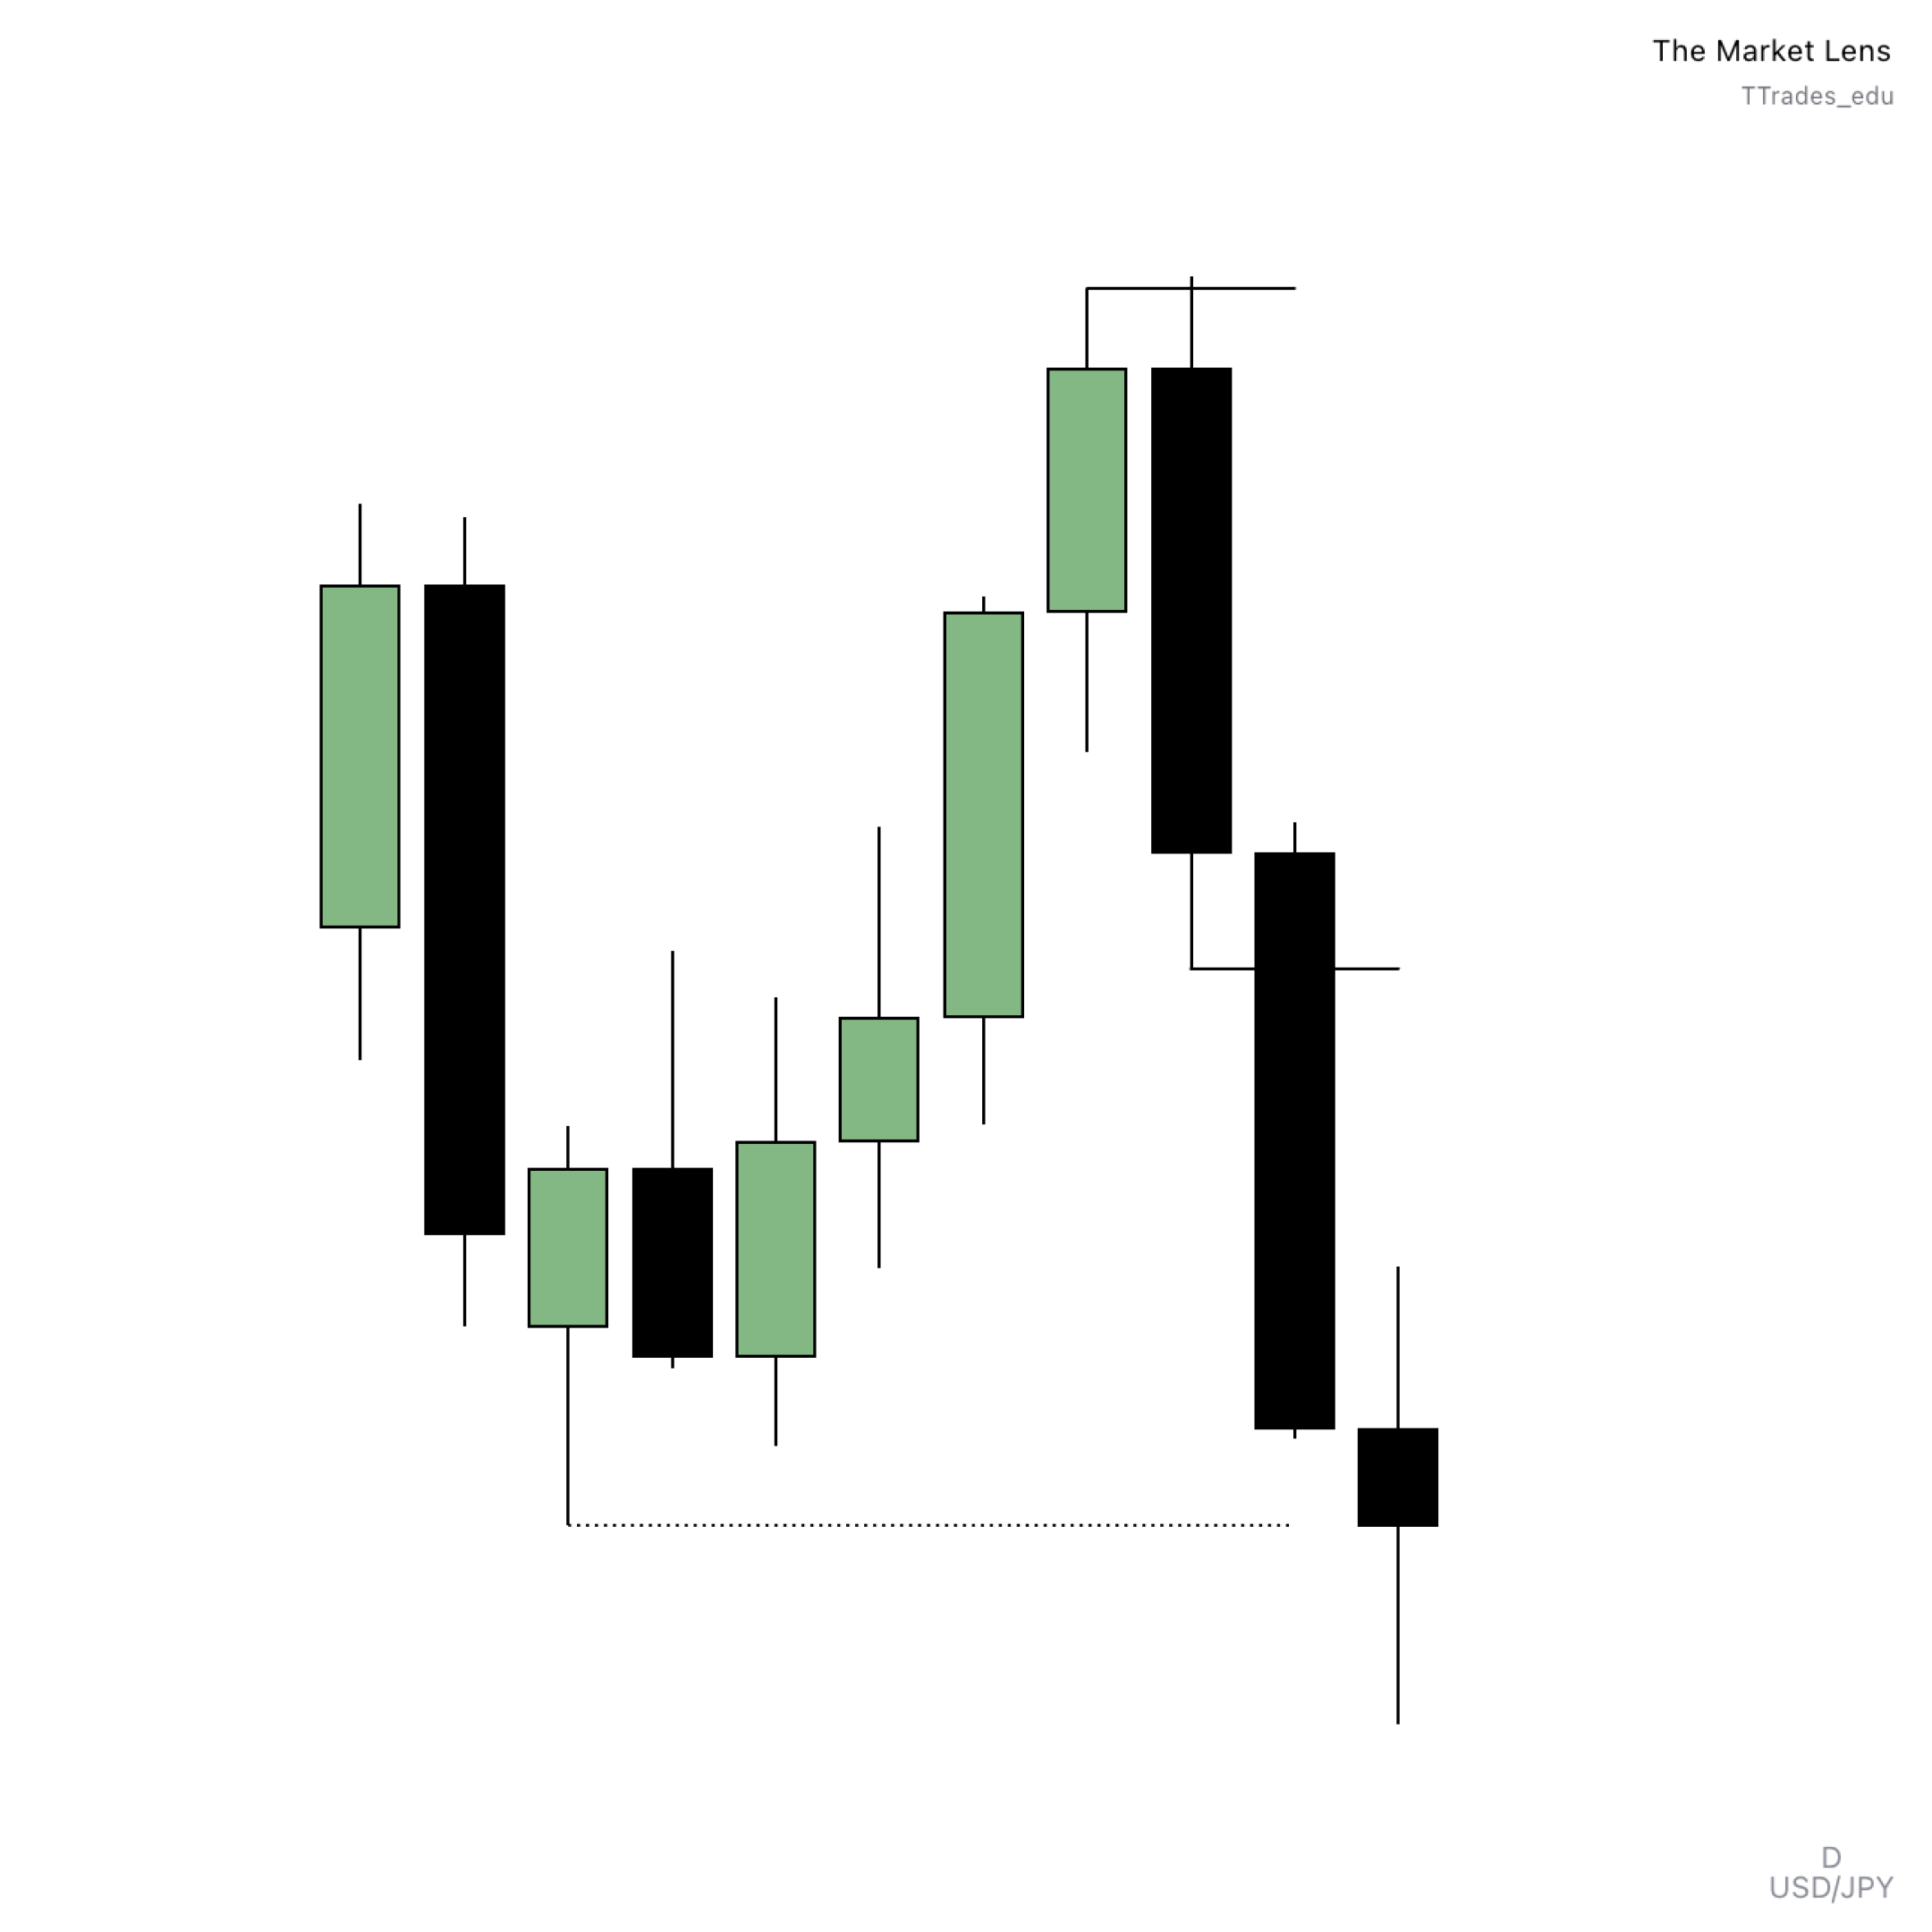
Continuation: Price sweeps the previous candle’s high or low, then closes outside the range.
Example: If today closes above yesterday’s high, anticipate a bullish continuation the following day.
This simple framework allows traders to form a bias for the next candle without overcomplicating analysis.
Blending With Phases of Price Delivery
Price doesn’t move in one straight line. Instead, it cycles through phases:
Expansion
Retracement
Consolidation
Reversal
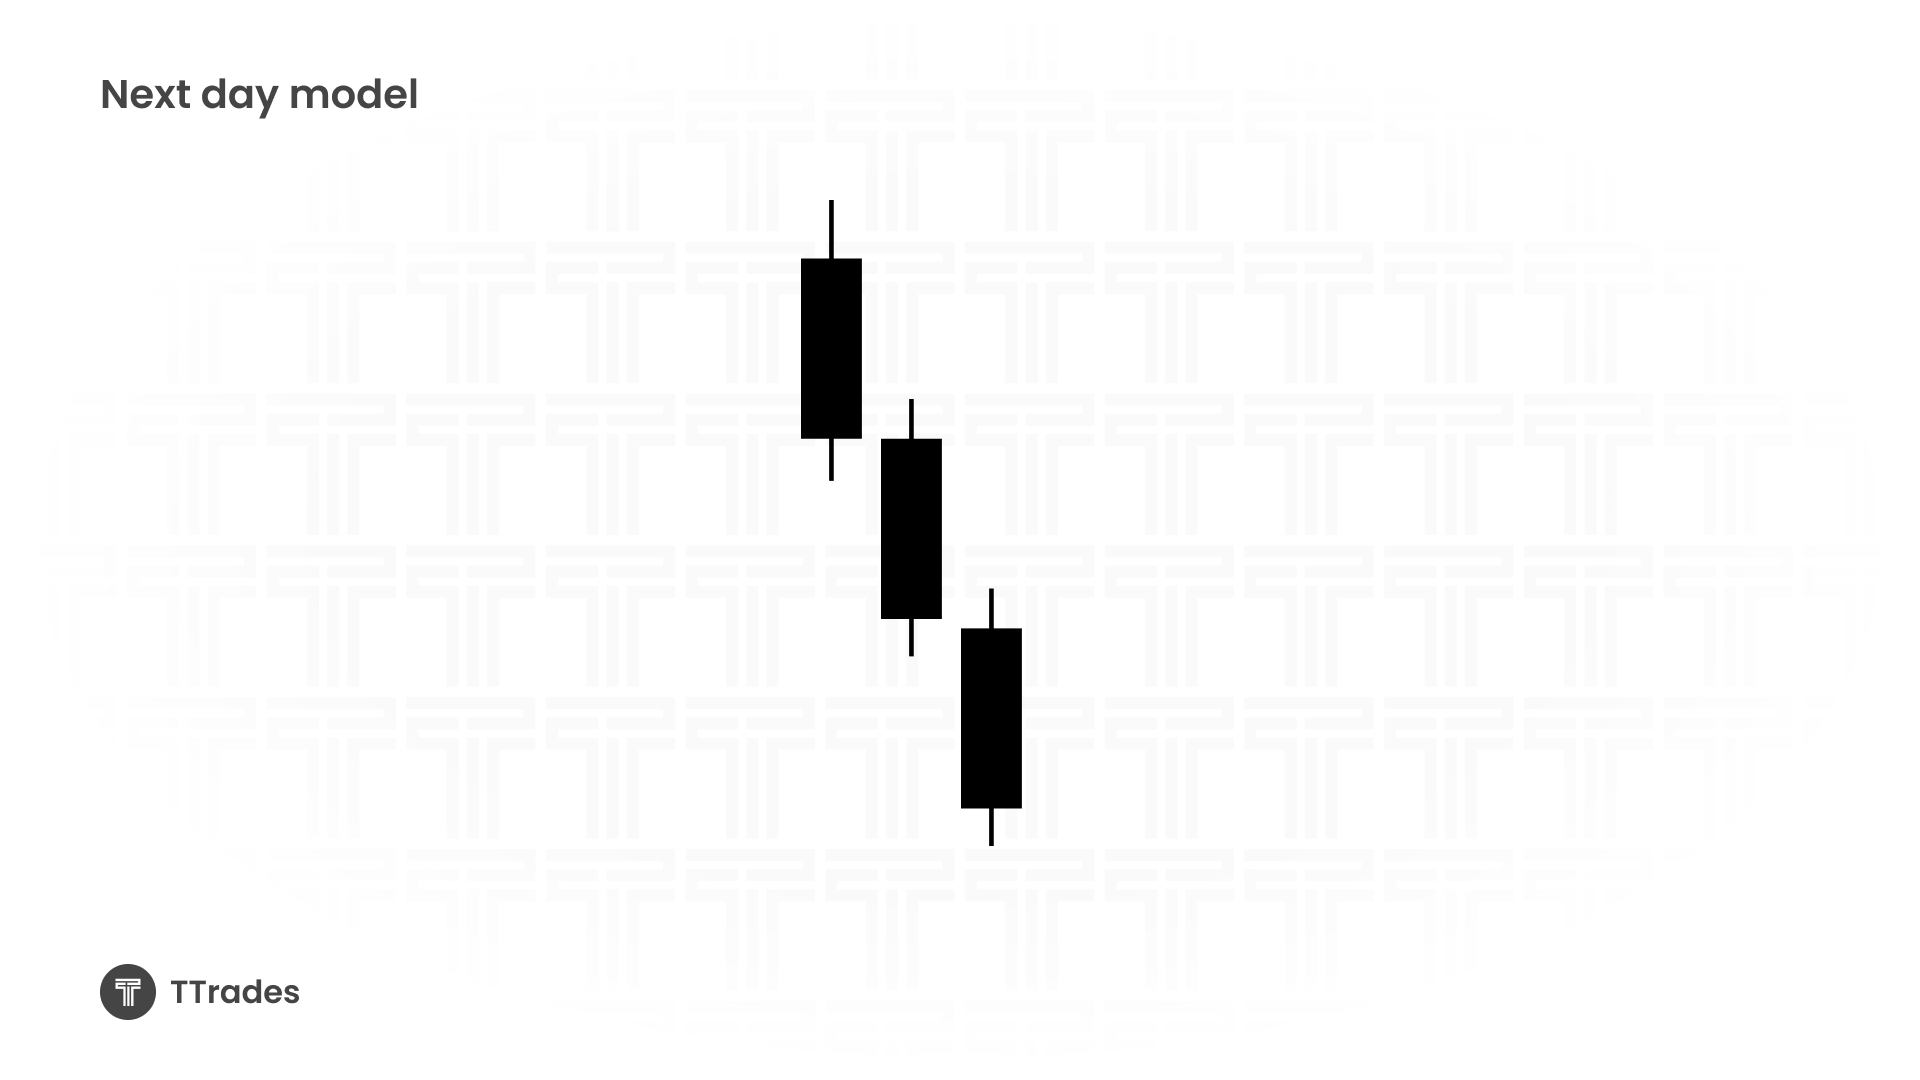
When you recognize multiple days of expansion, it’s wise to expect a shift in phase. For example:
After three consecutive bearish continuations, it is likely for price to enter a new phase of price : retracement, reversal, or consolidation.
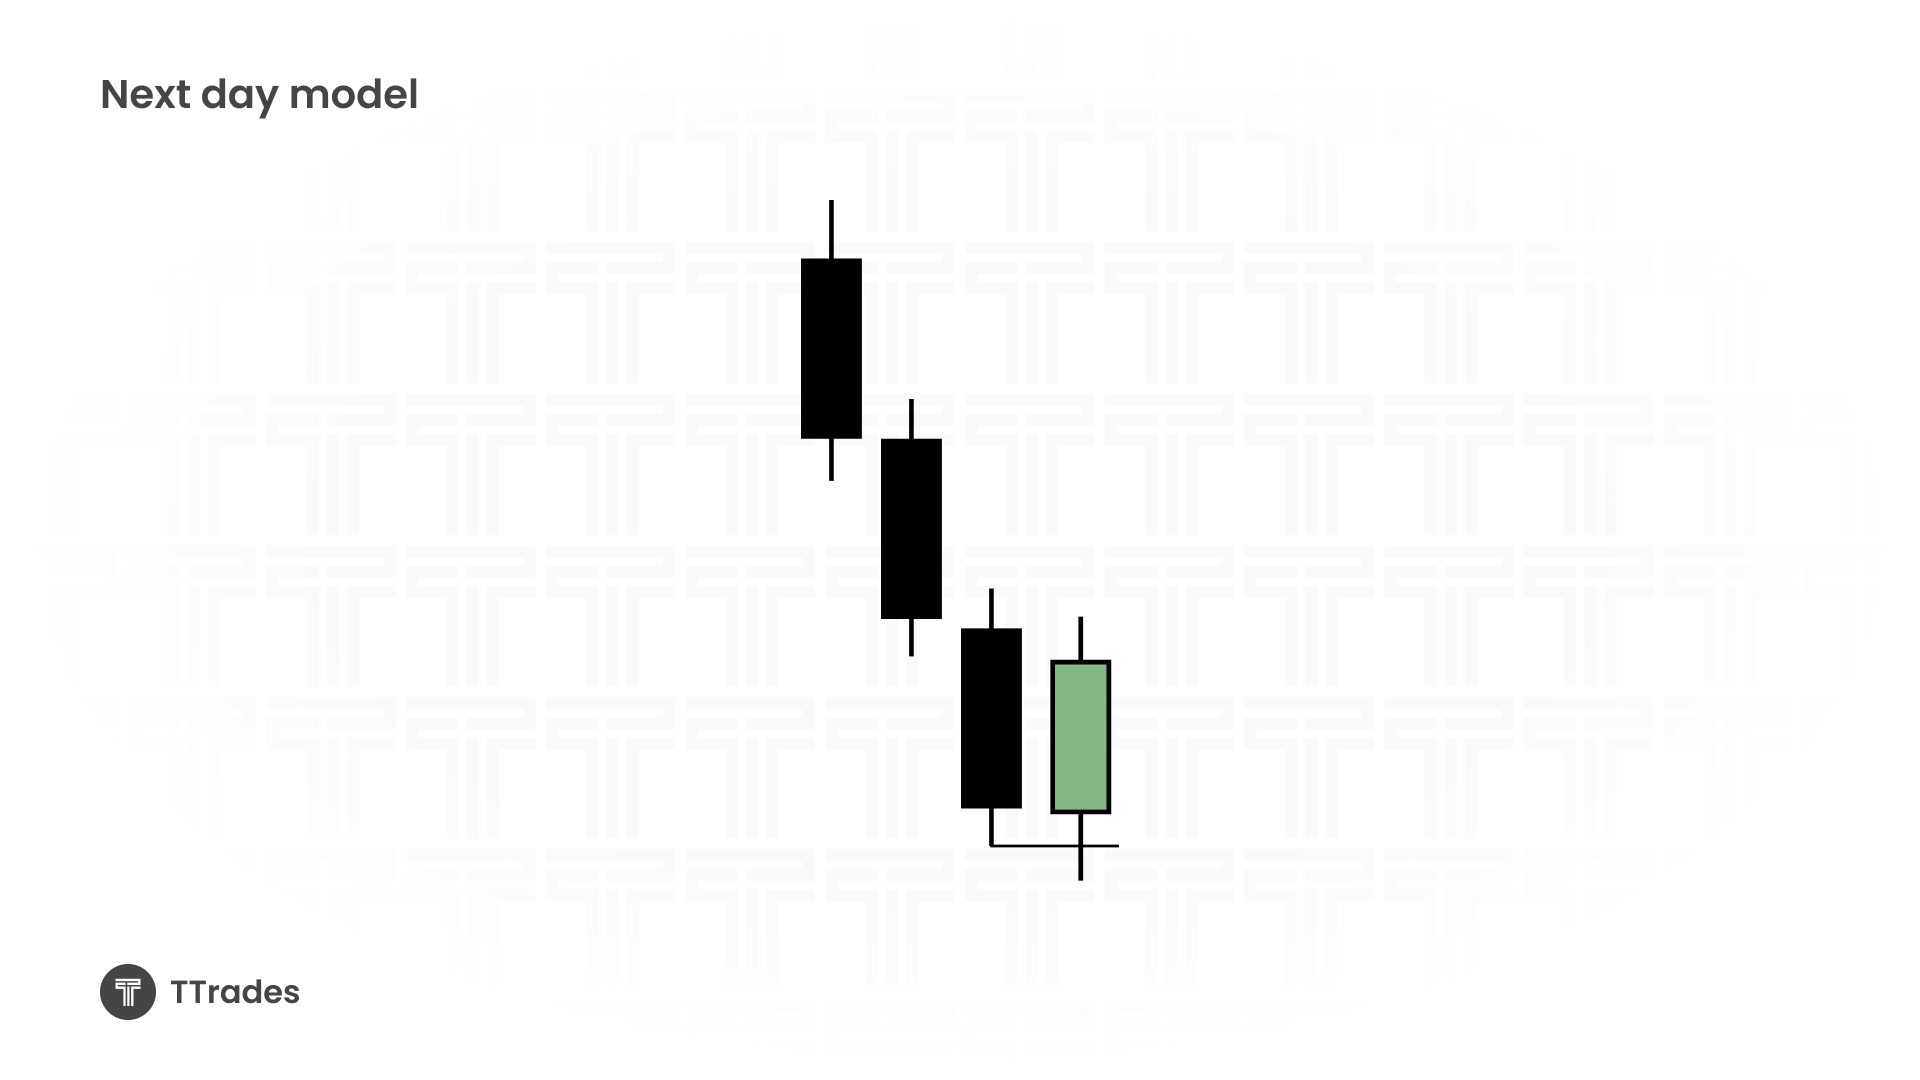
Instead of forcing continuation trades after price has already expanded, wait for price to enter a new phase of price. This will keep traders from getting caught shorting the low or longing the high.
Practical Examples on the Daily Chart
Looking at daily candles:
A close outside the previous high → bias for continuation.
A sweep and close back inside → bias for reversal.
Multiple candles expanding in one direction → expect retracement, consolidation, or reversal soon.
For example:
Sweep of a daily high, close back inside the range → anticipate bearish price action the next day.
Closure below the previous candle low → anticipate bearish continuation.
Since the concept is fractal, you can scale it down to the hourly or even 5-minute charts.
Why This Works Well in Practice
It’s mechanical and repeatable, just track the previous candle closes.
It works across all timeframes, making it versatile for swing traders and scalpers alike.
Key Takeaways
A close outside the previous candle’s high or low = continuation bias.
A sweep and close back inside = reversal bias.
After multiple continuation candles, expect retracement or reversal.
Use lower timeframes to refine entries once higher-timeframe bias is set.
The Next Day Model is a simple, yet powerful model that can be used for bias as well as lower timeframe entries.