Introduction
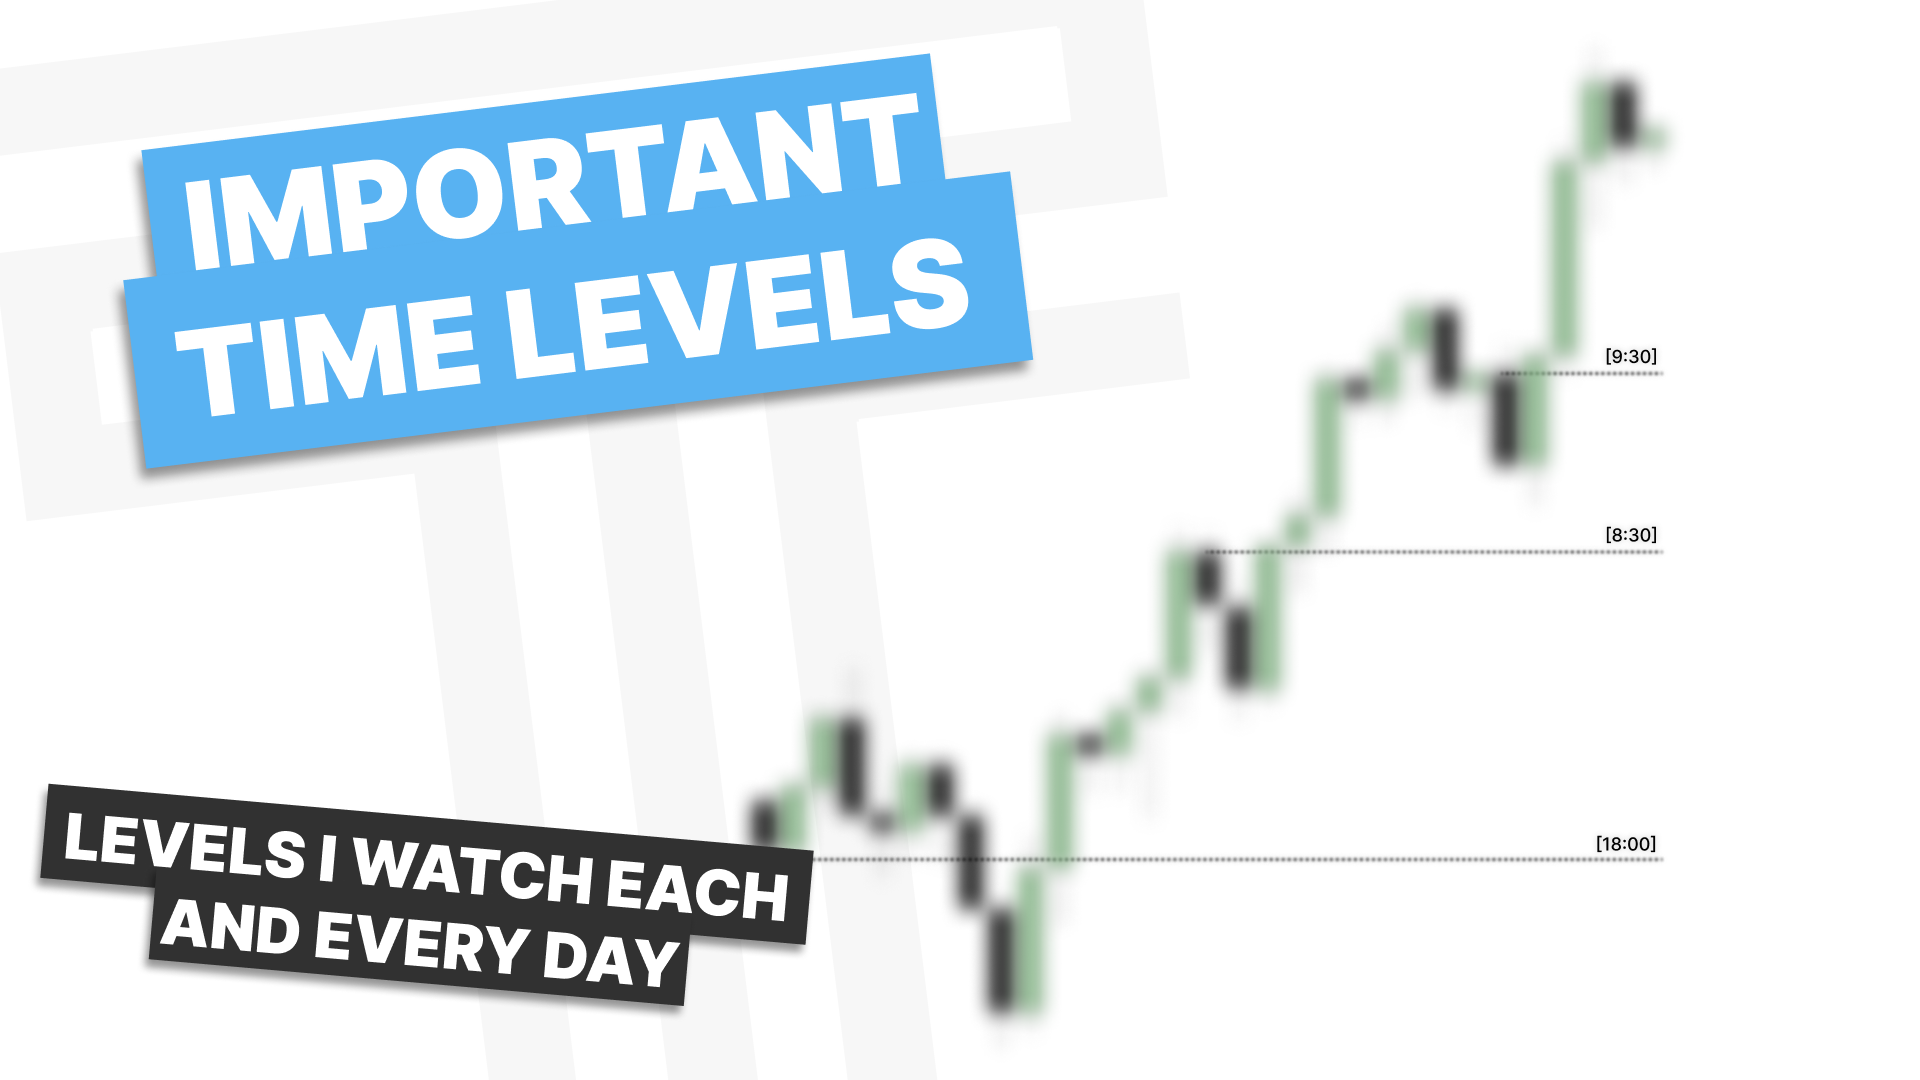
One of the most overlooked aspects of trading is time. Just as price creates structure on the chart, time creates predictable behaviors around certain sessions and candle openings. By aligning your strategy with time-based levels, you can anticipate liquidity grabs, reversals, and continuation moves more effectively.
In this blog, we’ll break down how to use OHLC levels at specific times, treat midnight (0:00) and 8:30 as support and resistance, and recognize opposing runs at 8:30 and 9:30 to refine your trading setups.
Key OHLC Time Levels
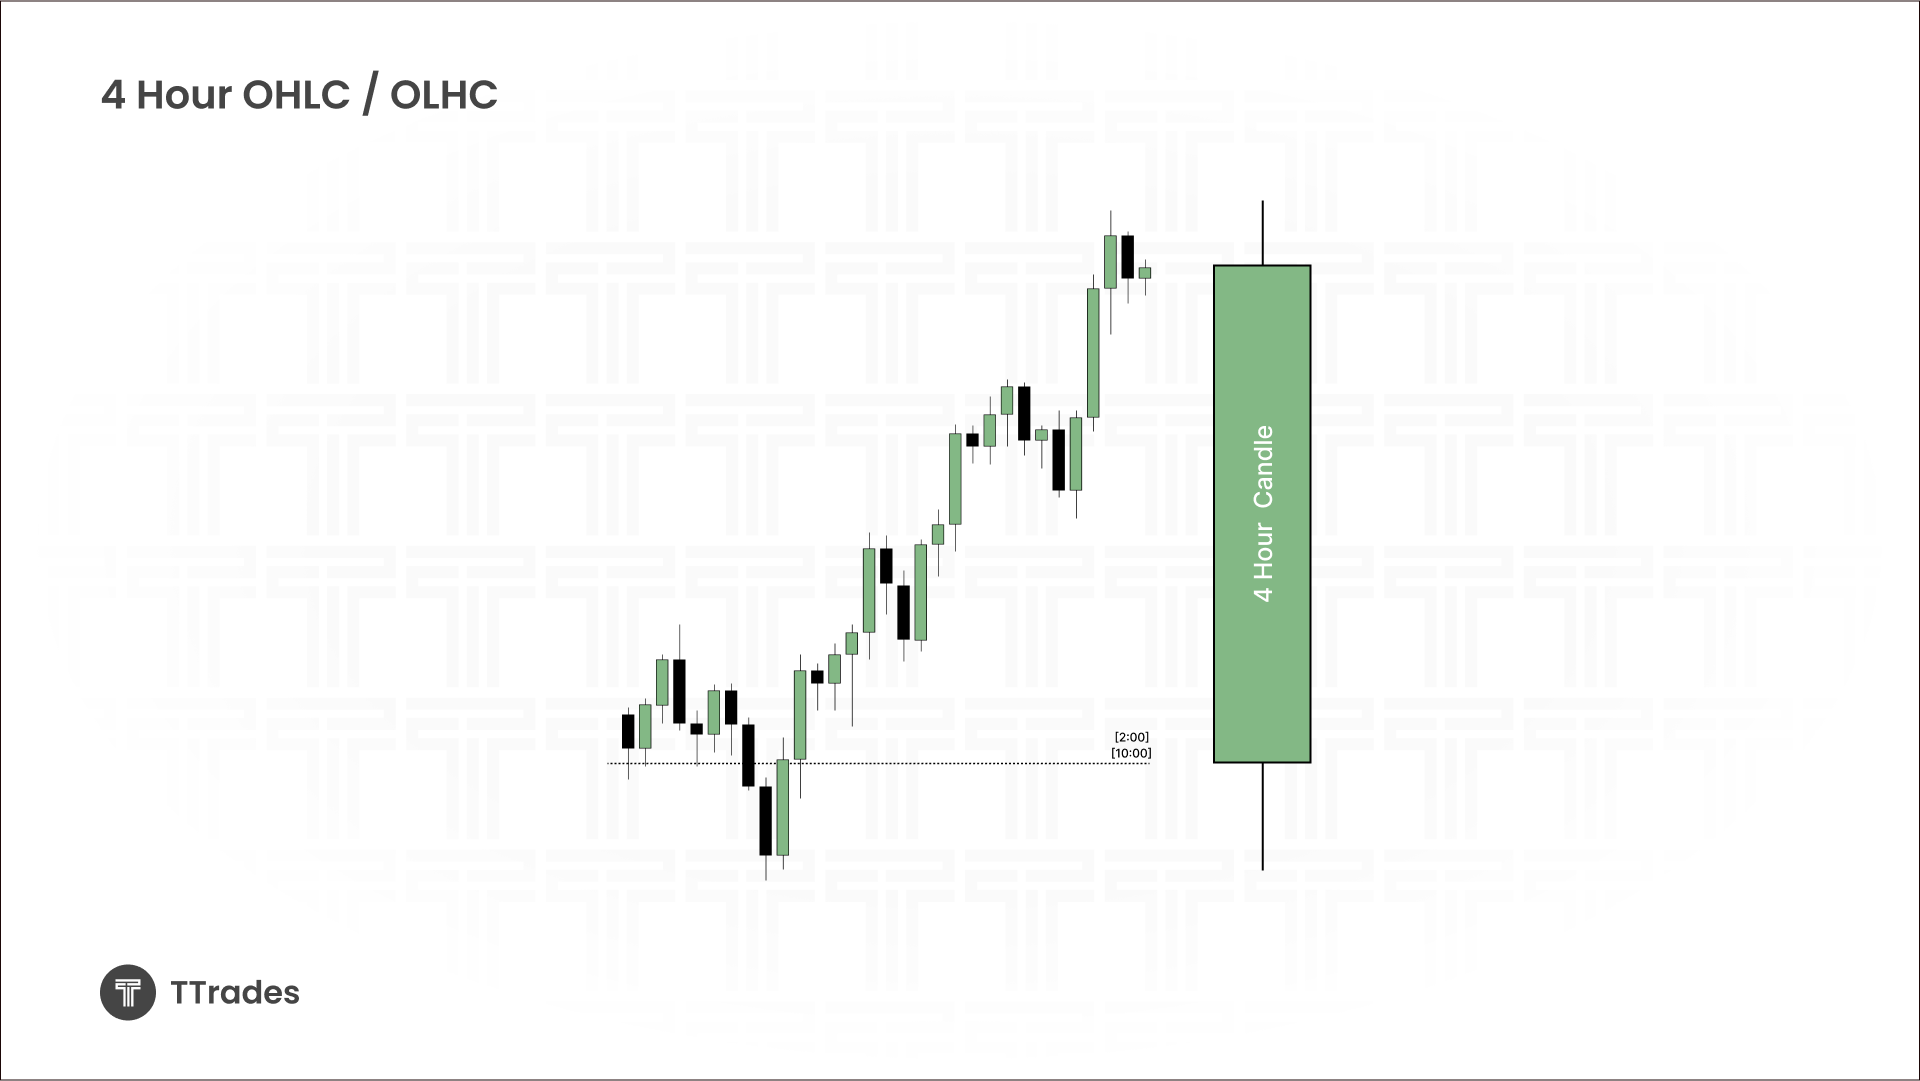
There are specific times during the trading day when new candles open on higher timeframes. These open-high-low-close (OHLC) structures give traders valuable insight into where liquidity and order flow may shift.
The main OHLC times to watch are:
18:00 EST – Daily candle open
02:00 EST – 4-hour candle open
06:00 EST – 4-hour candle open
10:00 EST – 4-hour candle open
14:00 EST – 4-hour candle open
How to use them:
The goal is to let the wick of the daily candle form, thus I am focused on the opposing run from the daily open (18:00) creating that wick.
Each 4-hour open (02:00, 06:00, 10:00, 14:00) provides an intraday structure. Look for the classic pattern: open → low → high → close (bullish) or open → high → low → close (bearish). This helps anticipate how the candle forms.
- Be sure to check out my dedicated video on OHLC for a full understanding of this concept.
Midnight and 8:30 as Support and Resistance
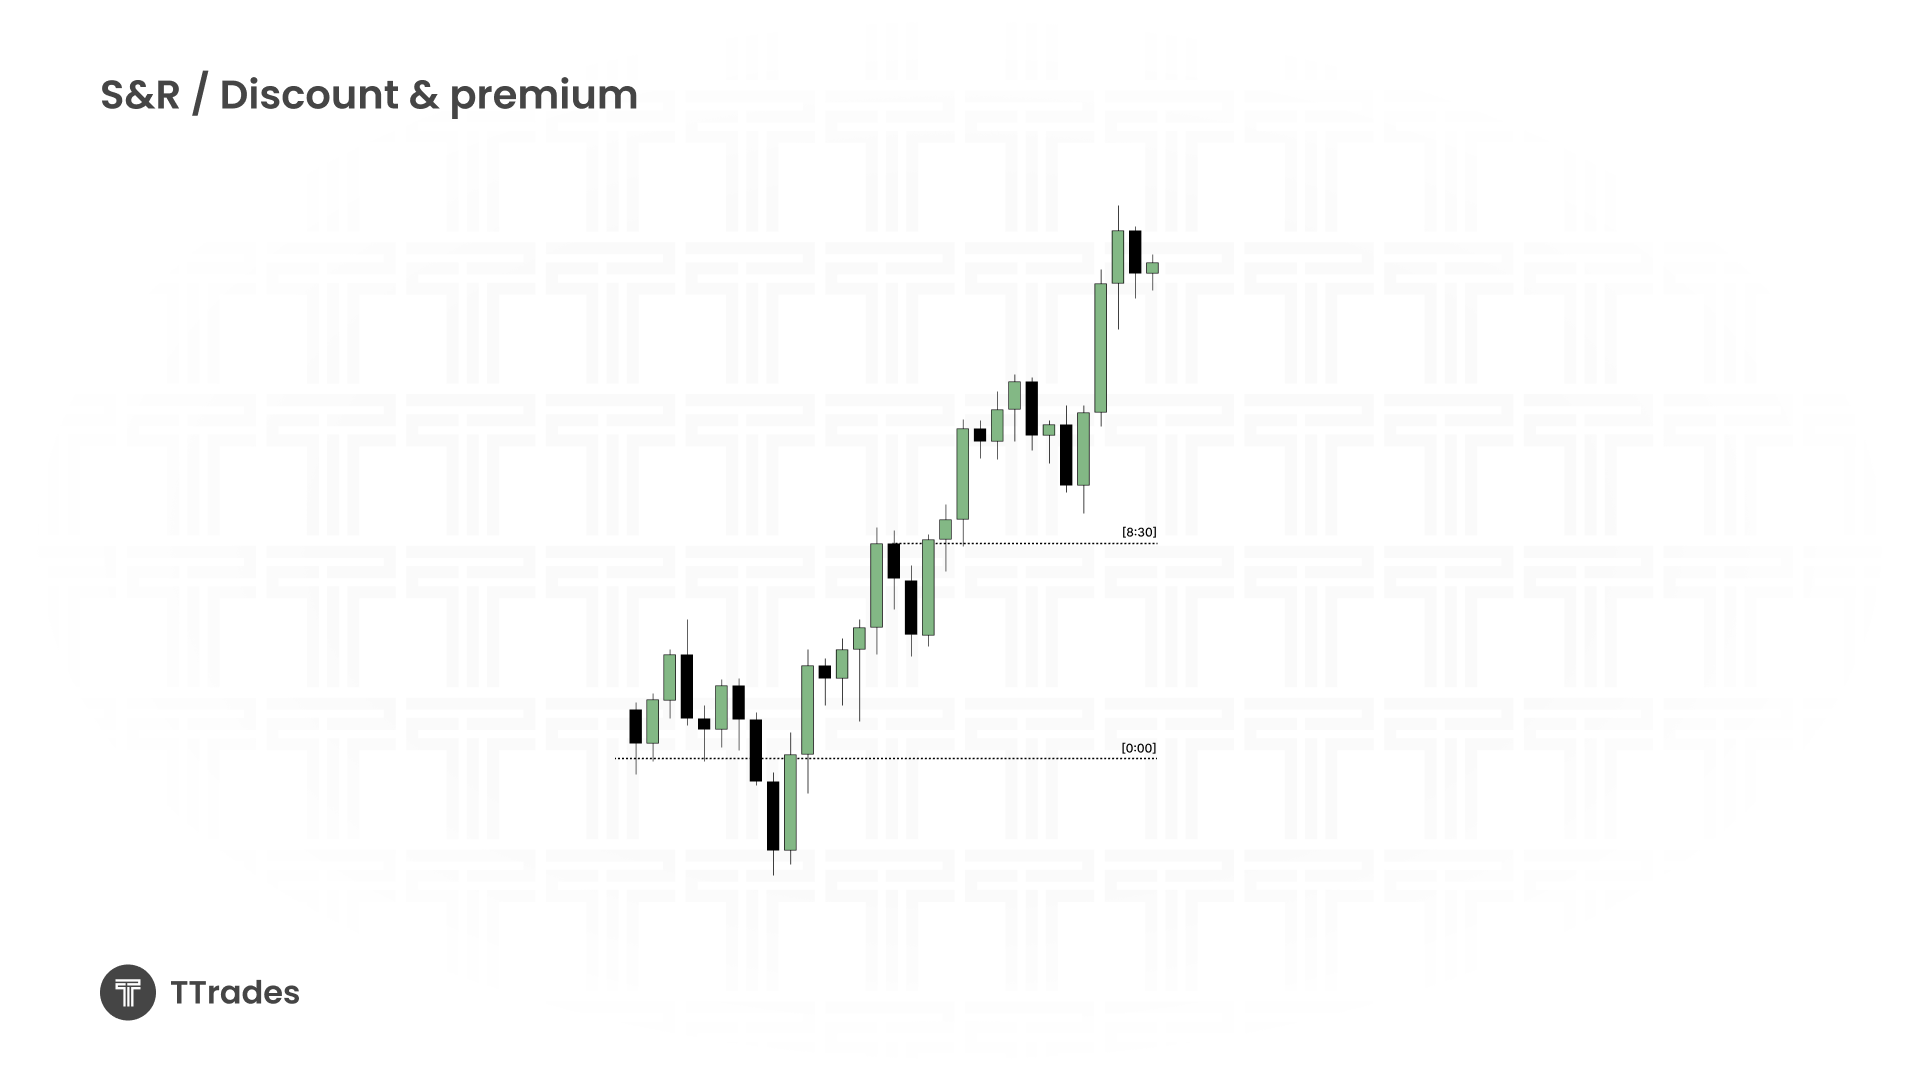
Two additional time levels function less as OHLC structures and more as intraday support and resistance markers:
Midnight (0:00) – The new calendar day open. Often acts as a key level that price will revisit, reject, or use as a pivot for the day’s direction.
08:30 EST – The release time for major U.S. economic data. Price frequently reacts sharply here, making it a strong reference for support/resistance zones.
In practice:
If price trades above midnight and 8:30 levels in a bearish context, this can be viewed as deep premium or a favorable condition for shorting.
If price trades below them in a bullish context, that’s a deep discount, an attractive area for long entries.
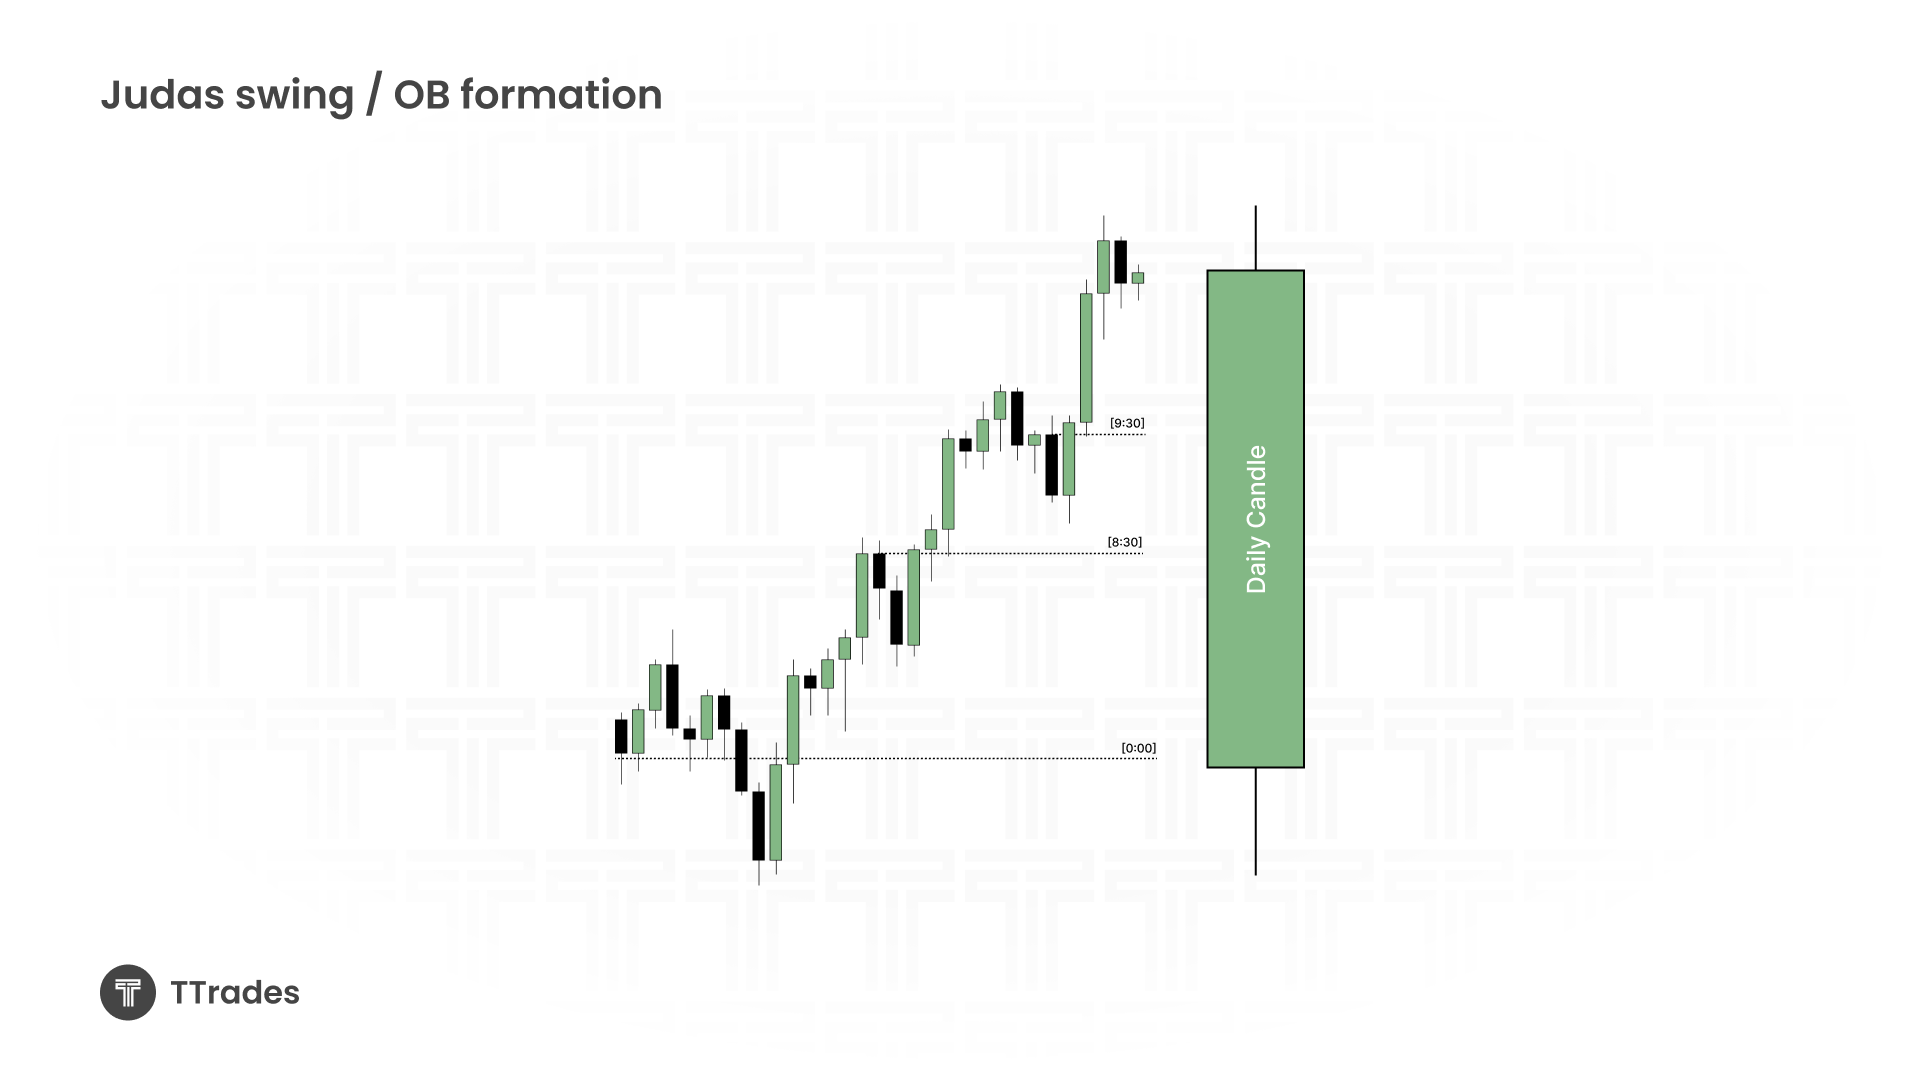
8:30 and 9:30 Opposing Runs
An opposing run occurs when the market makes an “opposing run” in the “wrong” direction before reversing into the real move. This often traps traders.
08:30 EST – News-driven volatility. Expect sudden sweeps of liquidity (highs or lows) before a move back into order flow.
09:30 EST – New York Stock Exchange open. A powerful moment where volatility increases. Often delivers another opposing run, either running stops above/below short-term levels before trending in the opposite direction. Price can also expand if the manipulation or the 8:30 opposing run already occurred.
💡 Pro Tip:
- 8:30 opposing run → 9:30 expansion.
- No opposing run at 8:30 → 9:30 opposing run. 9:30 / 10:00 expansion.
For example:
In a bullish day, you might see 08:30 make a move lower then a sharp reversal higher.
At 09:30, price may expand higher in line with the higher timeframe trend.
Putting It All Together
Here’s how a trader might structure their day using these time levels:
Mark 0:00 and 8:30 as support/resistance reference points.
Track OHLC at 18:00, 06:00, 10:00, 14:00, and 02:00 to anticipate intraday structure.
Watch 08:30 and 09:30 for opposing runs.
By combining these elements, you create a powerful framework: time tells you when liquidity may be taken, OHLC gives you structure for price delivery, and runs provide invalidations.
💡 Pro Tip: Opposing runs create protected swings when reaching into a fair value gap or sweeping out a high (bearish) or low (bullish)
Final Thoughts
Trading is not just about price, it’s about when price makes its moves. By mastering the rhythm of OHLC levels, the power of midnight and 8:30 as support/resistance, and opposing runs at 8:30 and 9:30, you can align yourself with institutional timing and gain a sharper edge in the markets.