When it comes to trading price action, candlestick wicks often hold more information than traders realize. They can signal reversals out of important levels especially when analyzed across multiple timeframes. This guide breaks down the concept of wicks, how to identify when they are respected versus disrespected, and how you can use them to catch higher-probability trades.
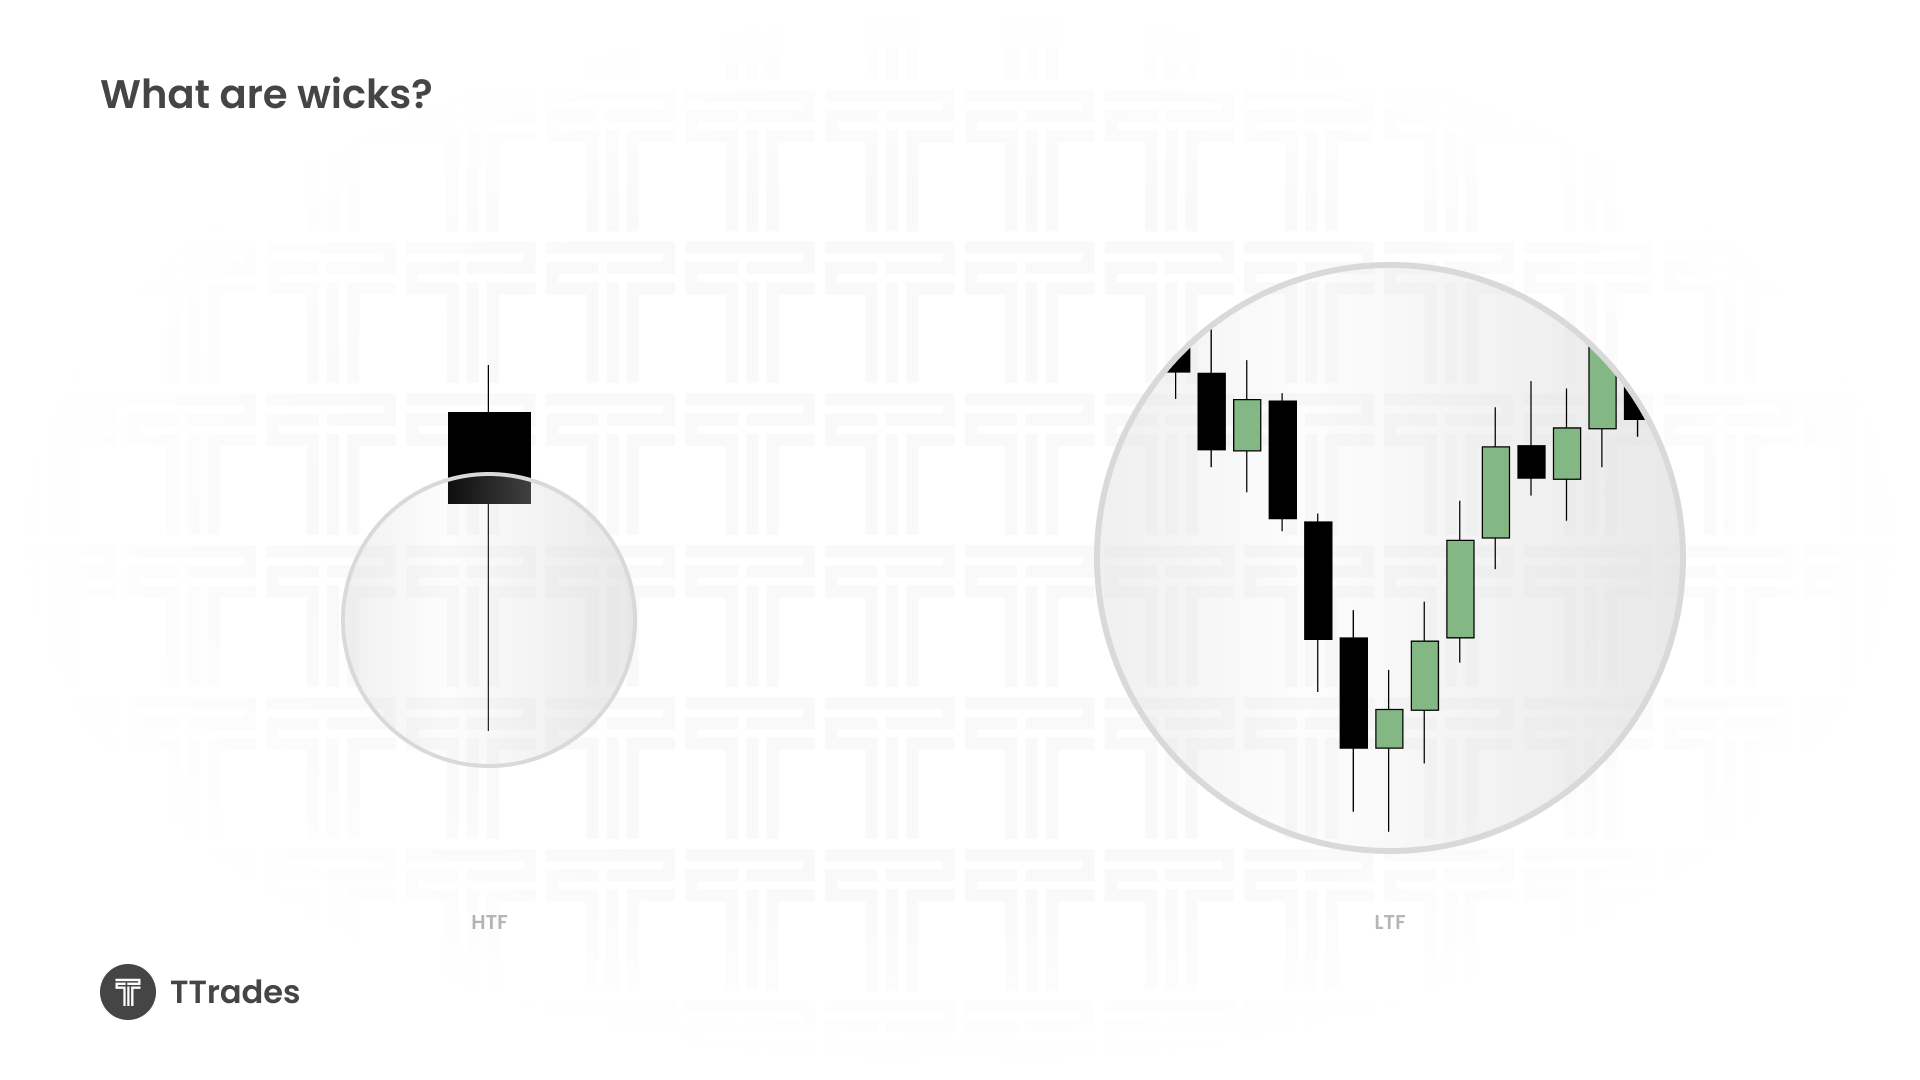
A wick represents a rejection of price during a given time period. On the lower timeframe, wicks show that price aggressively pushed in one direction, only to snap back before closing.
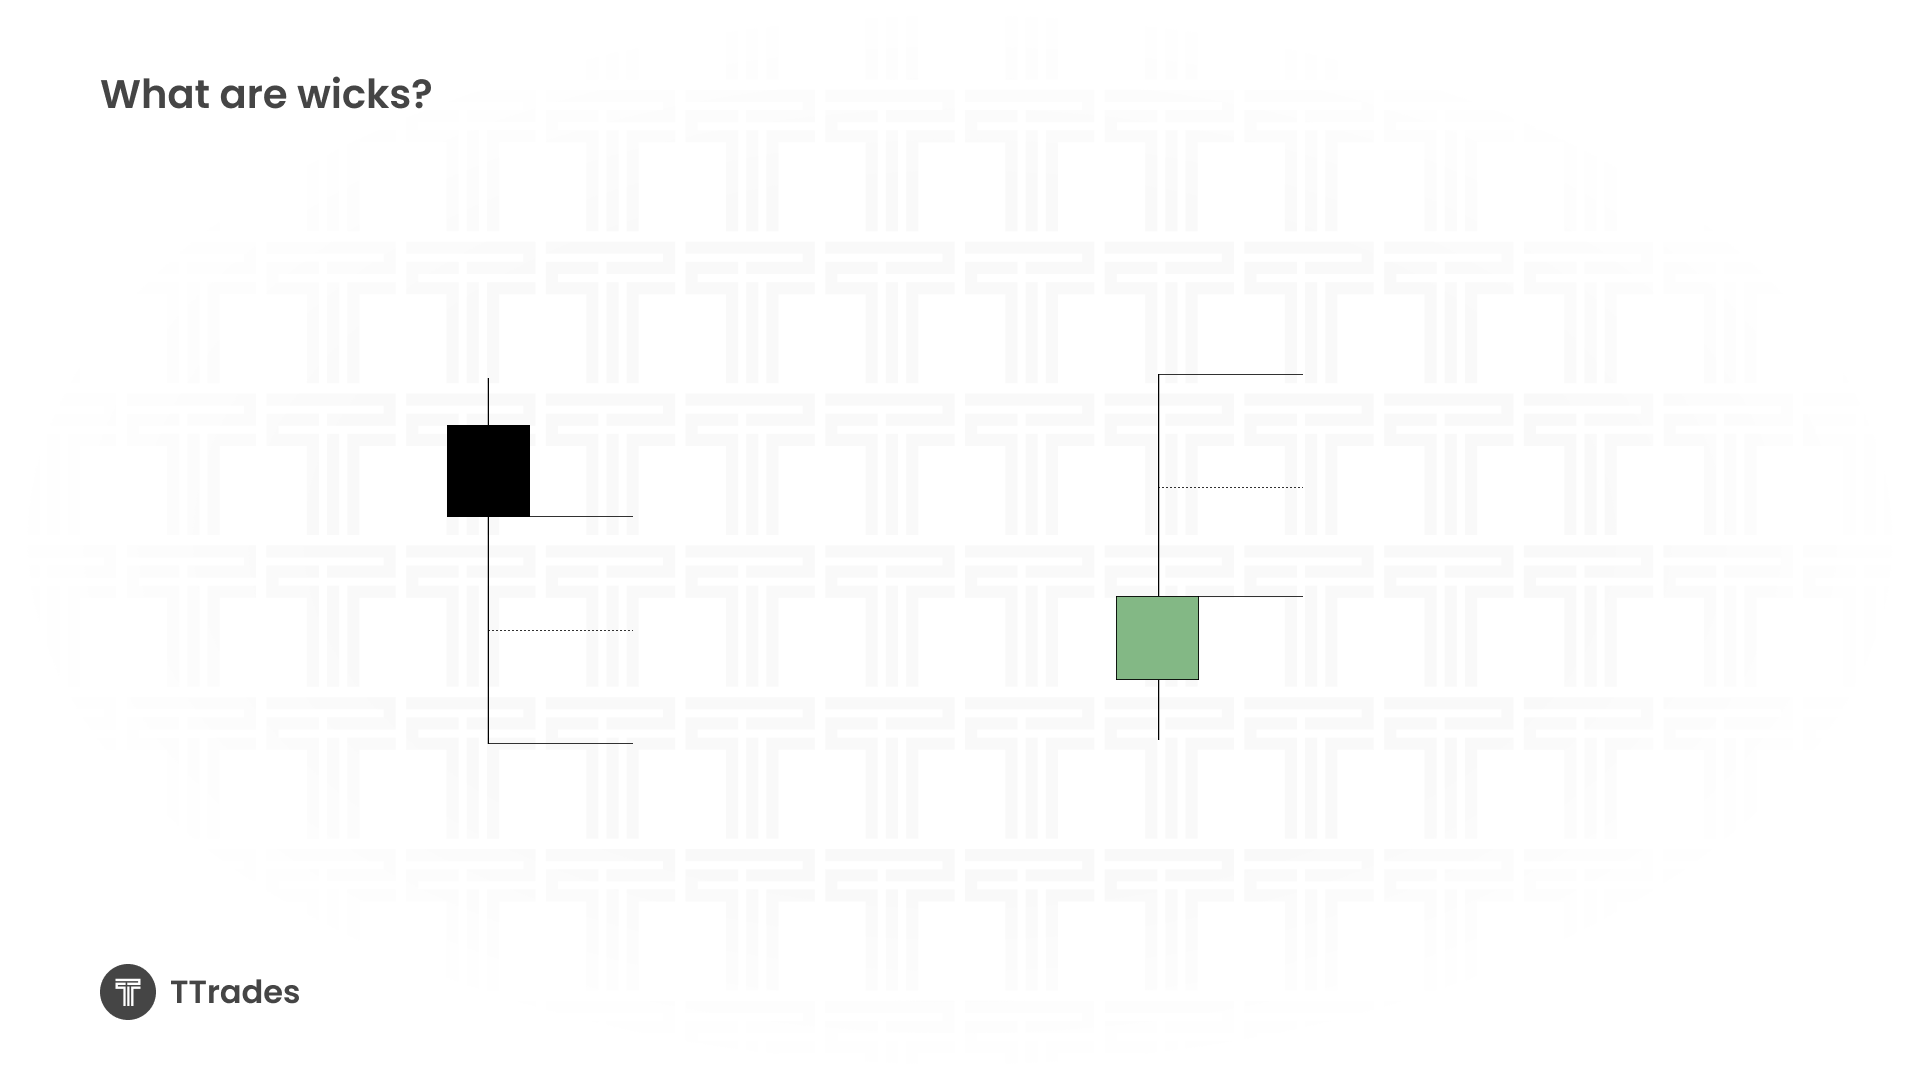
A lower wick means there was an aggressive move lower met with an aggressive move back up. This is signaling a bullish reversal.
An upper wick means there was an aggressive move higher met with an aggressive move back down. This is signaling a bearish reversal.
In essence, wicks are mini-reversals on lower timeframes.
💡 Pro Tip: A good reversal candle (candle with large wick) will have a “V” shape reversal on the lower timeframe.
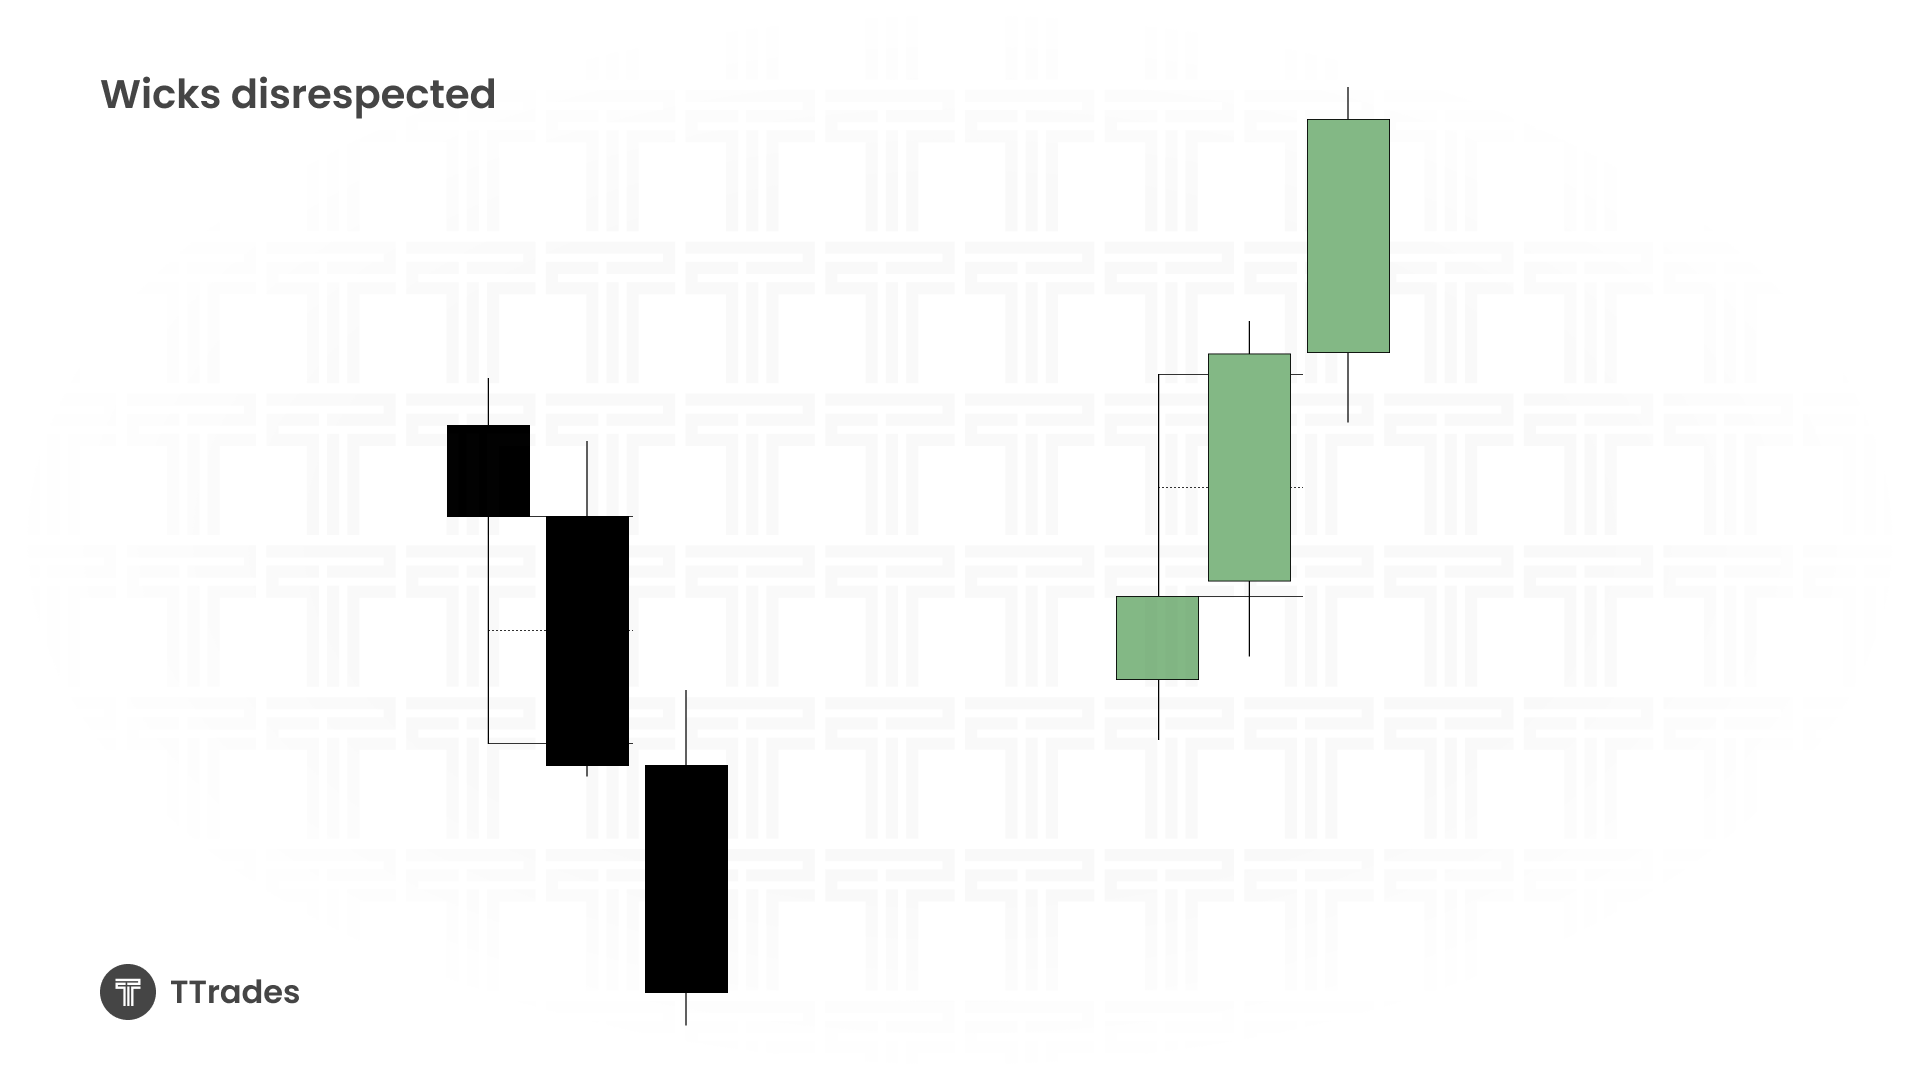
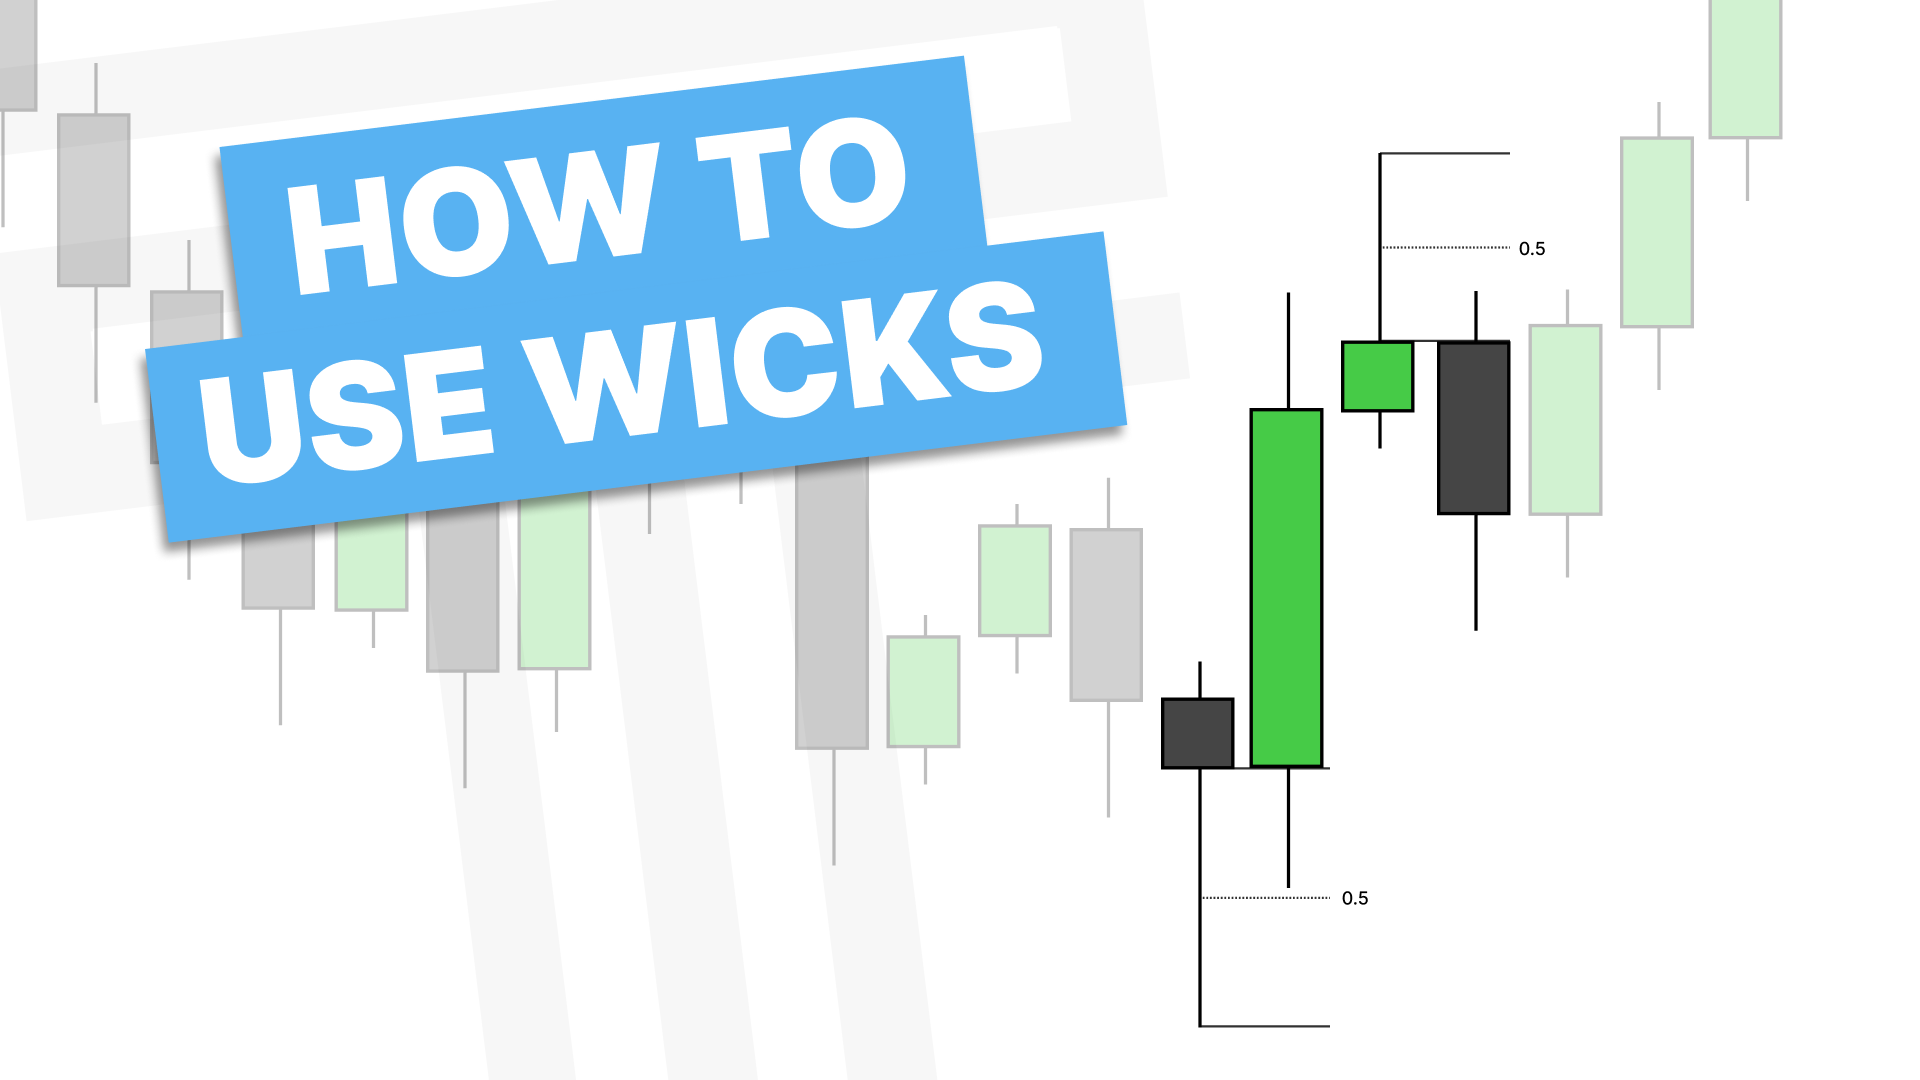
The key concept is the 50% rule of a wick:
Mark the midpoint of the wick (from body to high or body to low).
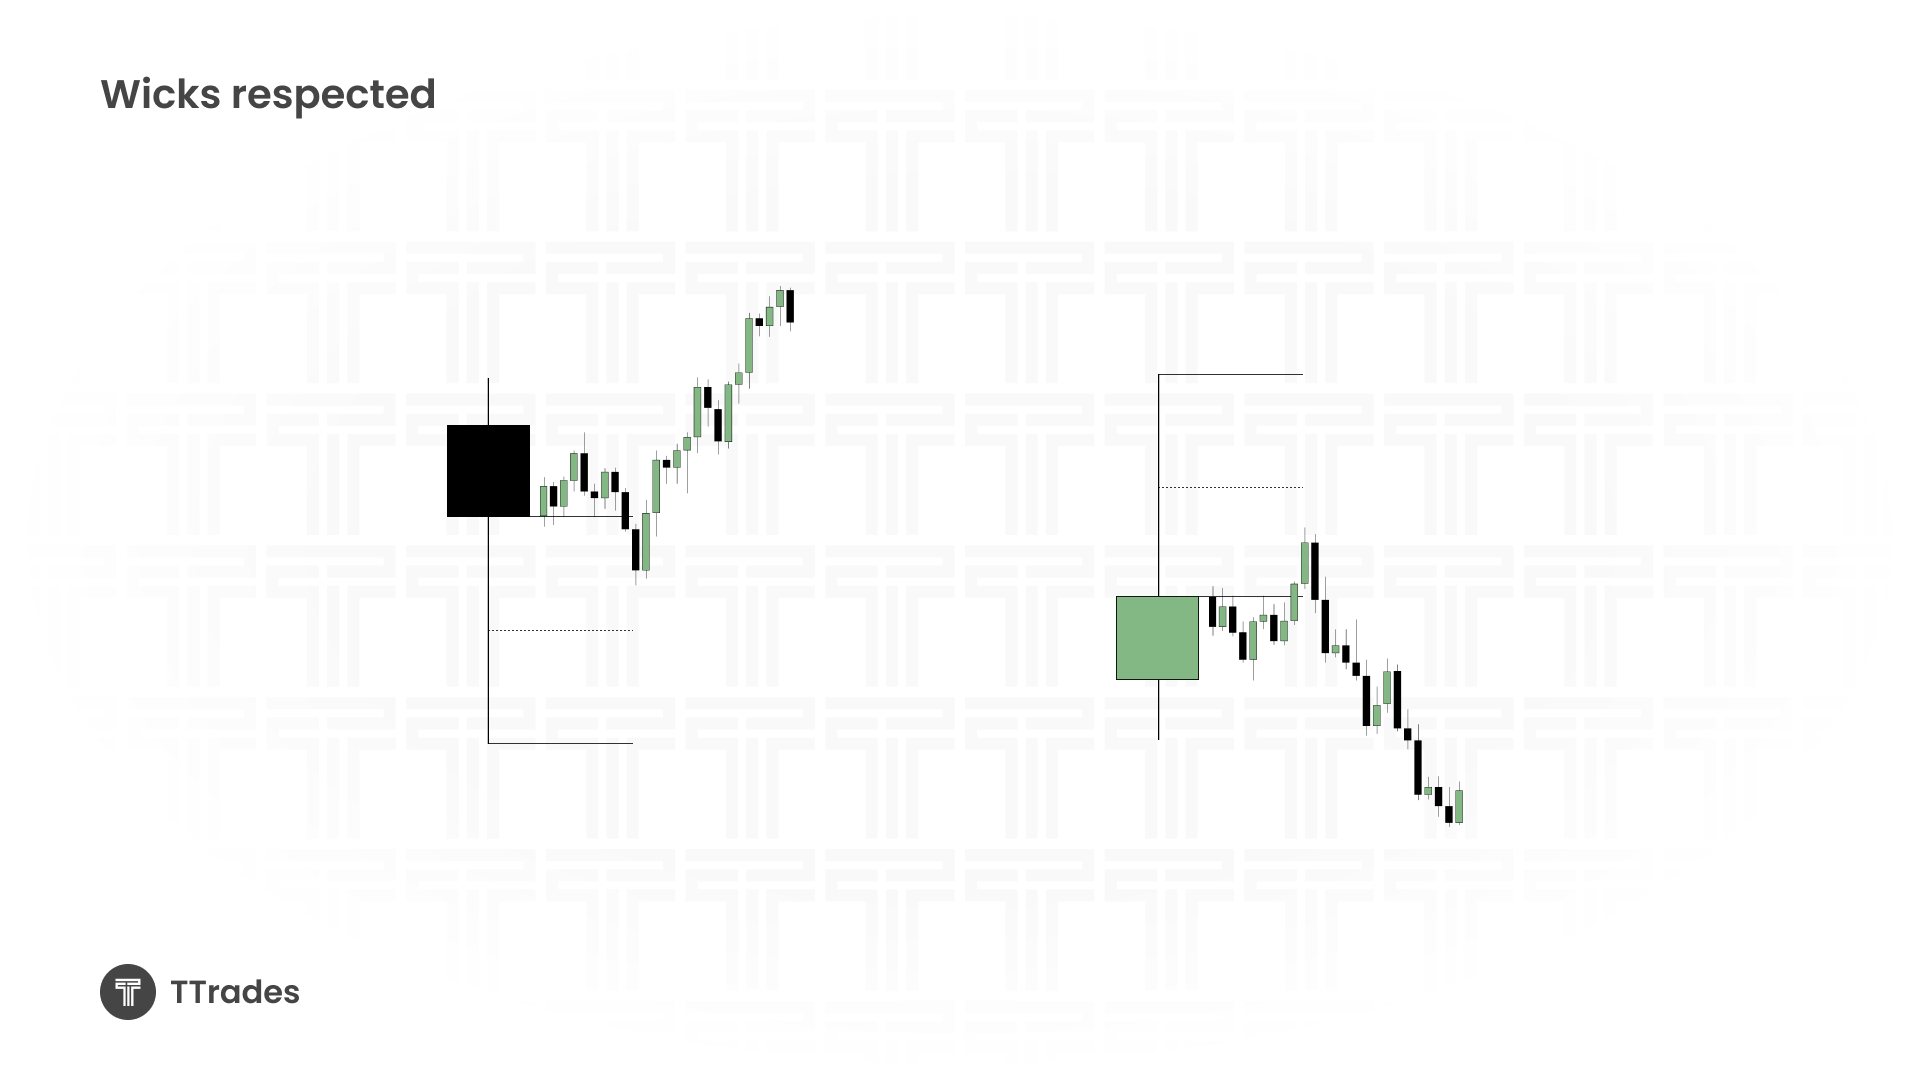
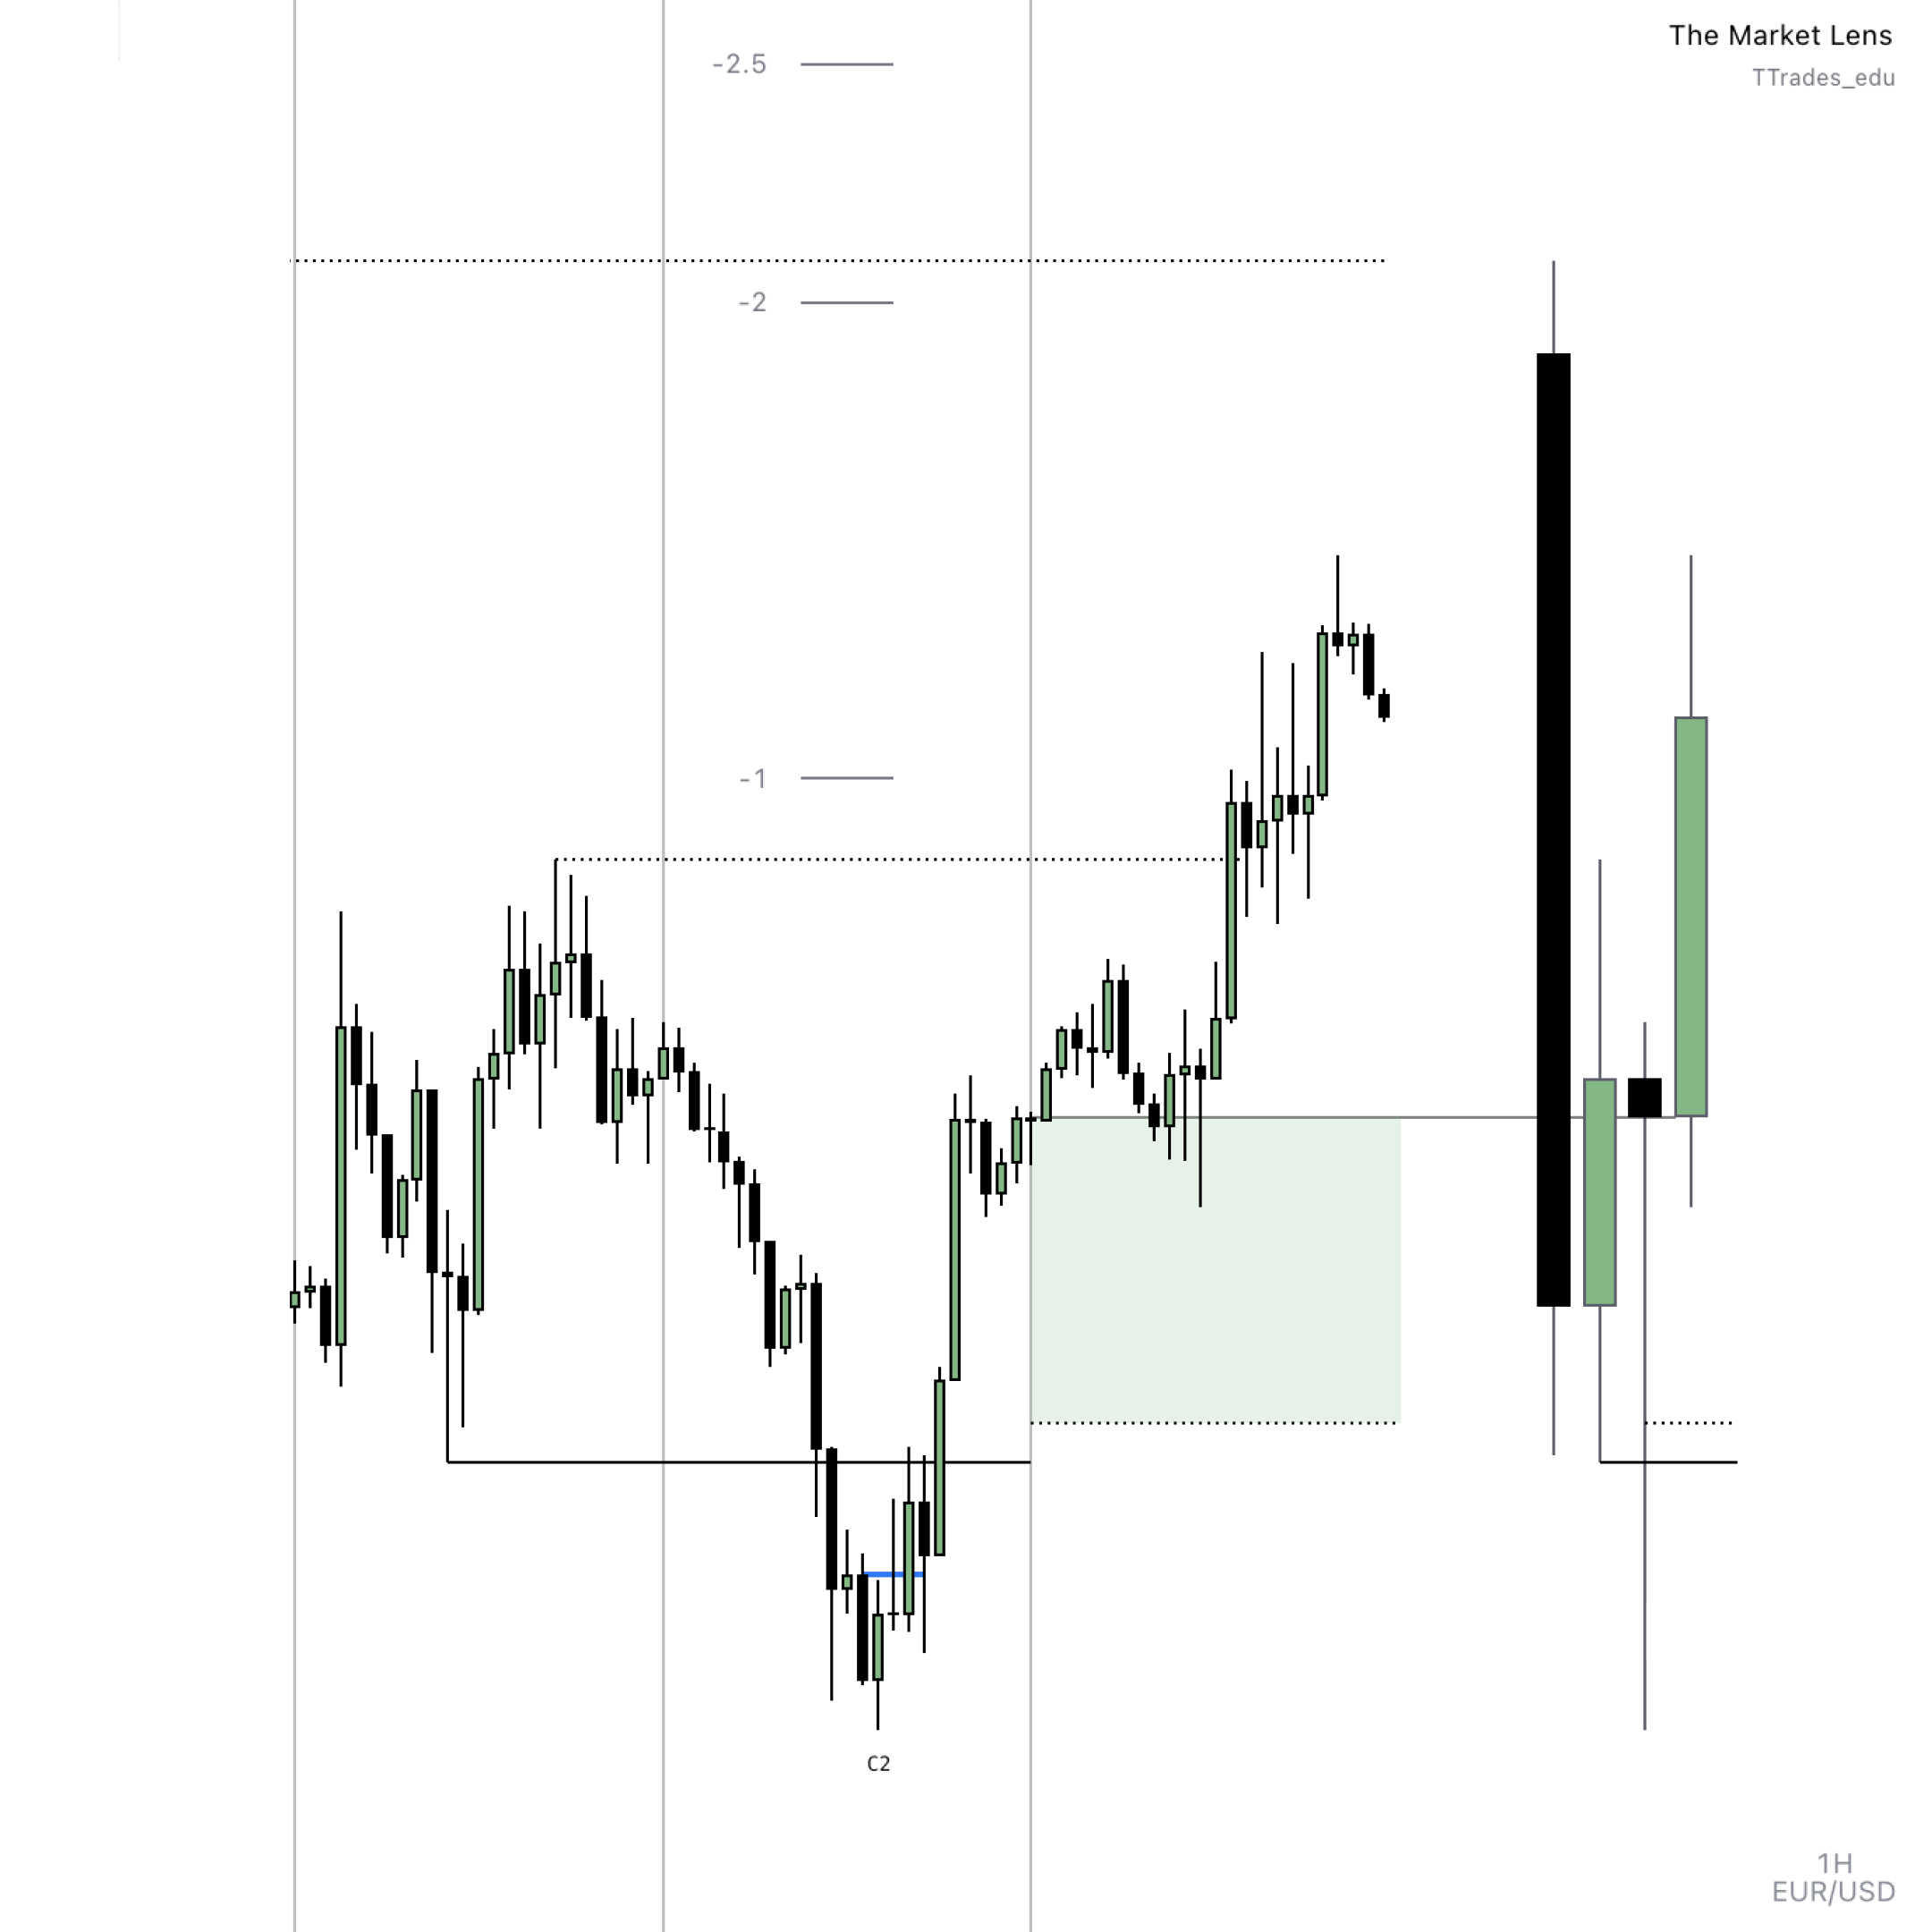
Bullish Reversal Example
💡 Pro Tip: TTrades Fractal Model Indicator, will automatically mark out 0.5 of the wick on reversal candles that meet the criteria.
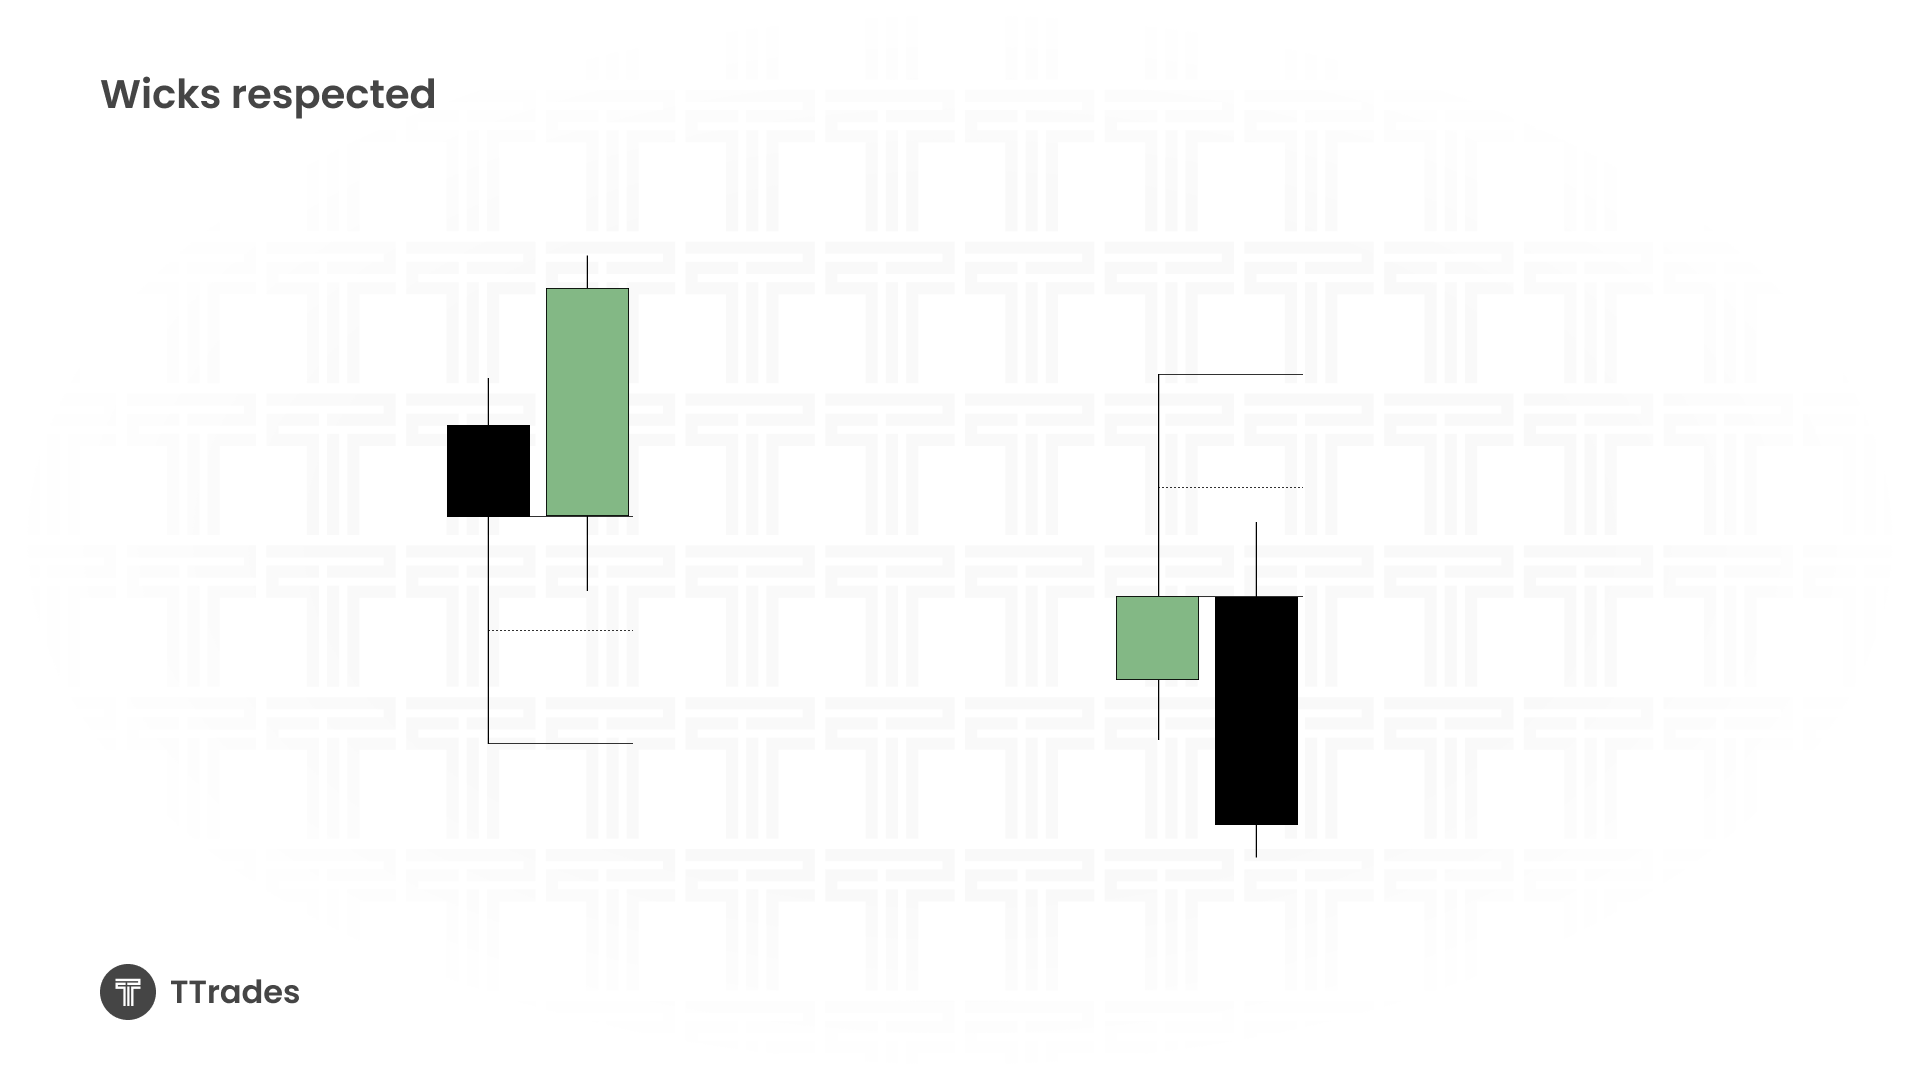
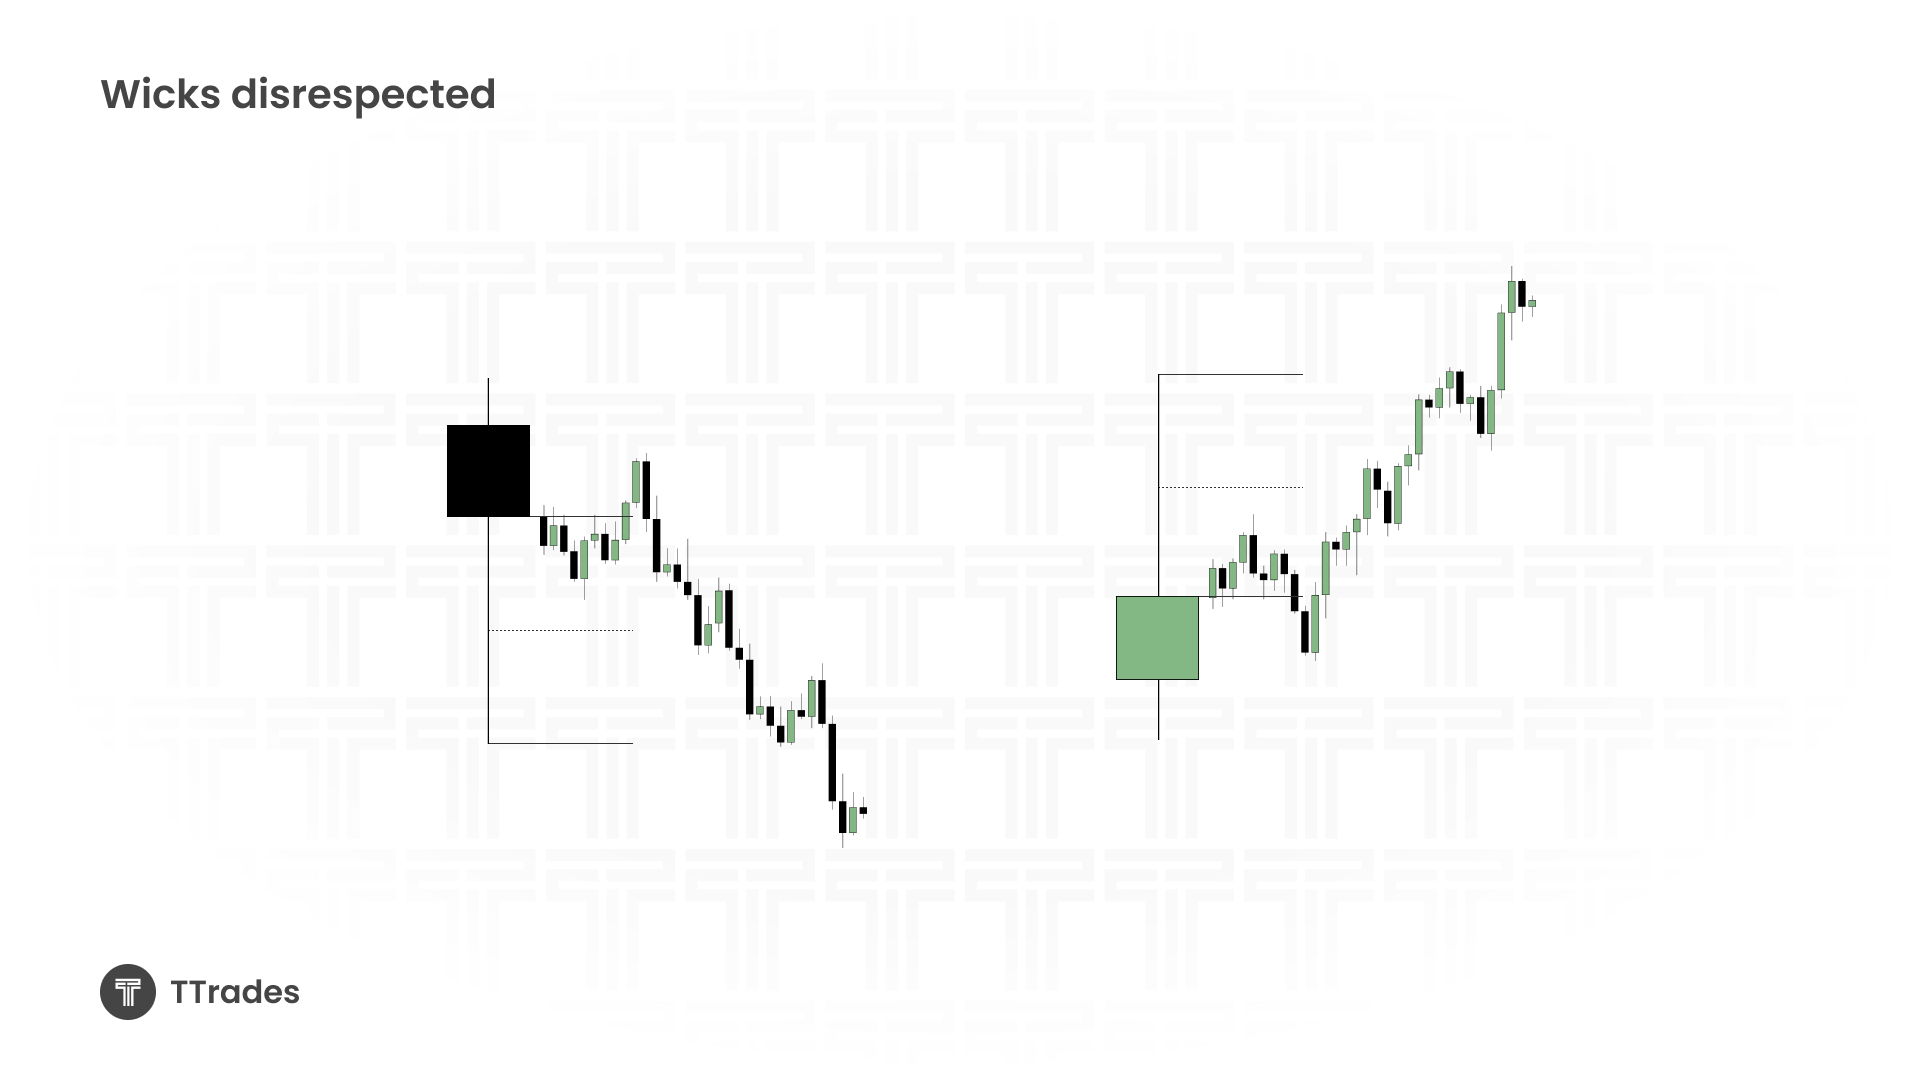
Failed Wick Reversal (Disrespected Wick)
💡 Pro Tip: Focus on wicks that reach into a fair value gap or take out a high or low. Don’t focus on wicks that are internal to the range.
Not every wick will lead to a perfect reversal. Market structure, session timing, and liquidity runs all influence whether a wick becomes a strong signal.
Some considerations:
Consolidation: Wicks inside choppy ranges are less reliable.
Liquidity sweeps: Wicks that take out highs/lows before reversing often carry more weight.
Time of day: Session opens (London, New York) often see wick-based reversals.
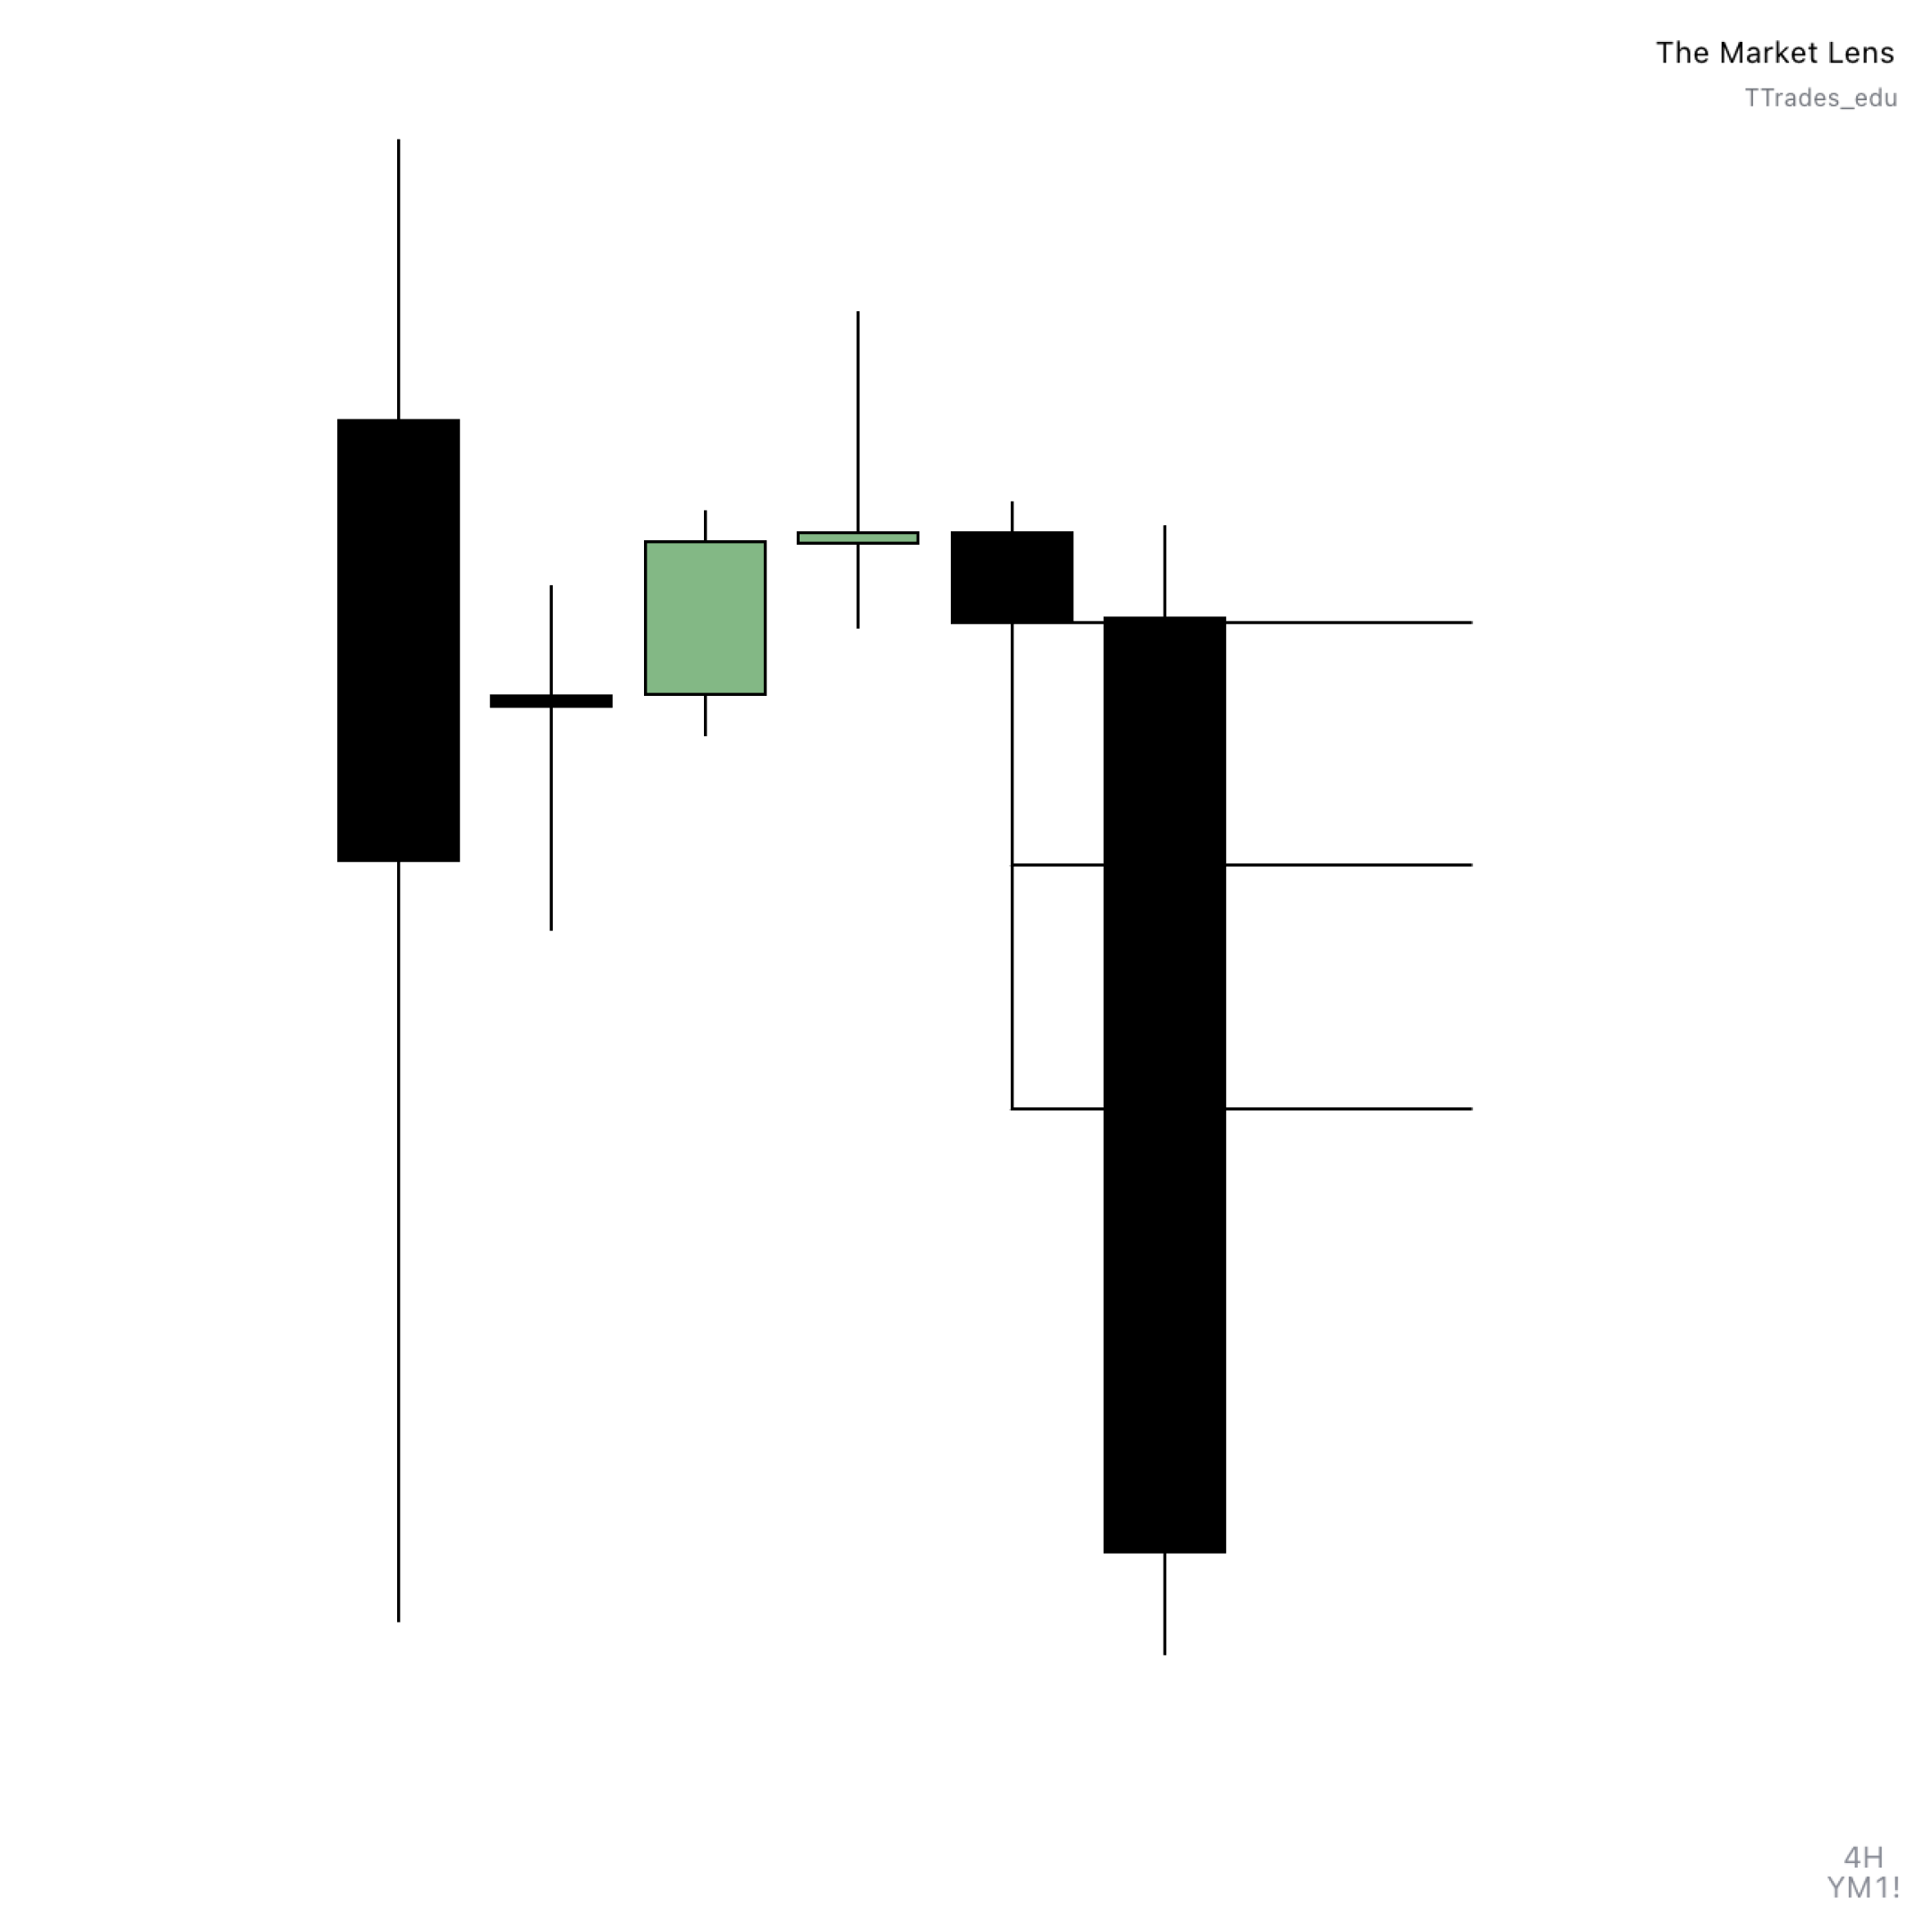
Mark out 50% of significant wicks on higher timeframes.
Drop down to lower timeframes to confirm whether price respects or disrespects them.
Use wick zones as potential entry triggers, stop-loss placements, or take-profit targets.
Always pair wick analysis with overall market bias and structure for higher accuracy.
Wicks are more than simple extensions on a candlestick. They reveal moments where the market tested a level but could not hold it, leaving behind valuable clues for traders. By understanding when wicks are respected or disrespected, you can sharpen your entry timing, filter out weak signals, and position yourself for higher-probability setups. While wick analysis is never flawless, combining it with broader market context makes it a reliable tool in a trader’s decision-making process.

We use cookies to improve your experience. Without them, some site features may not work as well.
We use cookies to improve your experience. Without them, some site features may not work as well.