Introduction
In this lesson, we’re breaking down how to identify important liquidity levels and why understanding their location is critical for framing bias, entries, and targets. This concept builds directly on kill zones and session timing. If you’re already familiar with those, this will help connect everything together. We’ll walk through how candles behave, how higher timeframe highs and lows act as liquidity magnets, and how session ranges can be used to structure trades throughout the day.
The Three Things a Candlestick Can Do
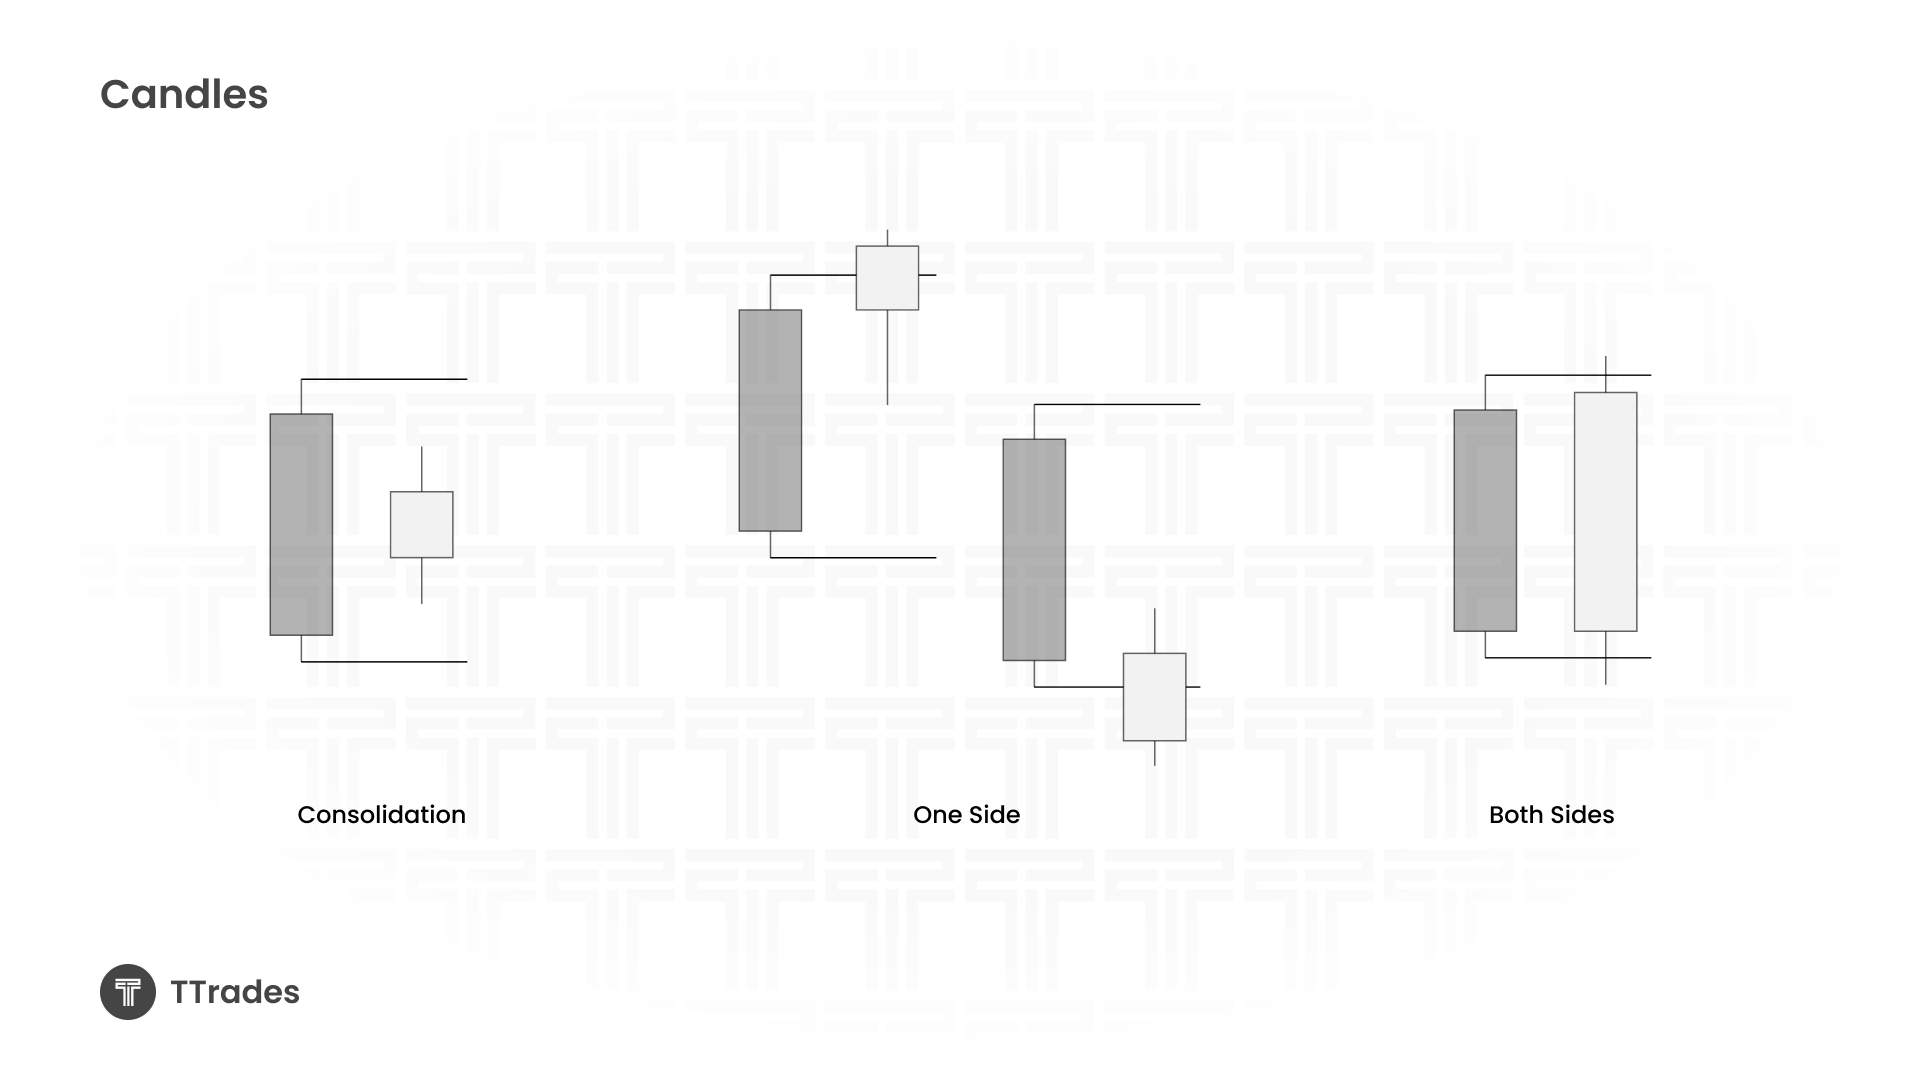
Every candlestick only has three possible behaviors. Once you understand these, price action becomes much easier to read.
The first is consolidation.
This happens when a candle fails to take out the previous candle’s high or the previous candle’s low. In this situation, price is balanced and ranging, and liquidity on both sides remains untouched.
The second is taking one side of the range.
Here, price reaches either buy side liquidity above a previous high or sell side liquidity below a previous low, but not both. This usually results in a directional candle and gives insight into short term intent.
The third is taking both sides of the range.
In this case, price runs both buy side and sell side liquidity within the same candle. These candles are often associated with stop runs, manipulation, or transitions between phases.
If price is not consolidating, it is reasonable to anticipate price reaching for a previous high, a previous low, or in some cases both.
Why Previous Highs and Lows Matter
Liquidity naturally pools above highs and below lows. Because of this, price is constantly being drawn toward these areas unless it remains in consolidation.
Marking highs and lows across multiple timeframes helps frame draws on liquidity, anticipate reversals, and maintain directional bias. These levels act as reference points rather than predictions.
Previous Month’s High and Low
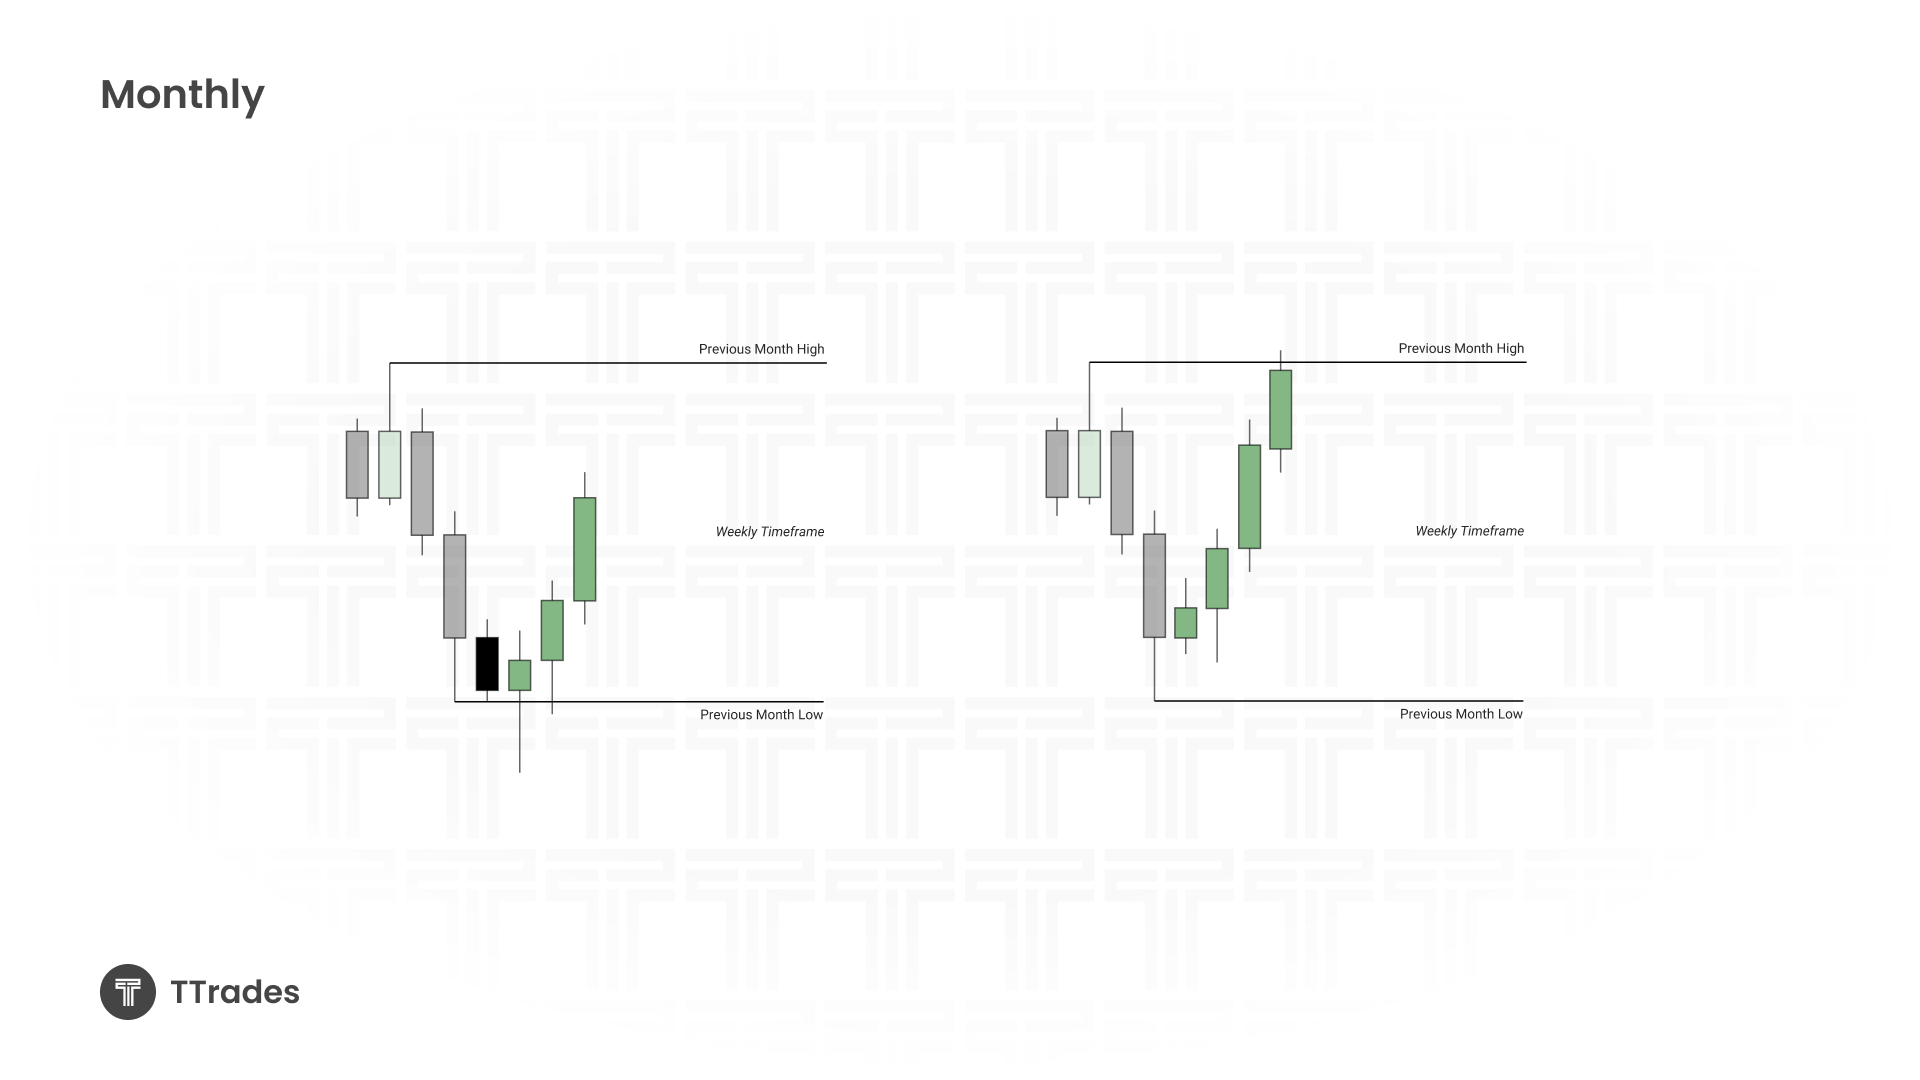
On the monthly timeframe, previous highs and lows act as major liquidity anchors.
Price often reaches a previous month’s low and reacts or reverses, reaches a previous month’s high before rejecting or continuing, or uses these levels to define the next month’s range. Unless price is consolidating, it is typically seeking one side of the prior month’s range.
Previous Week’s High and Low
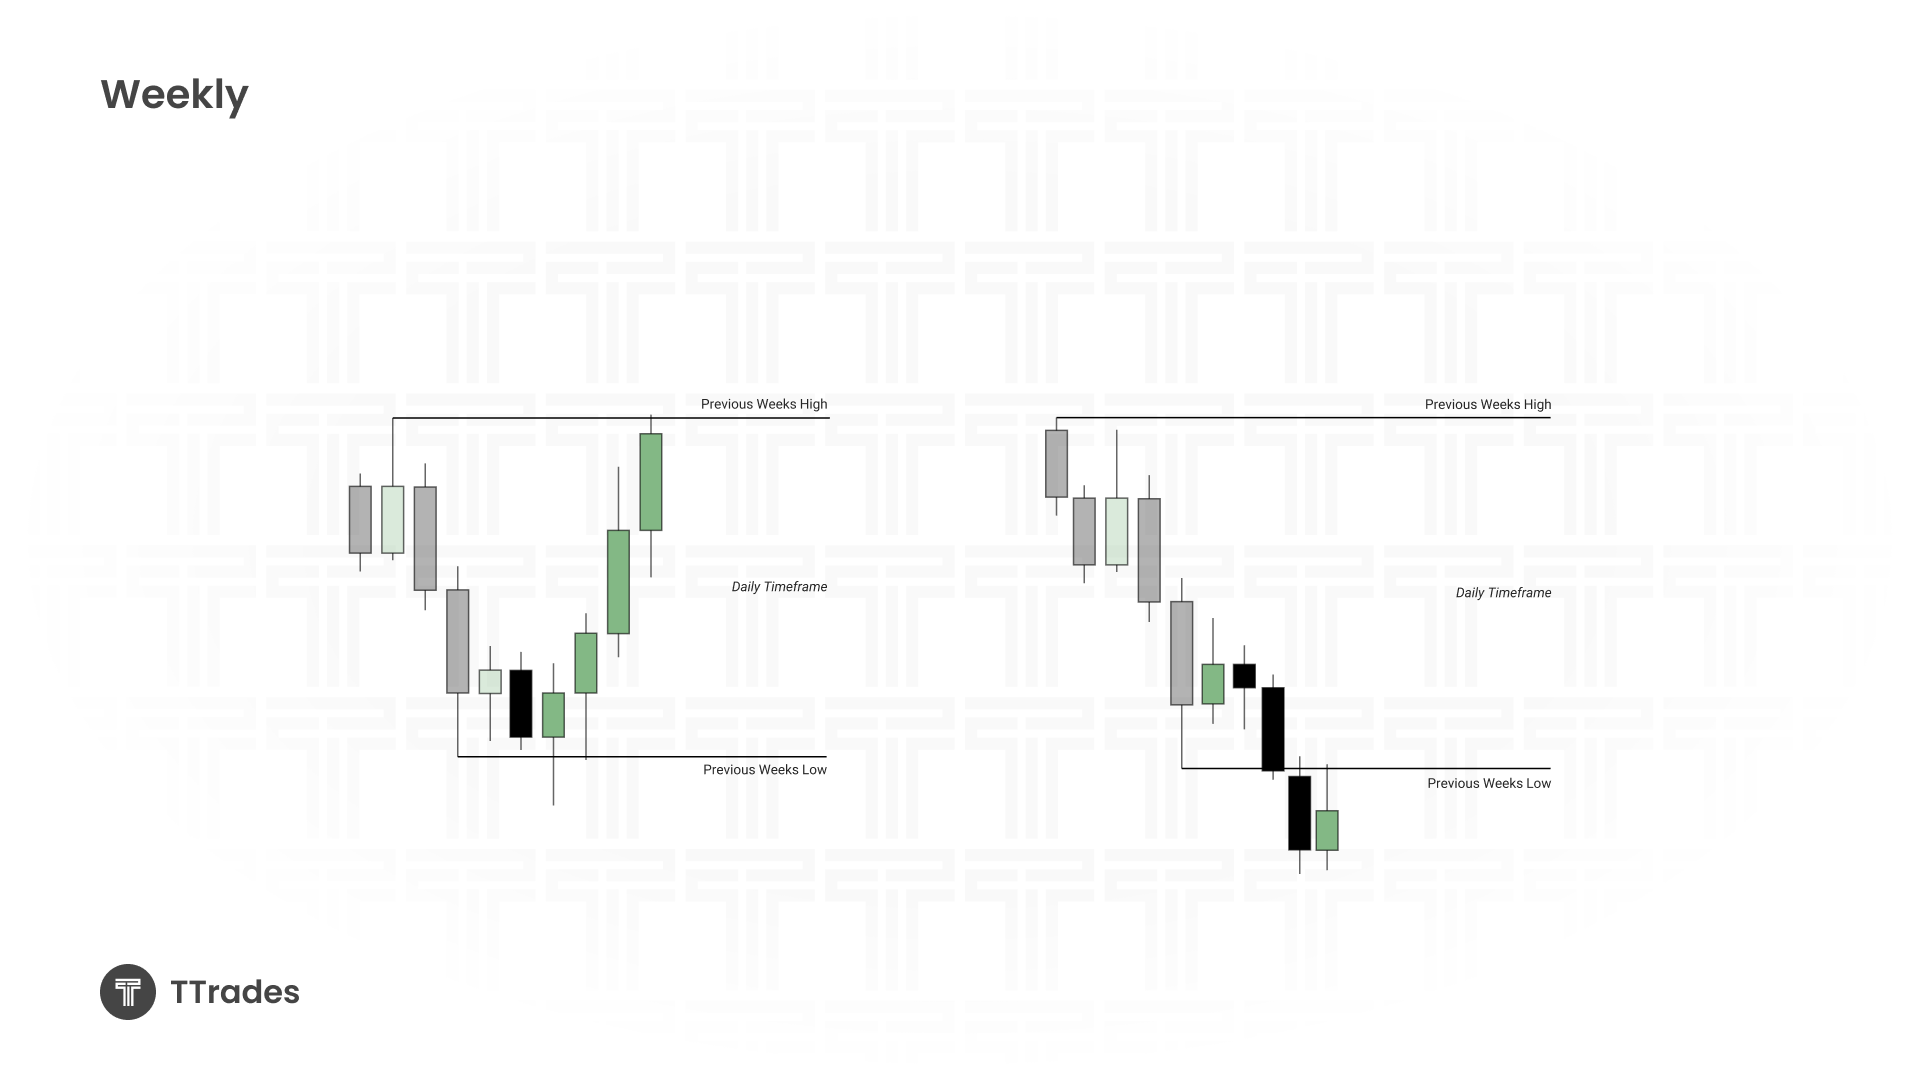
The same idea applies on the weekly timeframe, but with more frequent interaction.
Weekly highs and lows are useful for framing intermediate term bias, identifying weekly reversals, and determining whether price is expanding or balancing. When price displaces and closes beyond a weekly level, it often signals continuation toward the opposite side of the range.
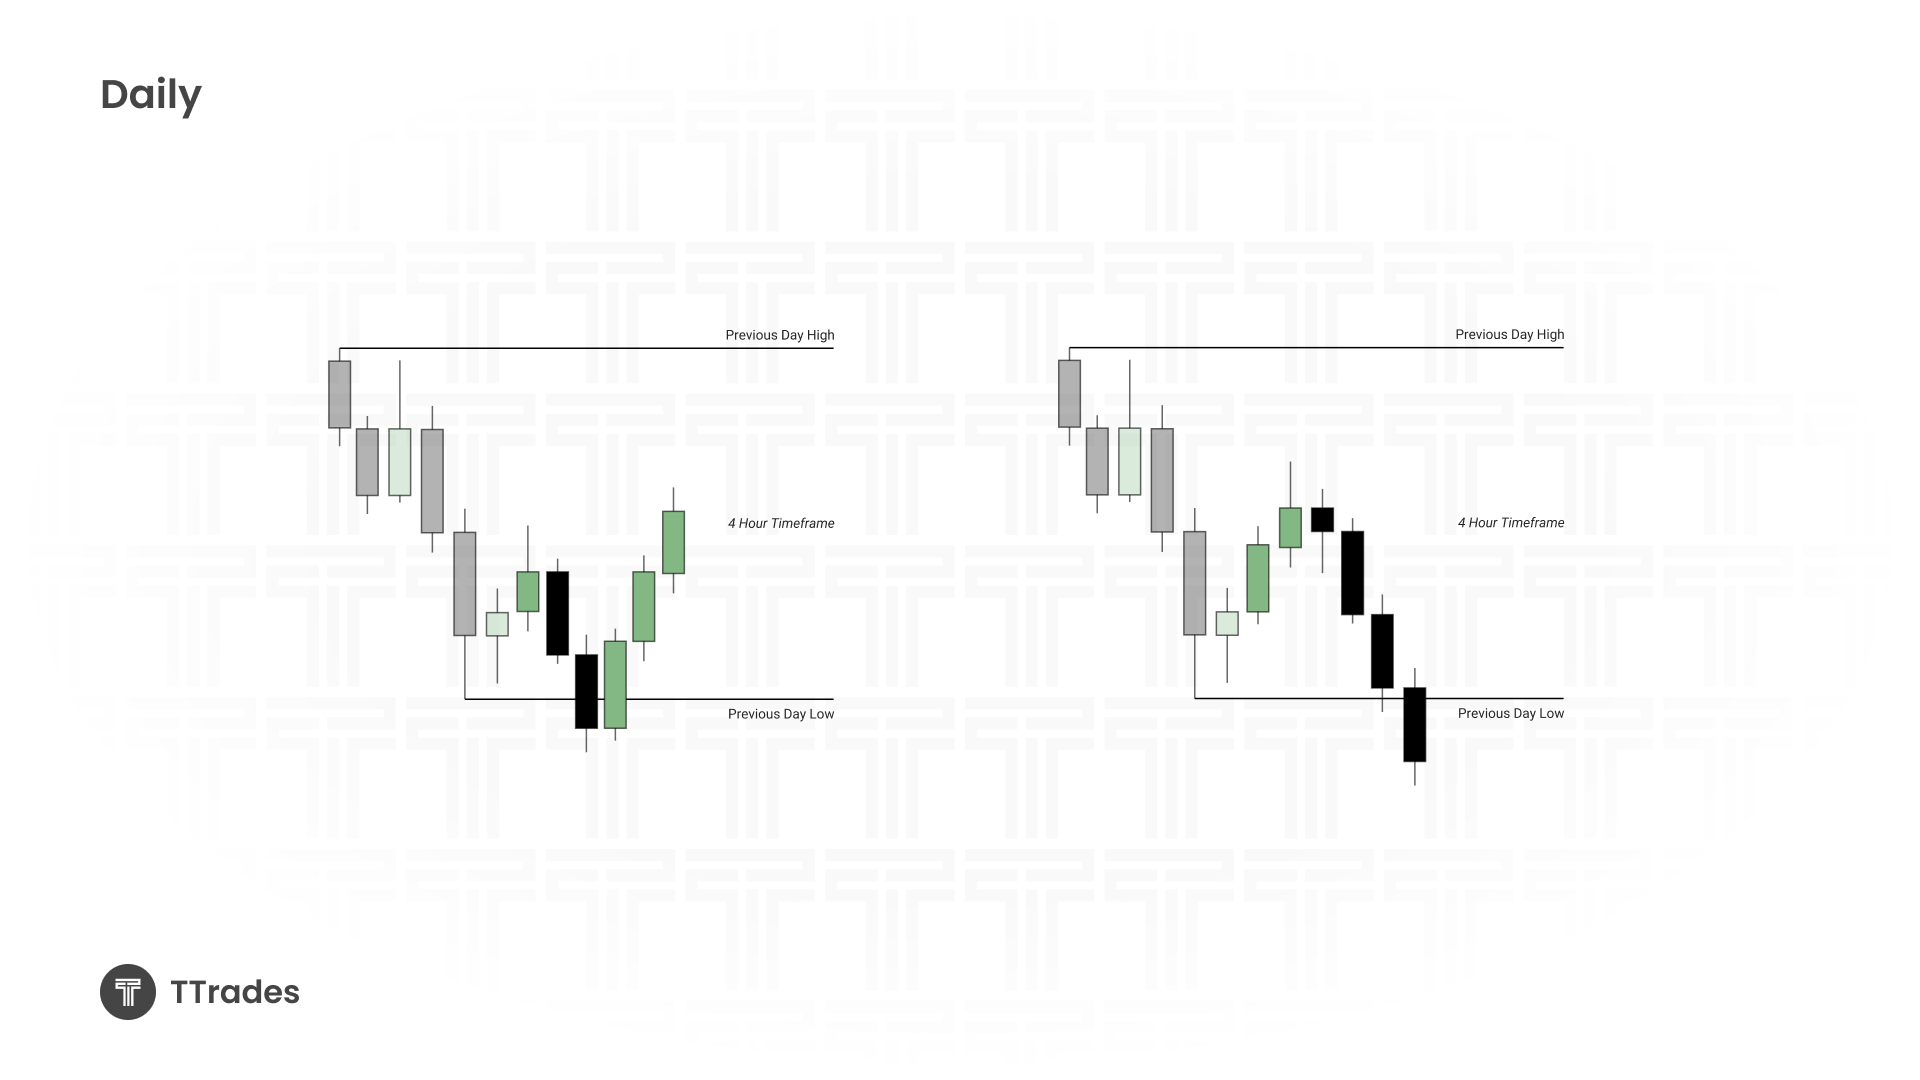
Previous Day’s High and Low
Previous day highs and lows are some of the most practical liquidity tools for intraday trading.
They are frequently used as intraday targets, stop run zones, and reversal points. In trending conditions, price often draws toward one of these levels. When price sweeps one side and fails to continue, that failure itself provides valuable information.
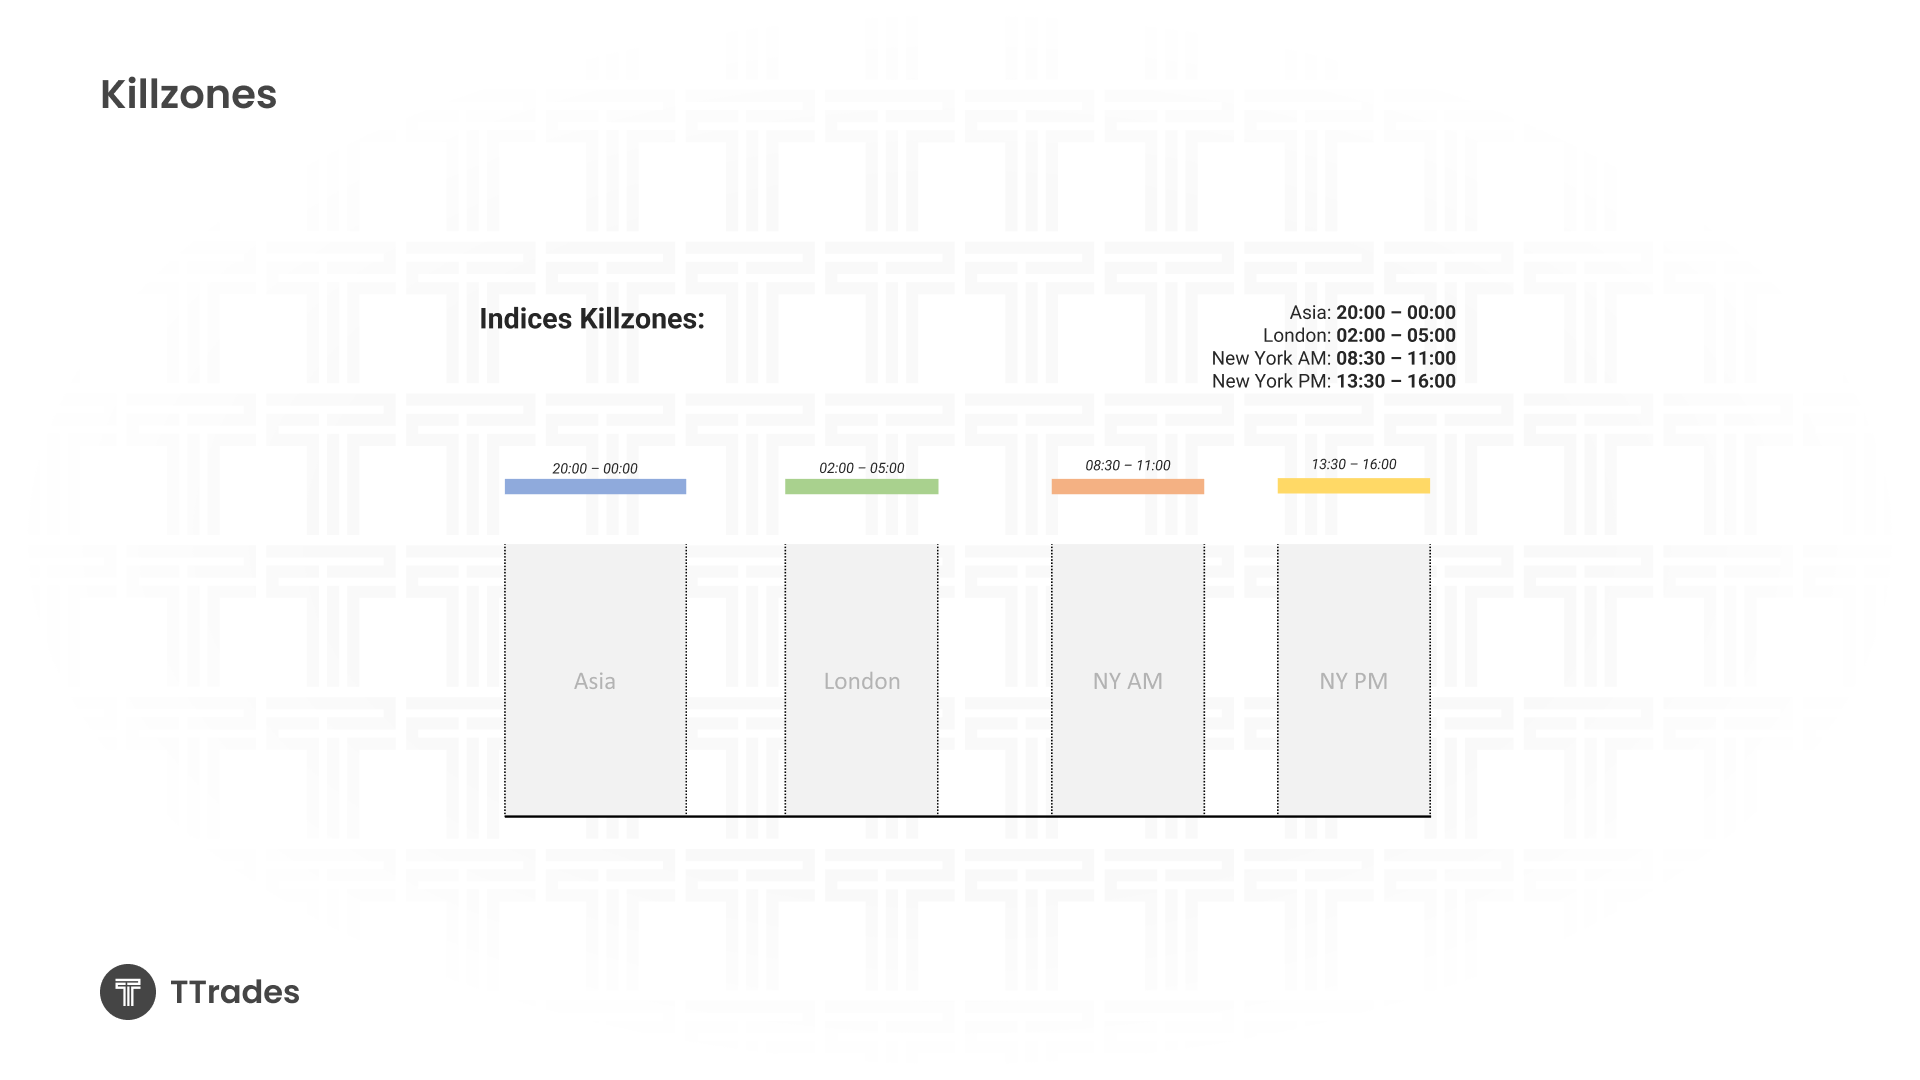
Understanding Session Liquidity
Before using session liquidity, it’s important to know when the sessions occur. For indices, the focus is typically on the Asia session, the London session, and the New York AM session.
Each session forms its own high and low. Once formed, these levels can be used later in the day as liquidity references.
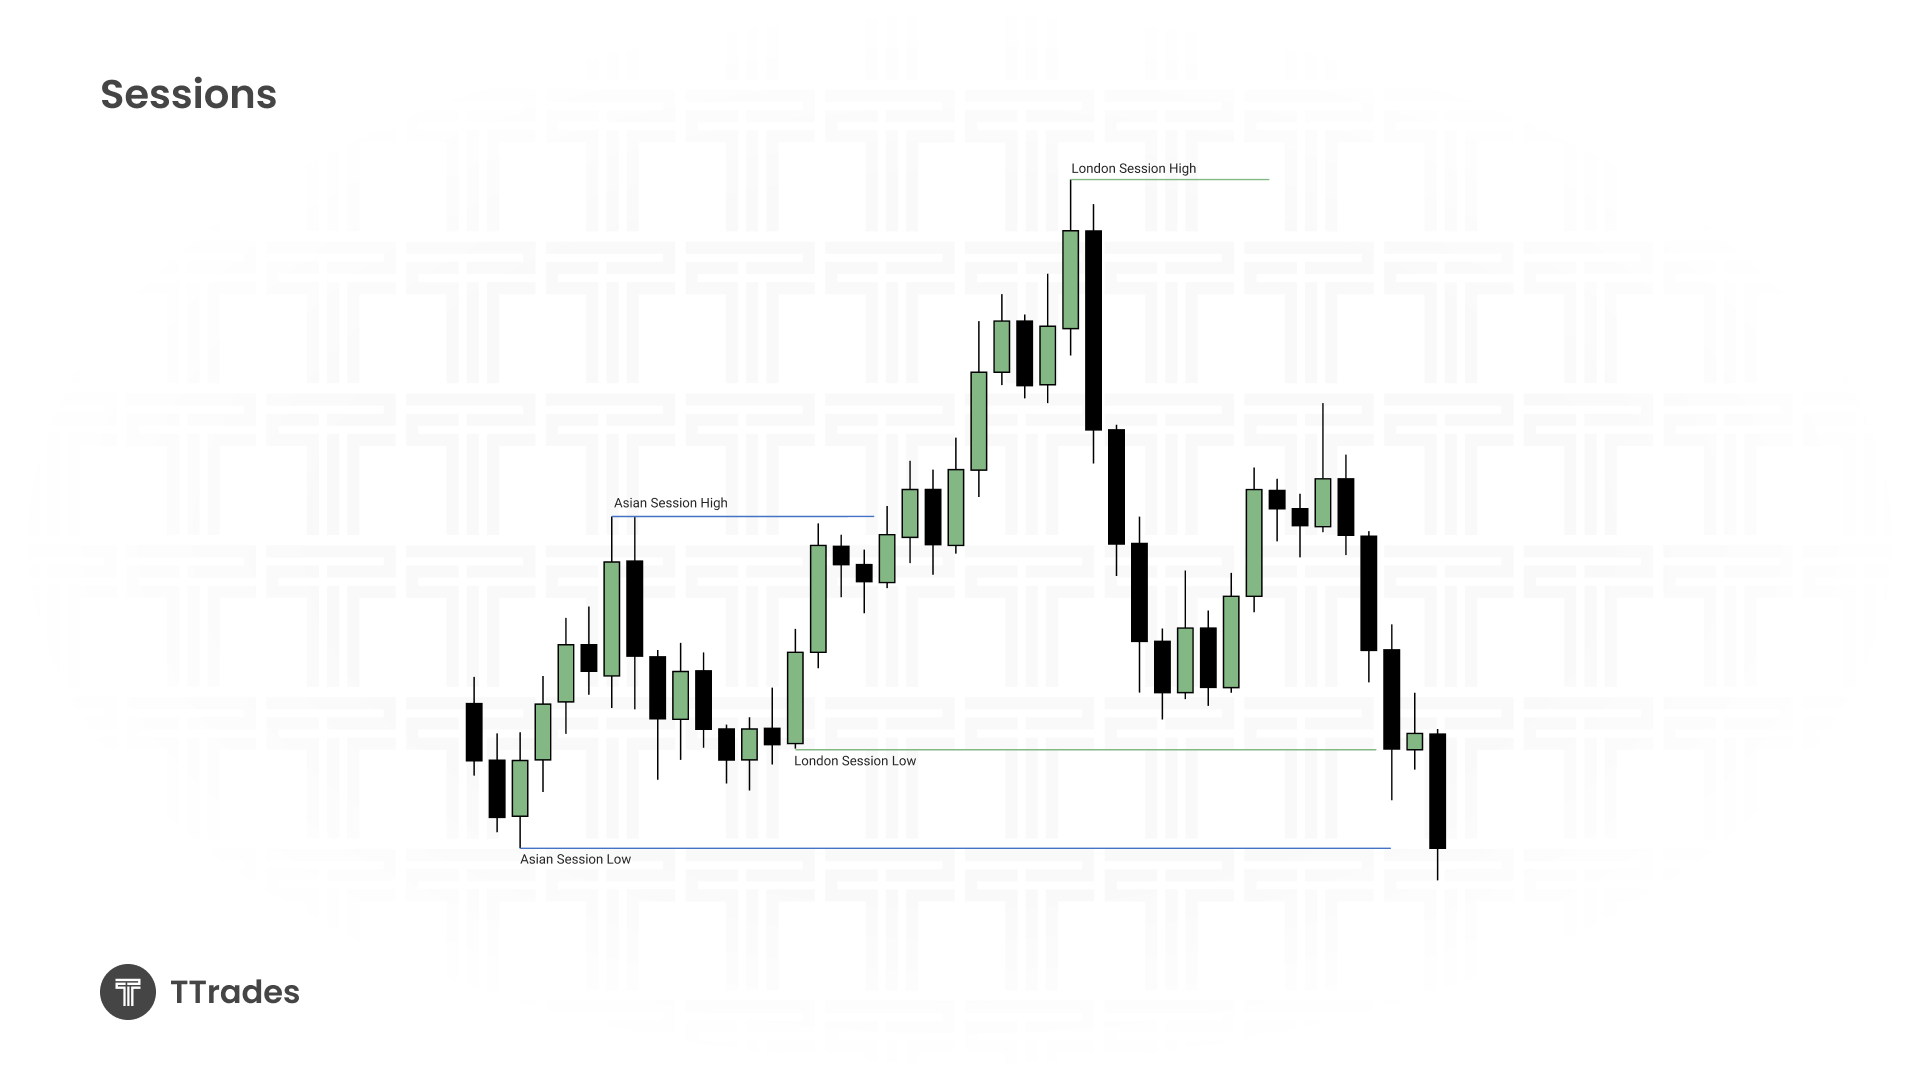
How Session Highs and Lows Are Used
Session ranges help reveal intent.
If price fails to displace above a session high, the probability of a move toward the session low increases. Strong displacement through a session low often signals continuation and expansion.
London commonly provides manipulation, while New York tends to deliver distribution. Observing how price reacts around Asia and London ranges often provides clarity on New York direction.
Using Displacement to Confirm Direction
Displacement is a key confirmation tool.
When price sweeps a session high, fails to continue, and then displaces strongly in the opposite direction, that sequence often sets up continuation during the New York session. Areas created by displacement frequently act as inversion levels as price continues.
Aligning Monthly, Daily, and Intraday Liquidity
The highest quality setups occur when multiple timeframes align.
A typical sequence involves monthly bias pointing toward a previous high or low, daily price action confirming with displacement or a shift in structure, and intraday sessions providing precise execution through liquidity sweeps and displacement.
This top down approach allows entries to remain precise while targets stay logical and objective.
Putting It All Together
Liquidity levels are reference points that reflect trader behavior. By consistently marking previous highs and lows and observing how price reacts around them, structure becomes easier to interpret.
When candle behavior, higher timeframe liquidity, session ranges, and displacement align, trade ideas become clearer and more repeatable.
Conclusion
Understanding where liquidity resides gives context to every move price makes. Instead of reacting emotionally, you begin anticipating where price is likely to go and why. When liquidity aligns across timeframes and sessions, execution becomes structured and intentional rather than reactive.