Introduction
The Fractal Model Playbook is built on the principle that price cannot reverse without forming a swing point. This simple but powerful concept, when paired with a structured top-down approach, helps traders identify high-probability setups by aligning the daily, hourly, and 5-minute charts.
In this guide, we’ll break down:
- The candle numbering system for swing points.
- How to form a daily bias using closures.
- How to confirm change in state of delivery (CISD) on the hourly.
- How to refine entries using the 5-minute chart.
The Foundation: Swing Points & Candle Numbering
- At the core of the fractal model is the idea that price cannot reverse without a swing point.
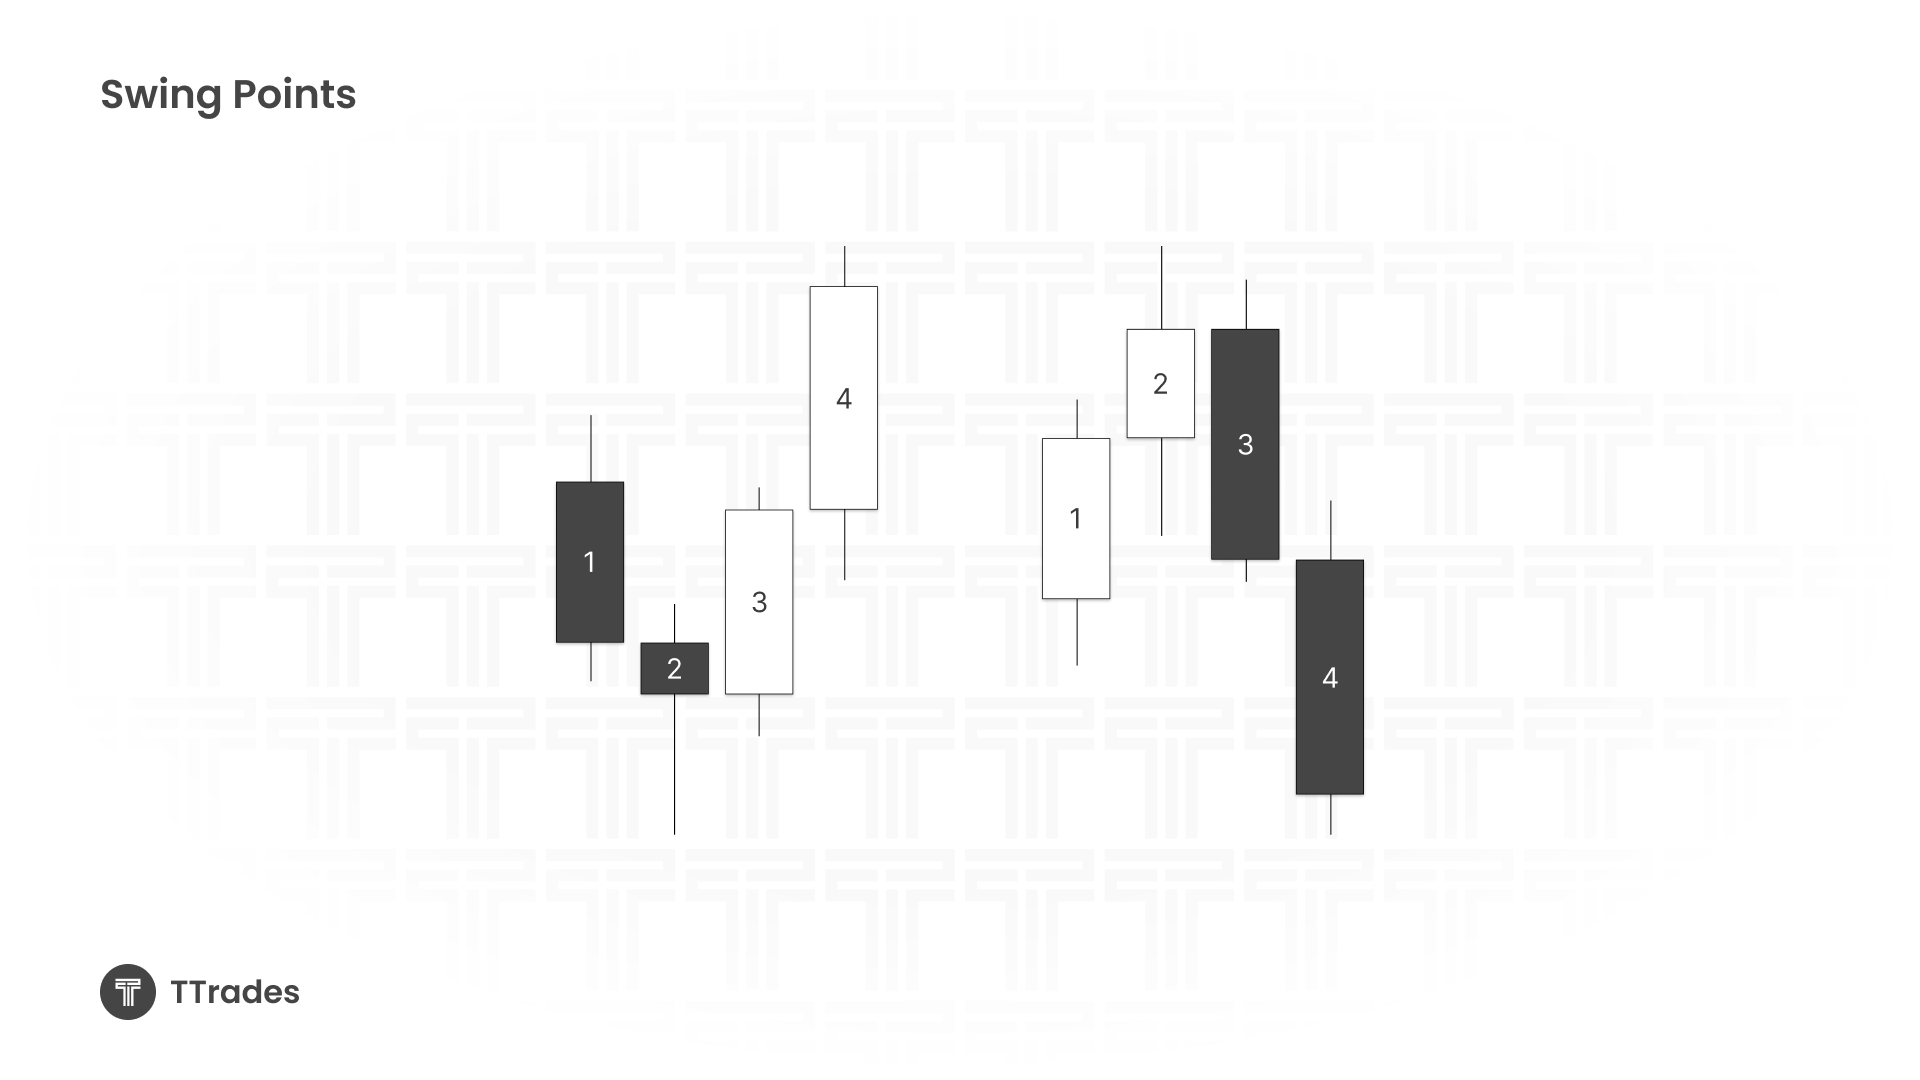
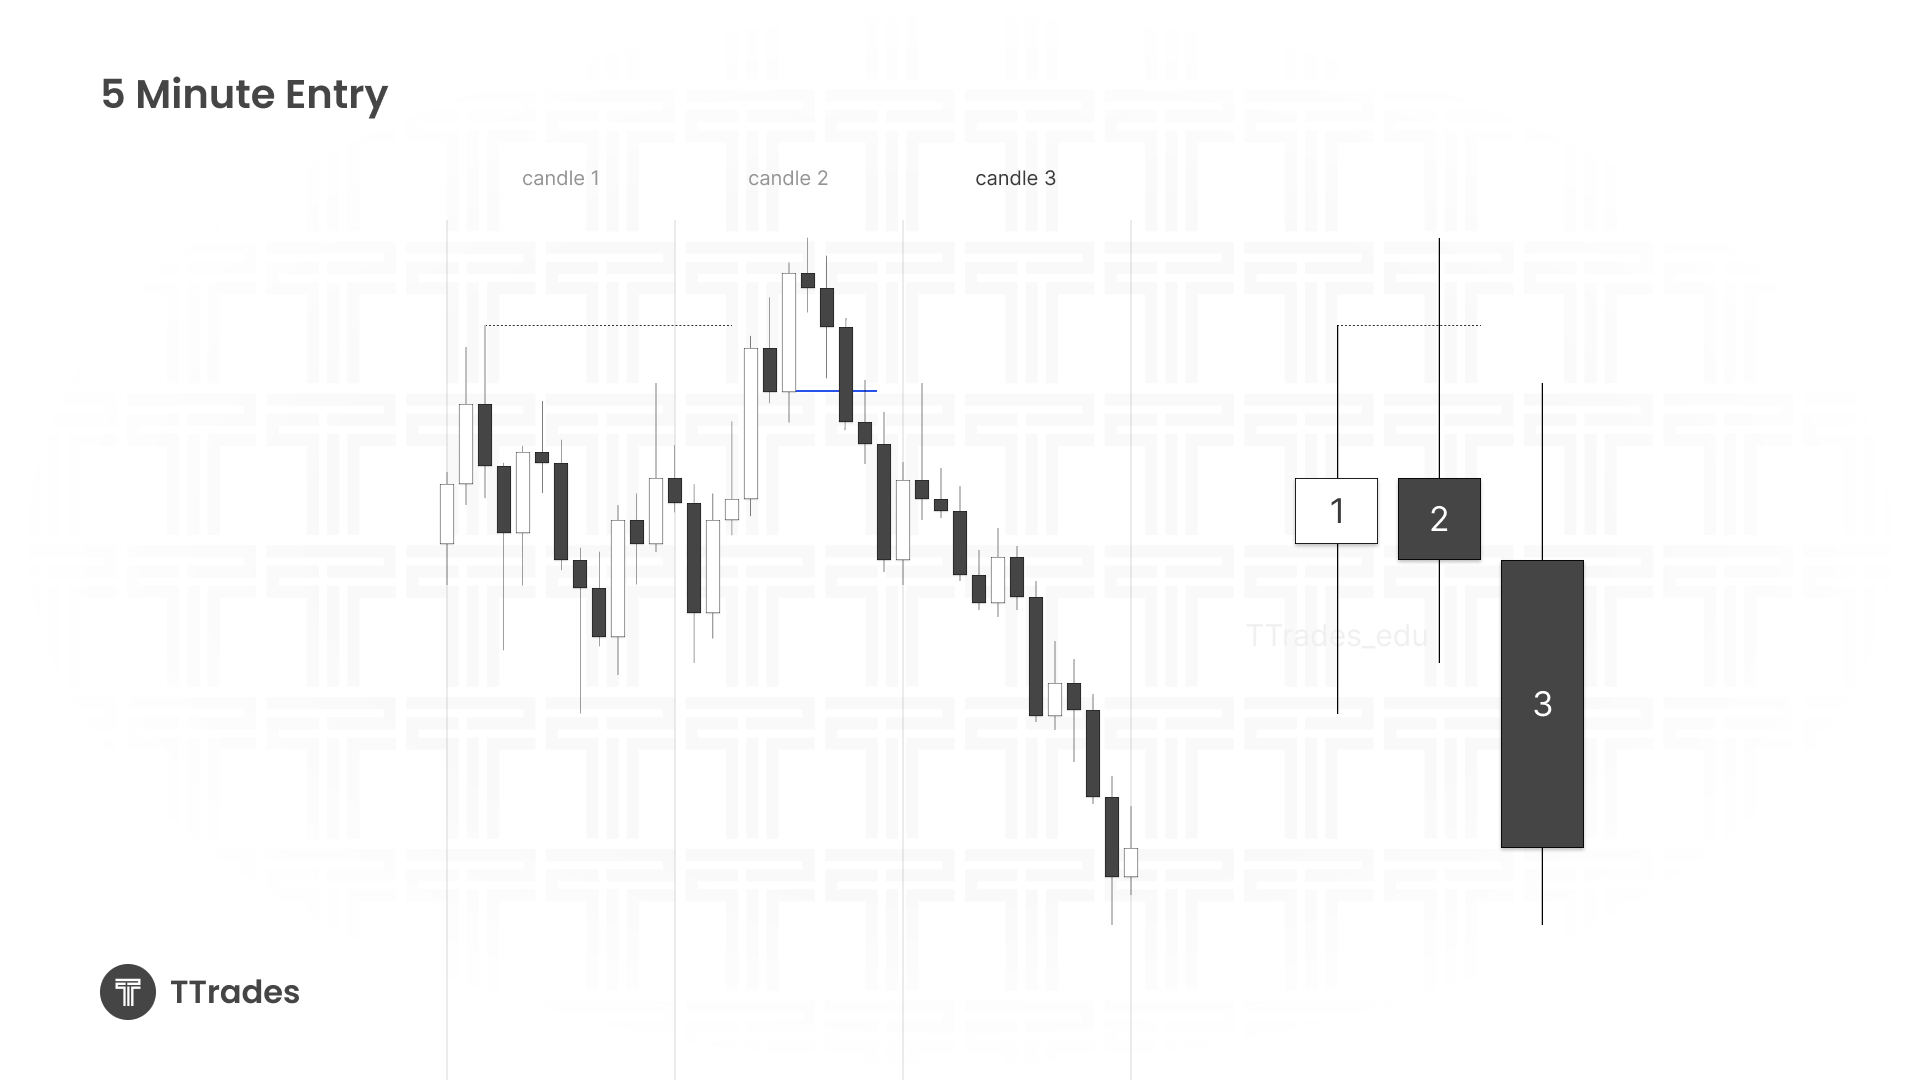
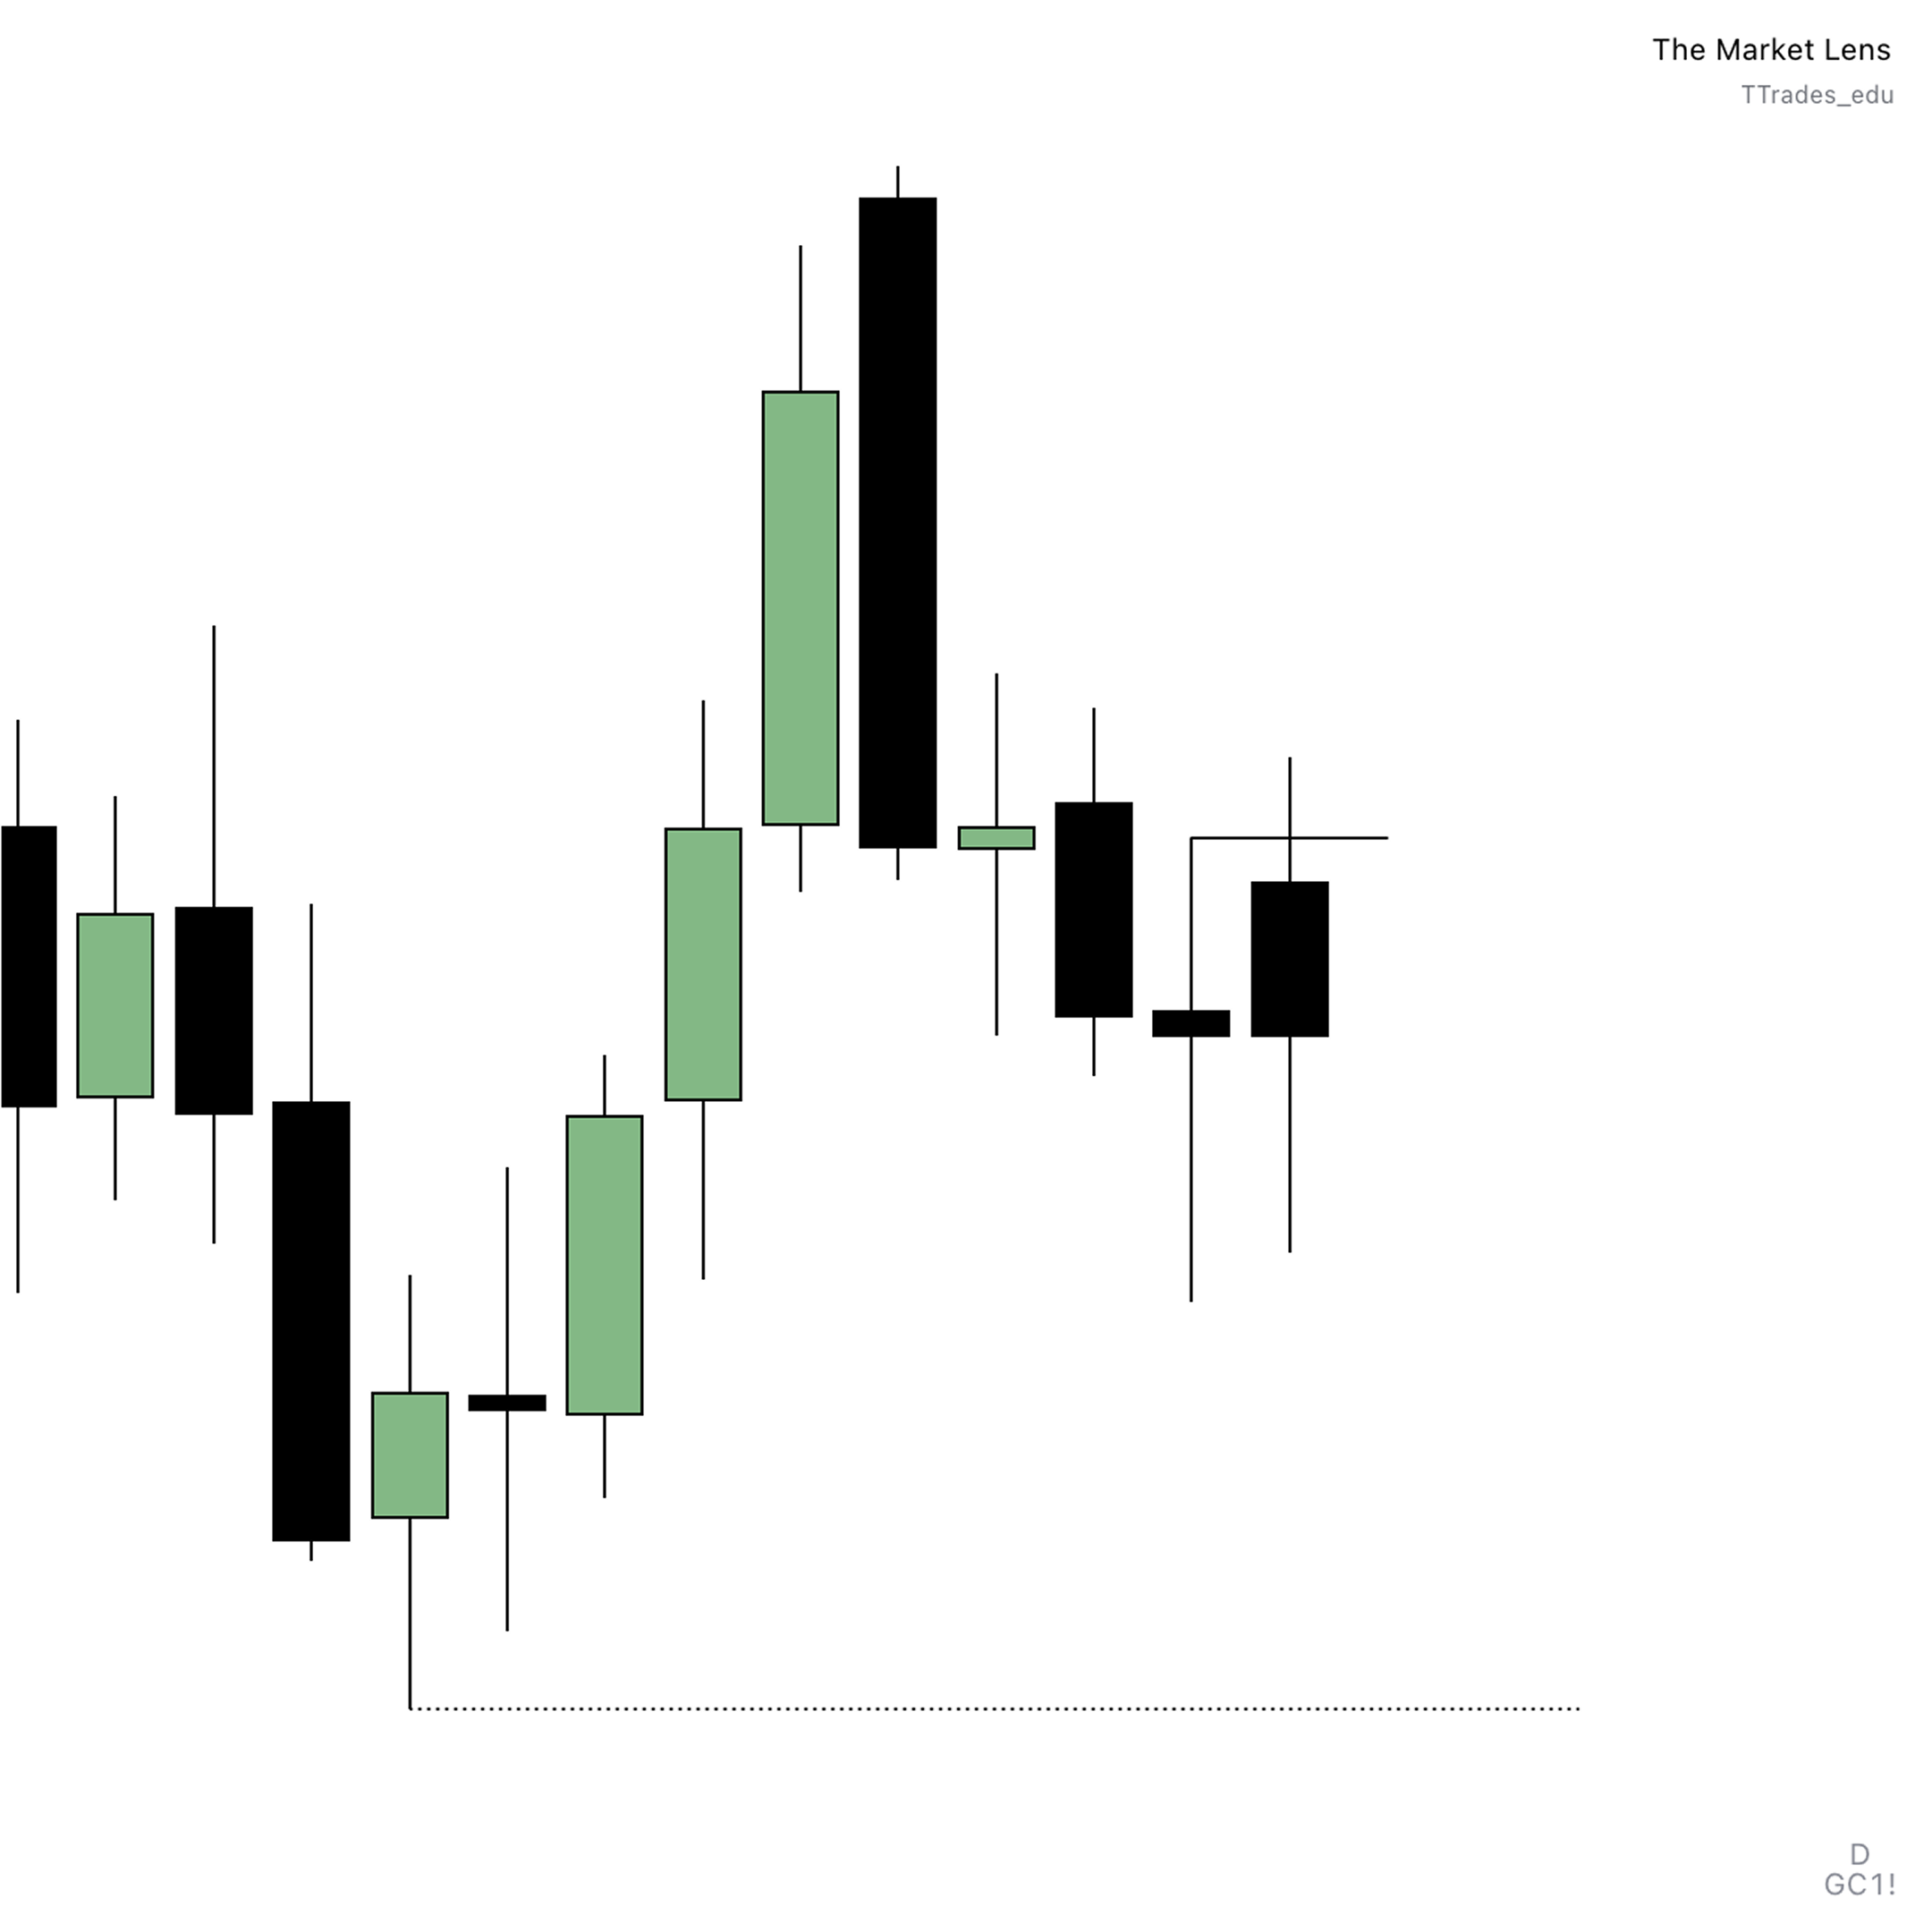
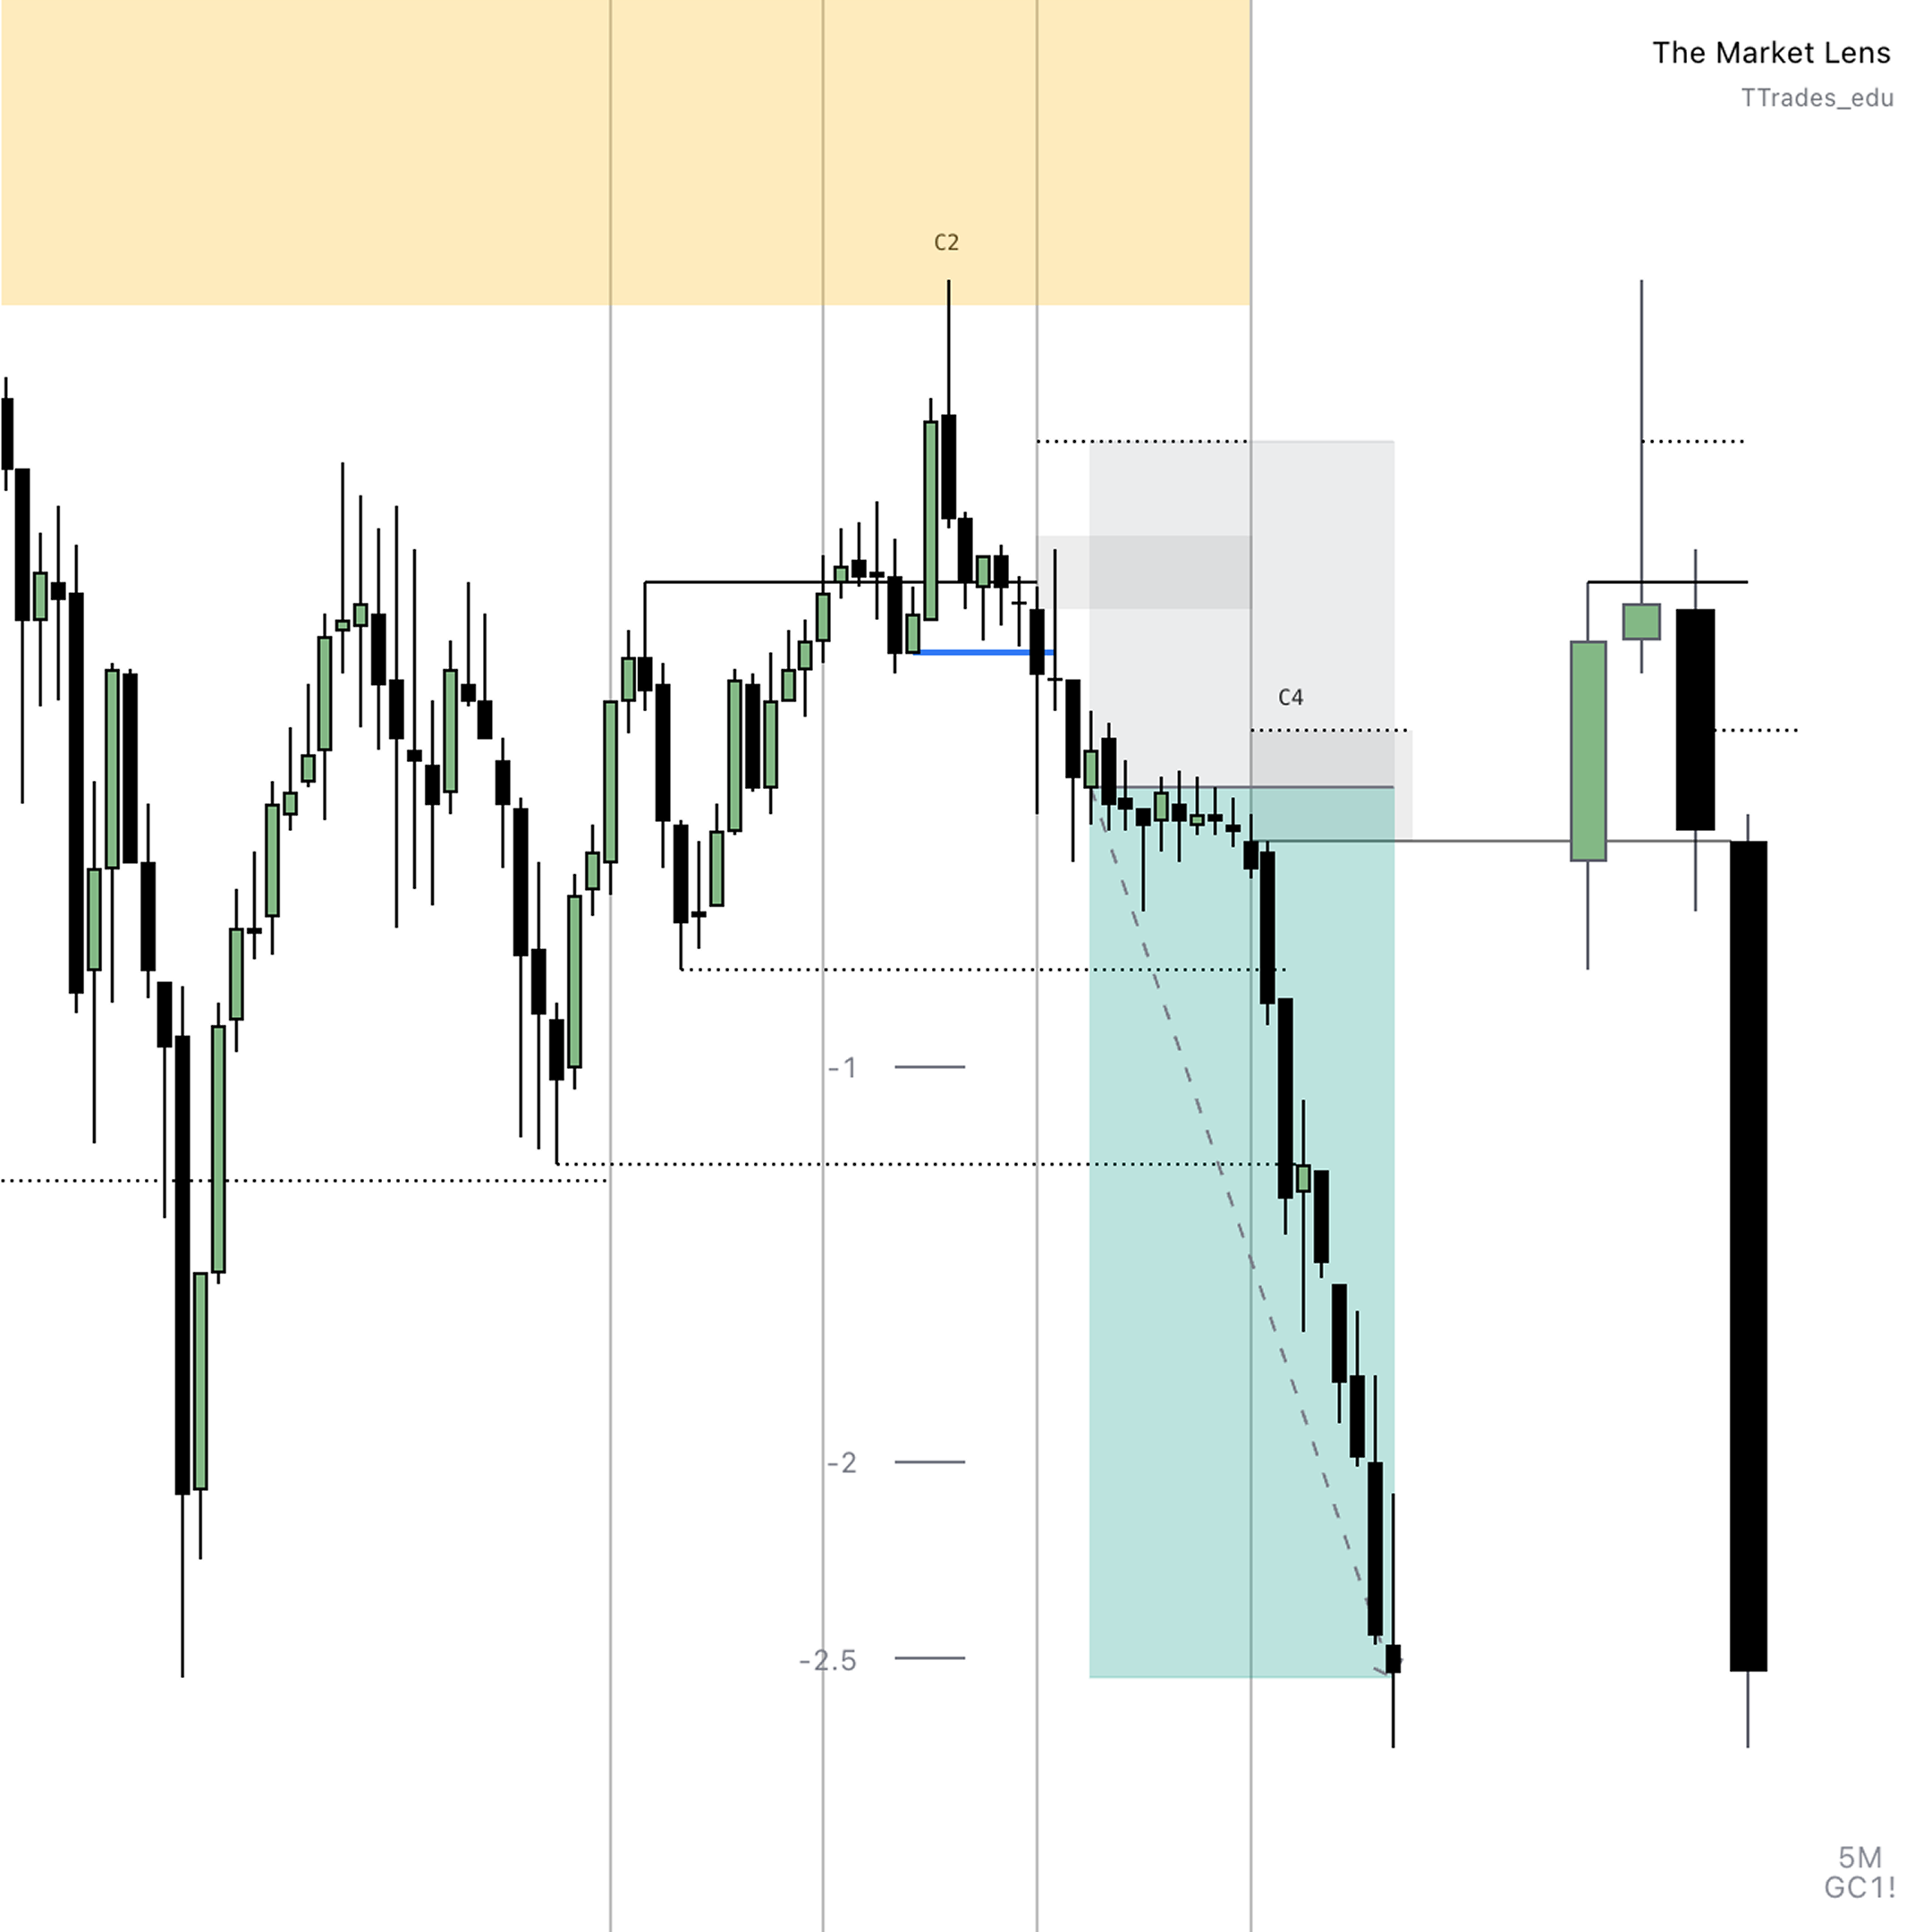
Candle numbering system:
- Candle 1 – Before the swing point.
- Candle 2 – The swing high or swing low.
- Candle 3 – After Candle 2.
- Candle 4 – After Candle 3.
Example:
- Bearish → Bullish: Candle 2 is a swing low.
- Bullish → Bearish: Candle 2 is a swing high.
Step One – Establishing a Daily Bias
Never drop to the hourly until you have a one-sided daily bias.
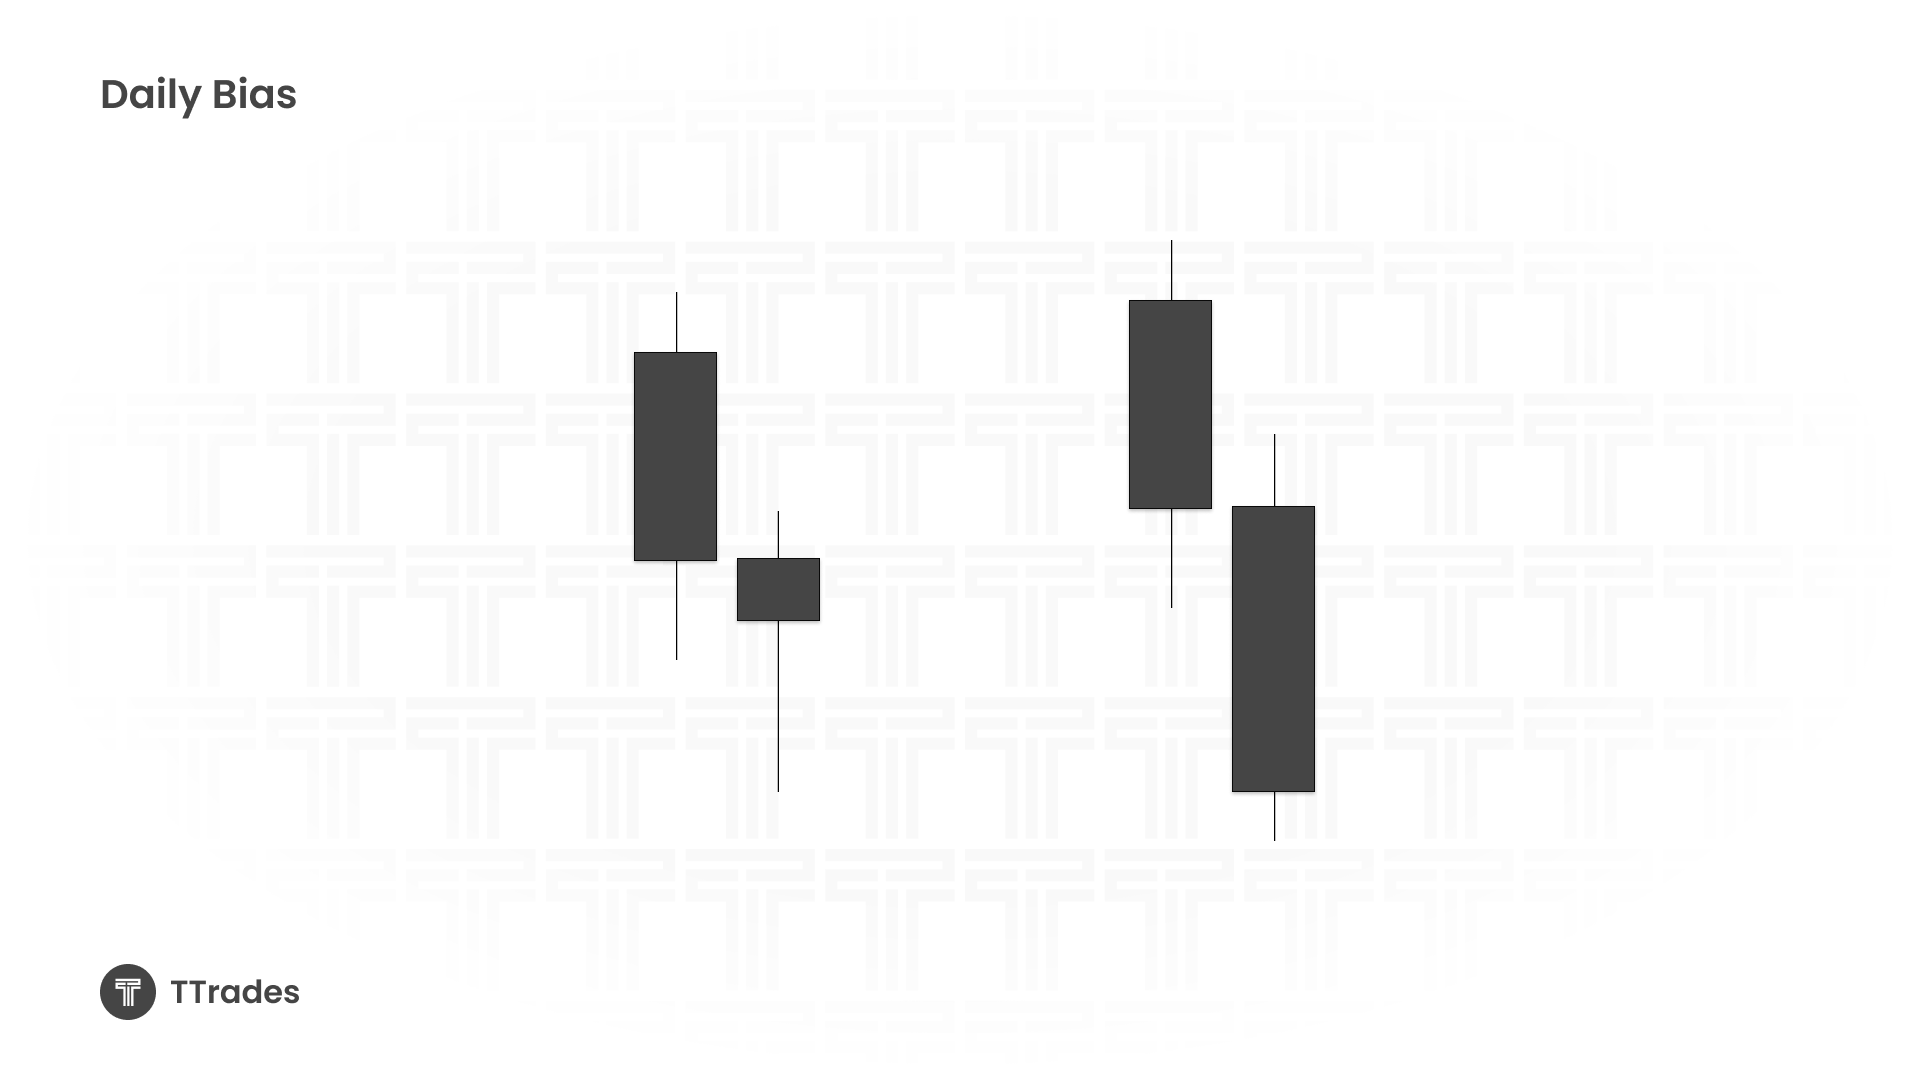
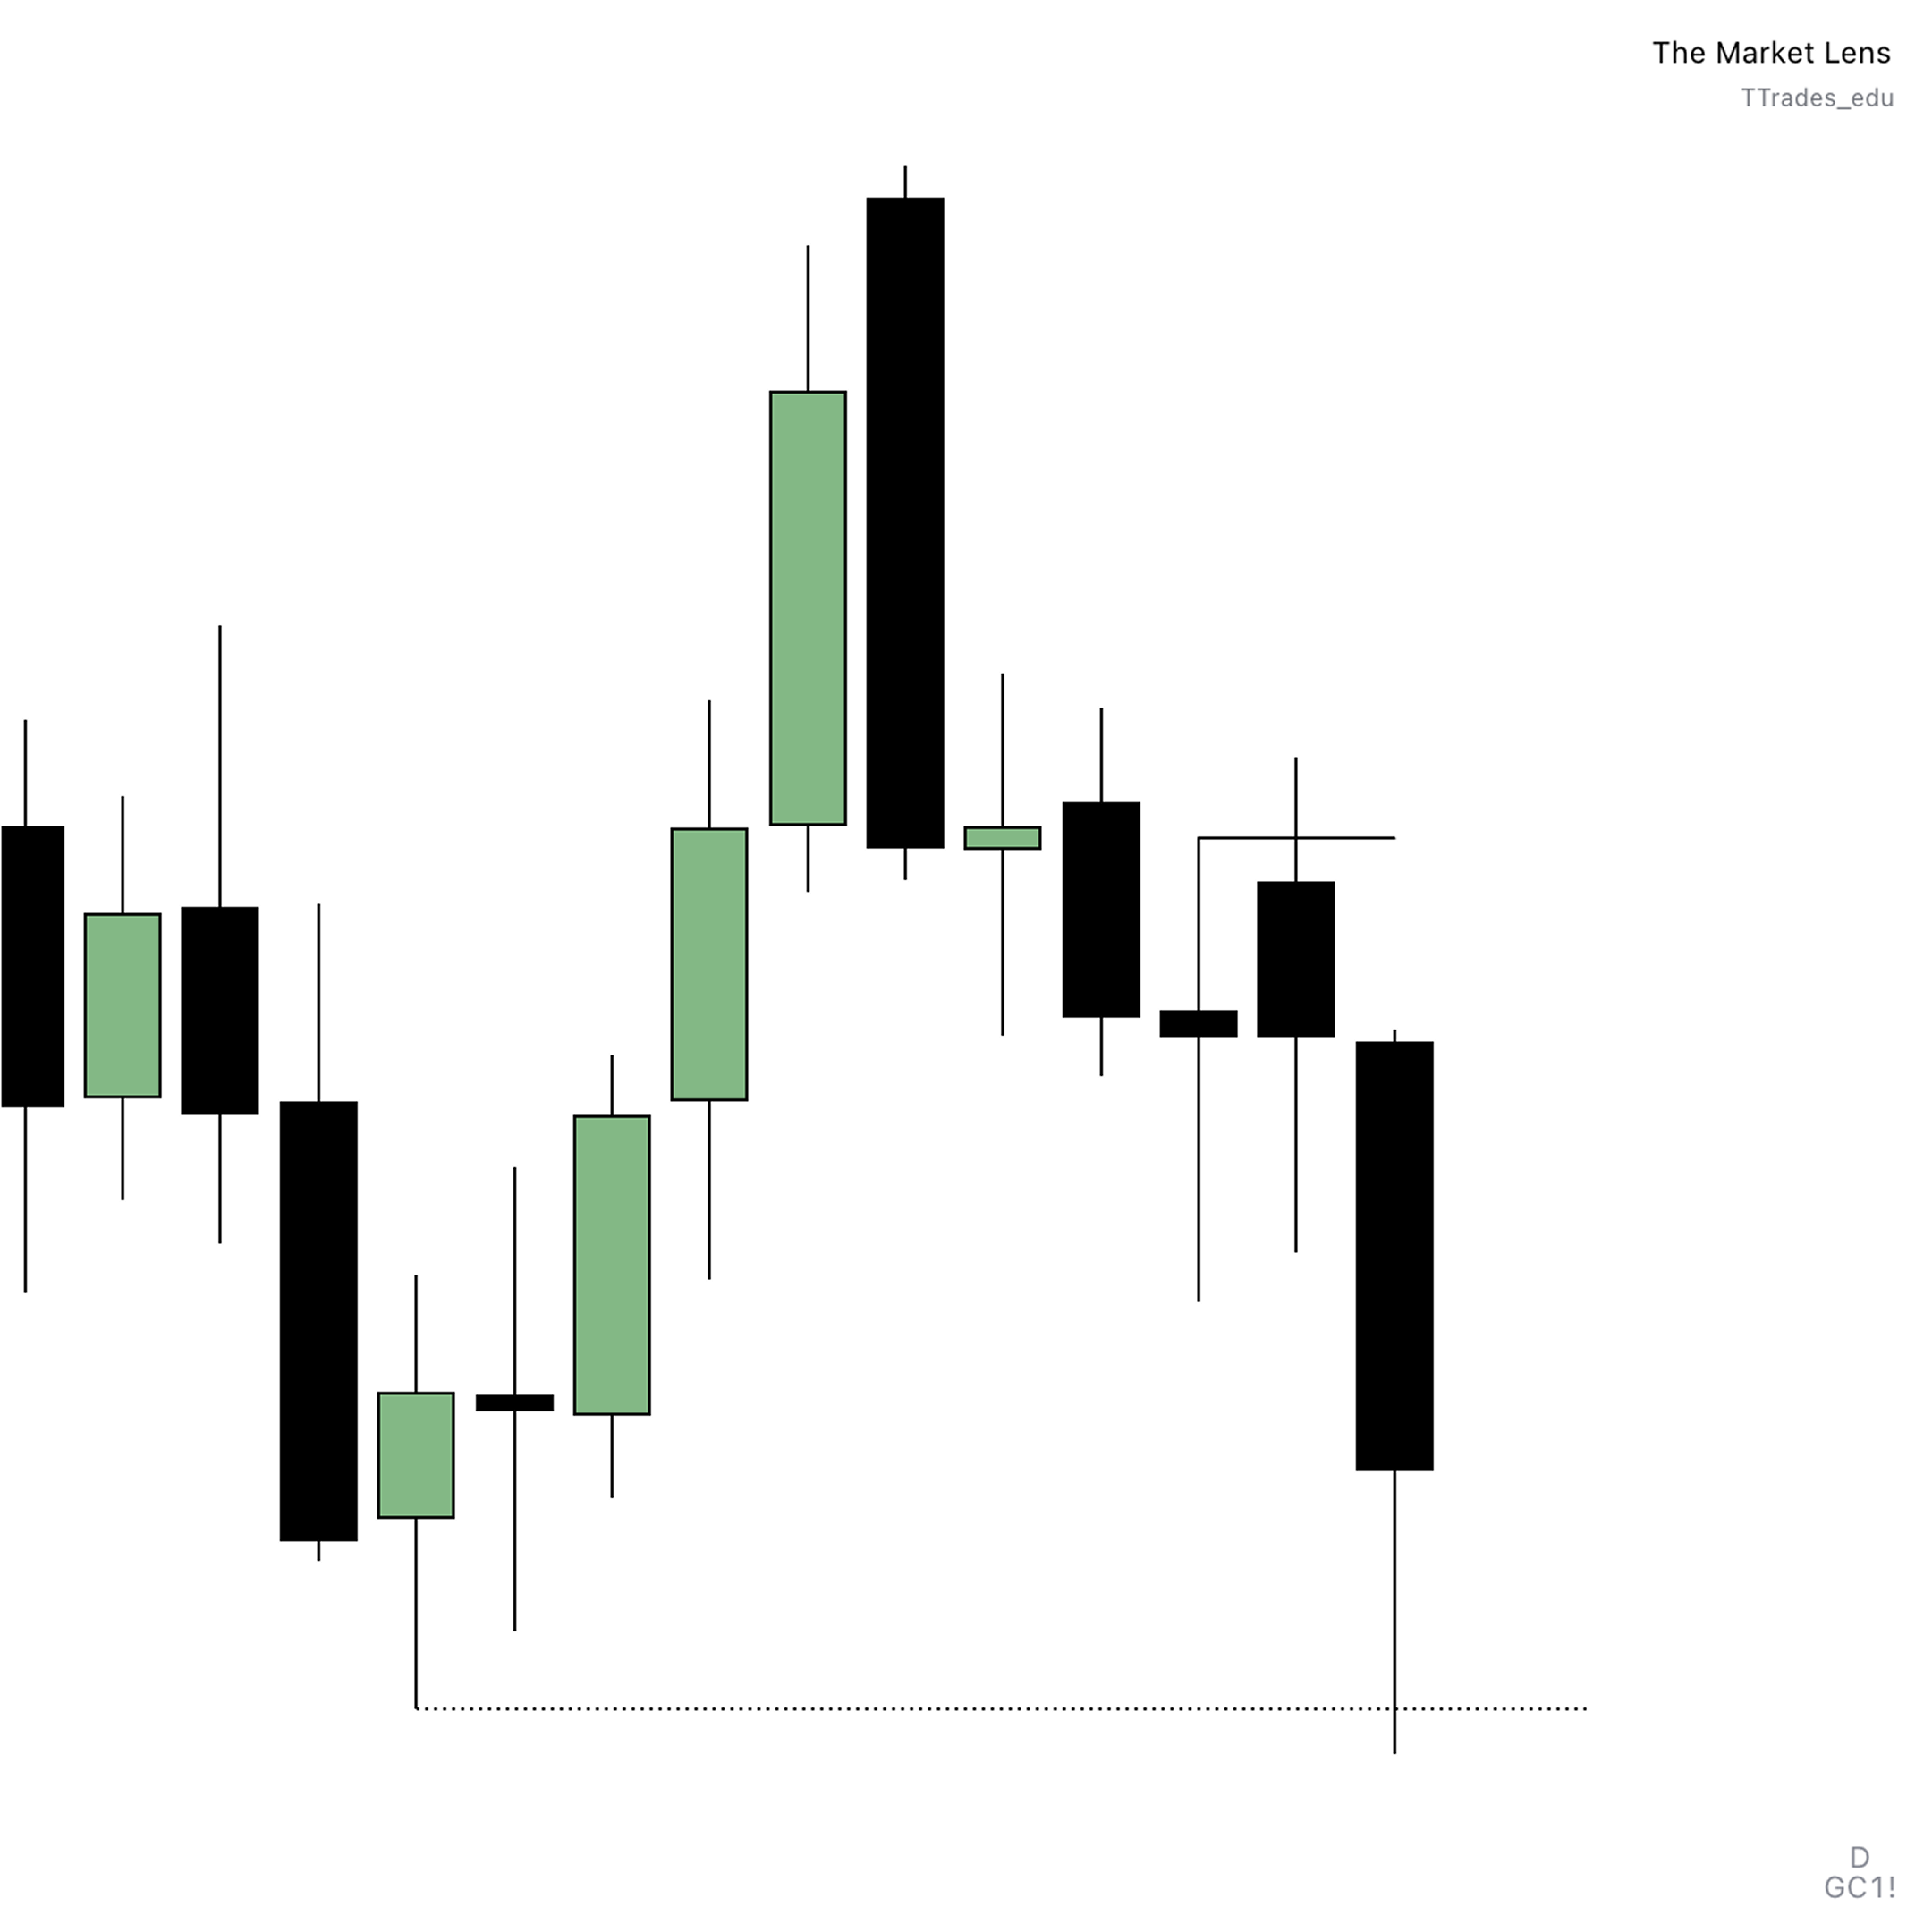
Daily bias rules:
- If price closes below the previous day’s low – Expect continuation lower.
- If price fails to close below the previous day’s low – Expect reversal higher.
- Same logic applies for previous day’s high, but inverted.
Ideal scenario:
Identify swing points on the daily where a reversal closure occurs, then plan to trade the continuation the next day.
Step Two – Hourly Chart Confirmation
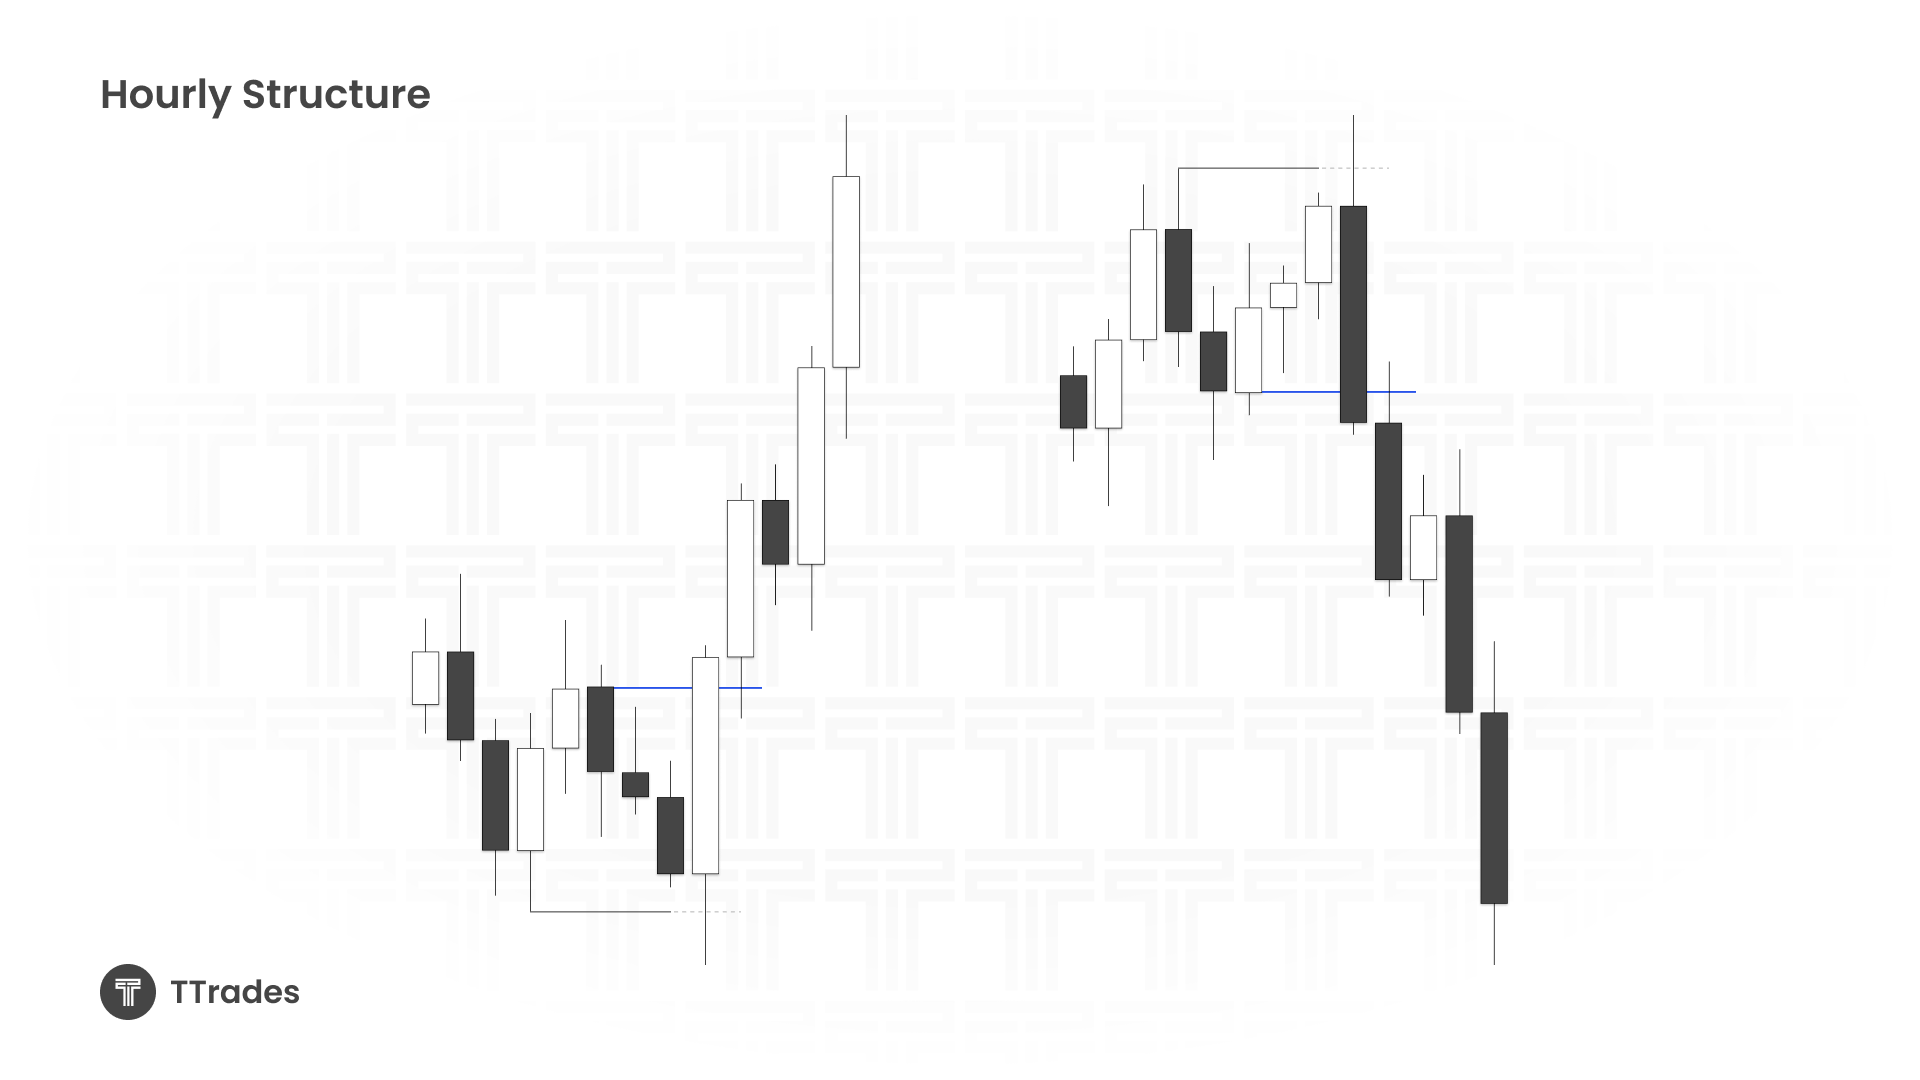
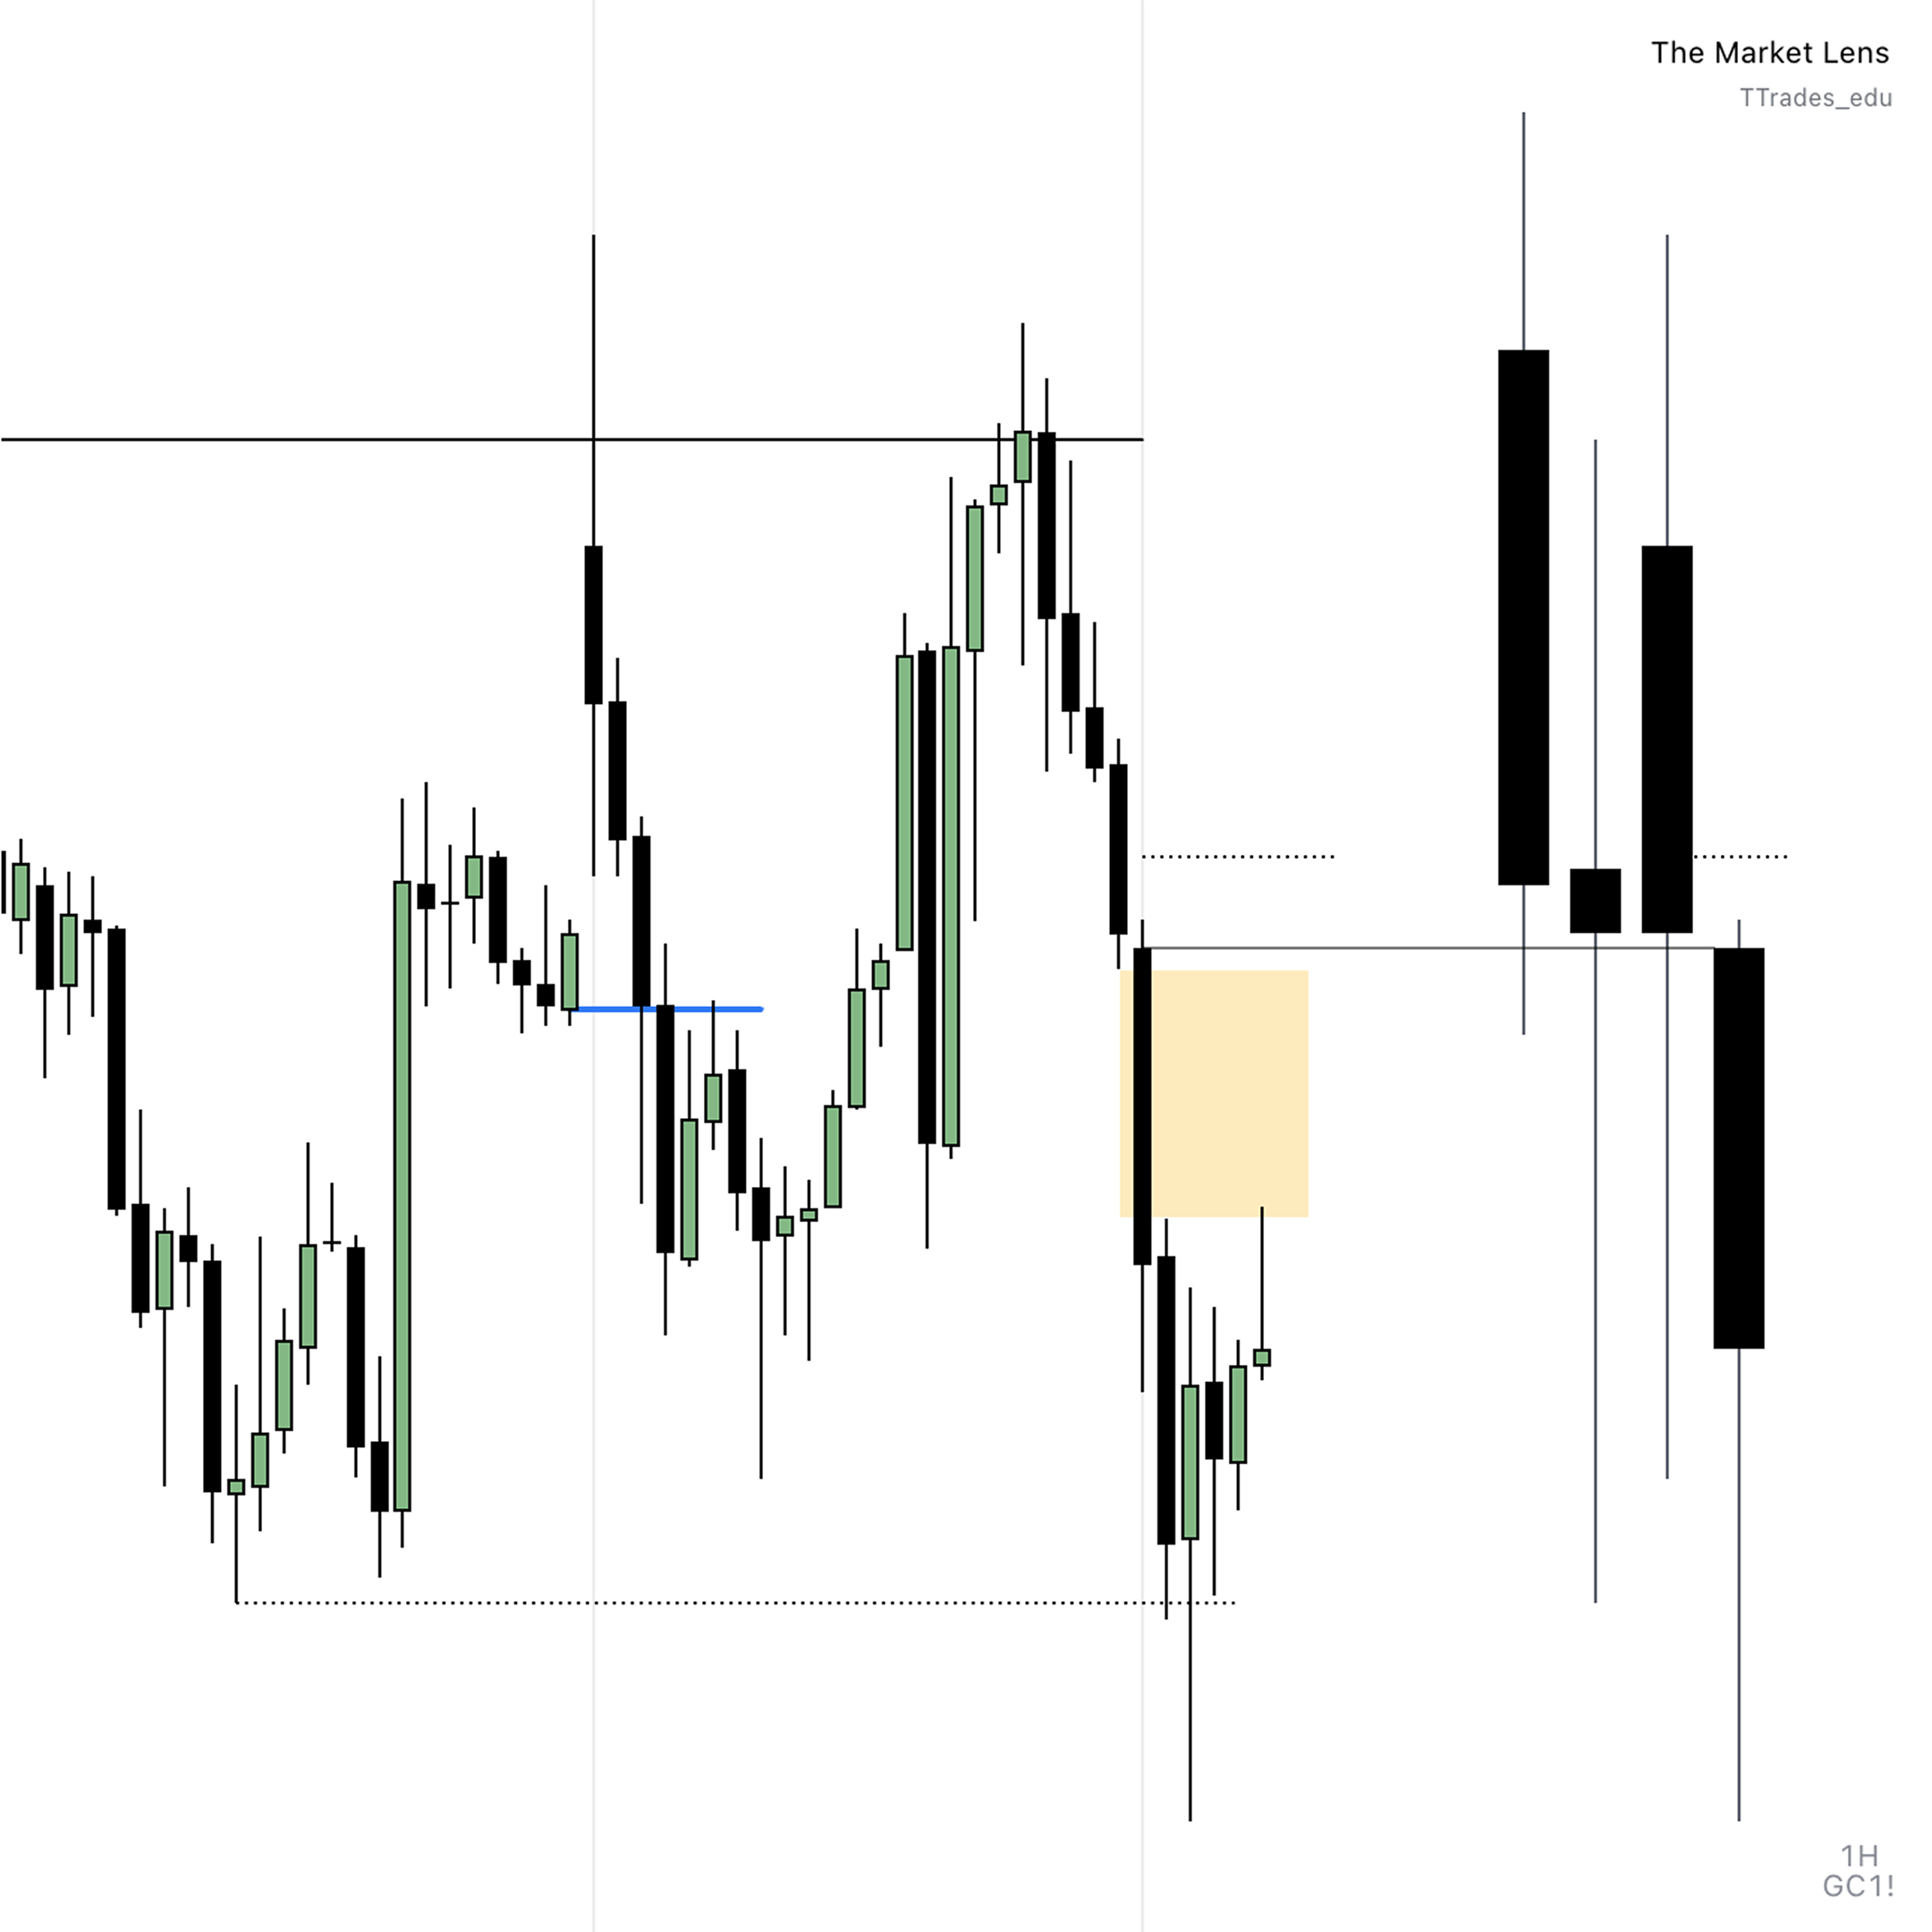
Once the daily bias is established:
- Locate the Candle 2 swing point on the daily.
- On the hourly, confirm a Change in the State of Delivery (CISD) in the same direction as your bias.
- Look for price in the upper/lower half of the previous day’s range and at a Point of Interest (POI) (e.g., fair value gaps, order blocks).
Example:
If you have a bullish daily swing point, find a bullish CISD on the hourly, then find a POI in the upper half of the previous day’s range.
Step Three – Entry Refinement on the 5-Minute
Once the hourly setup is validated:
- Drop to the 5-minute chart.
- Confirm a CISD in Candle 2 (hourly) on the 5-minute.
- Align with POIs that match your bias.
- Use protected lows/highs for stops.
- Target logical liquidity pools or higher time frame levels for best R:R.
Example Playbook Rules
Daily Chart
- Define one-sided bias using daily closures.
- Look for reversal closures at swing points.
💡 Pro Tip: Look to target low resistance liquidity on the daily chart.
Hourly Chart
- Confirm CISD in Candle 2.
- Identify POI within previous day’s range.
- Wait for candle closure in POI.
💡 Pro Tip: when price reaches a short term target, watch the phases of price. For a continuation it is ideal for price to retrace or consolidate.
5-Minute Chart
- Confirm CISD again.
- Place stops at protected swing points or level of invalidation.
- Target 2R minimum or higher timeframe levels.
Common Mistakes & Lessons Learned
- Entering too early: Waiting for closure (CISD) confirmation prevents false reversals.
- Ignoring range EQ: Entries after reaching through range EQ often don’t expand
- Not aligning timeframes: Expansion occurs when all timeframes point in one direction
Try Backtesting!
Apply this model in a backtesting session:
- Win rate: ~40-80%
- Average R: Minimum 2R
- Minimum target: 2R to remain profitable with >34% win rate.
Key Takeaways
- Start with daily bias, then confirm on the hourly, refine on the 5-minute.
- Always confirm CISD before entering.
- Align entries with logical POIs and range EQ.
- Target 2R+ using higher TF liquidity pools.