
Introduction
Broadening formations are a powerful way to understand market expansion, liquidity grabs, and directional intent. They often appear when price repeatedly sweeps both sides of a range, failing to establish a true breakout. This blog breaks down what broadening formations are, how to draw them, how they interact with liquidity and the Power of Three, and how they tie into the Seek and Destroy daily profile.
What is a Broadening Formation?
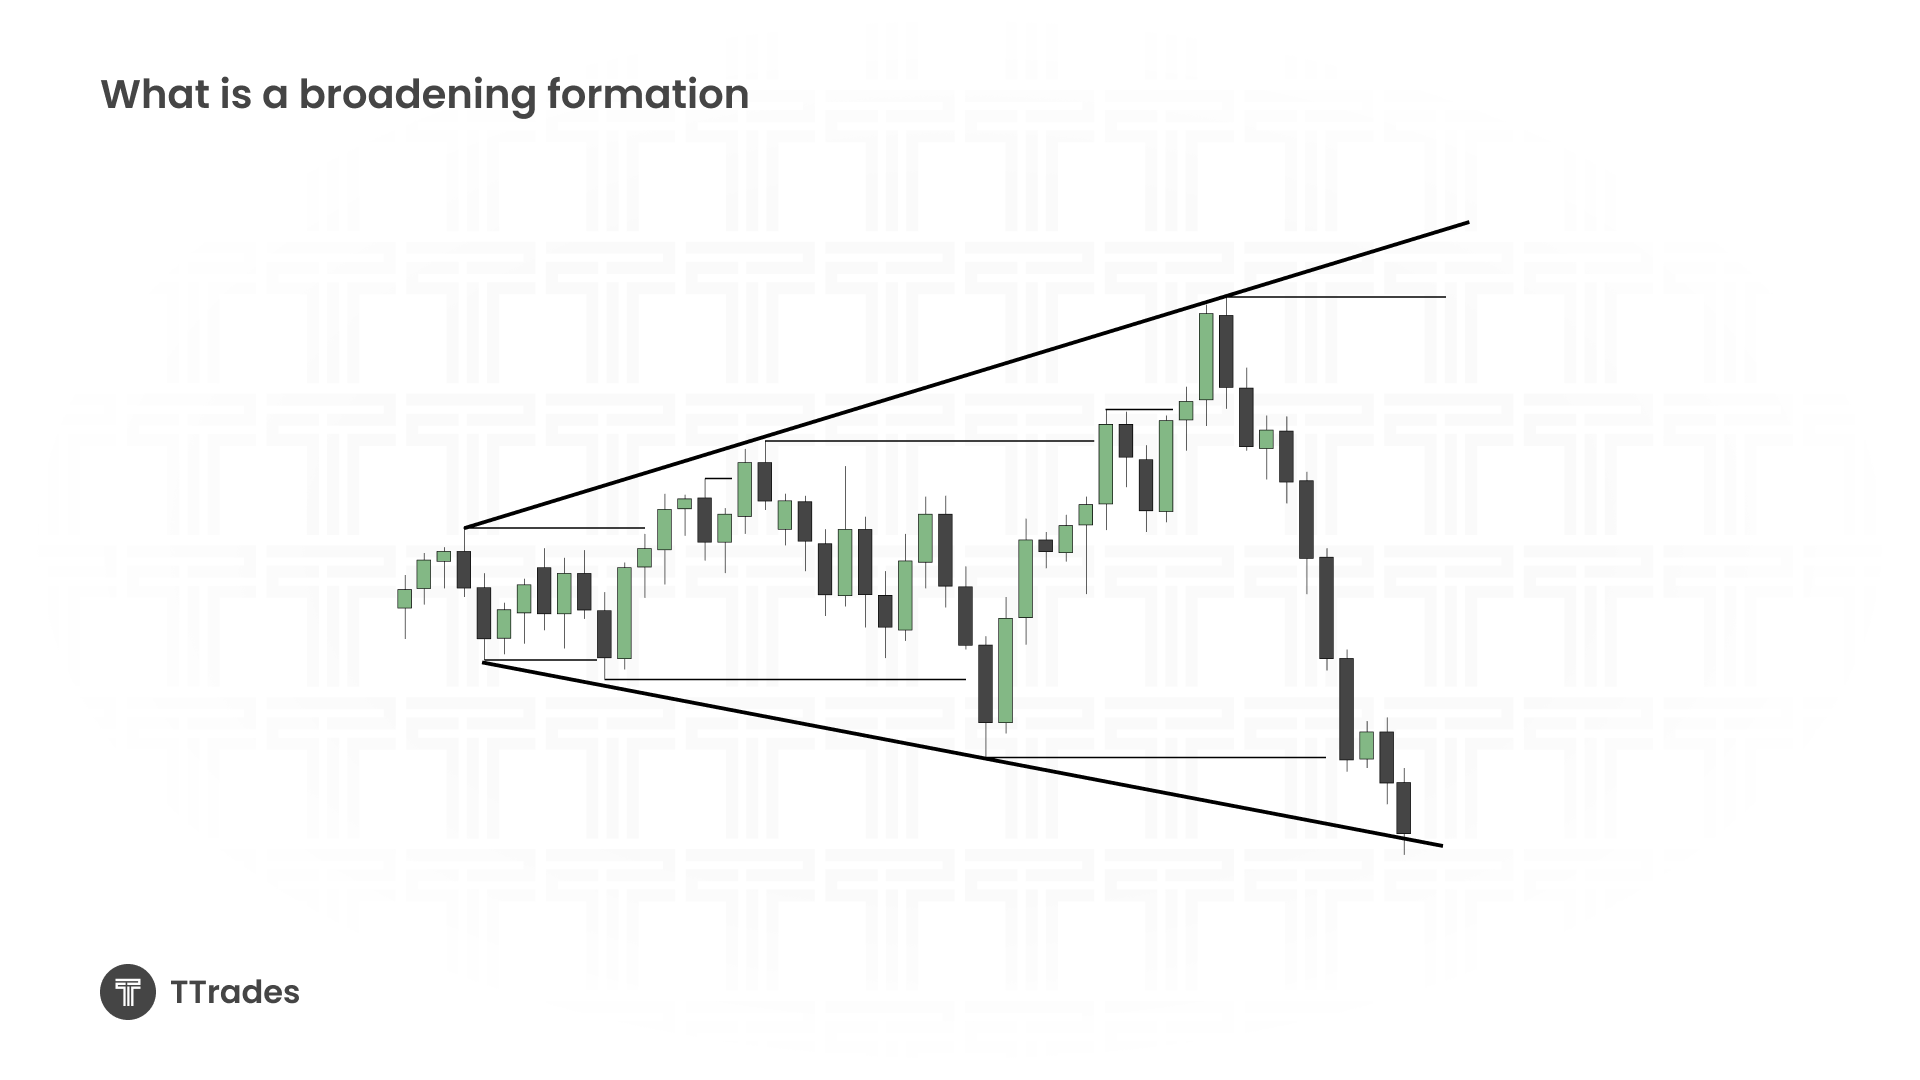
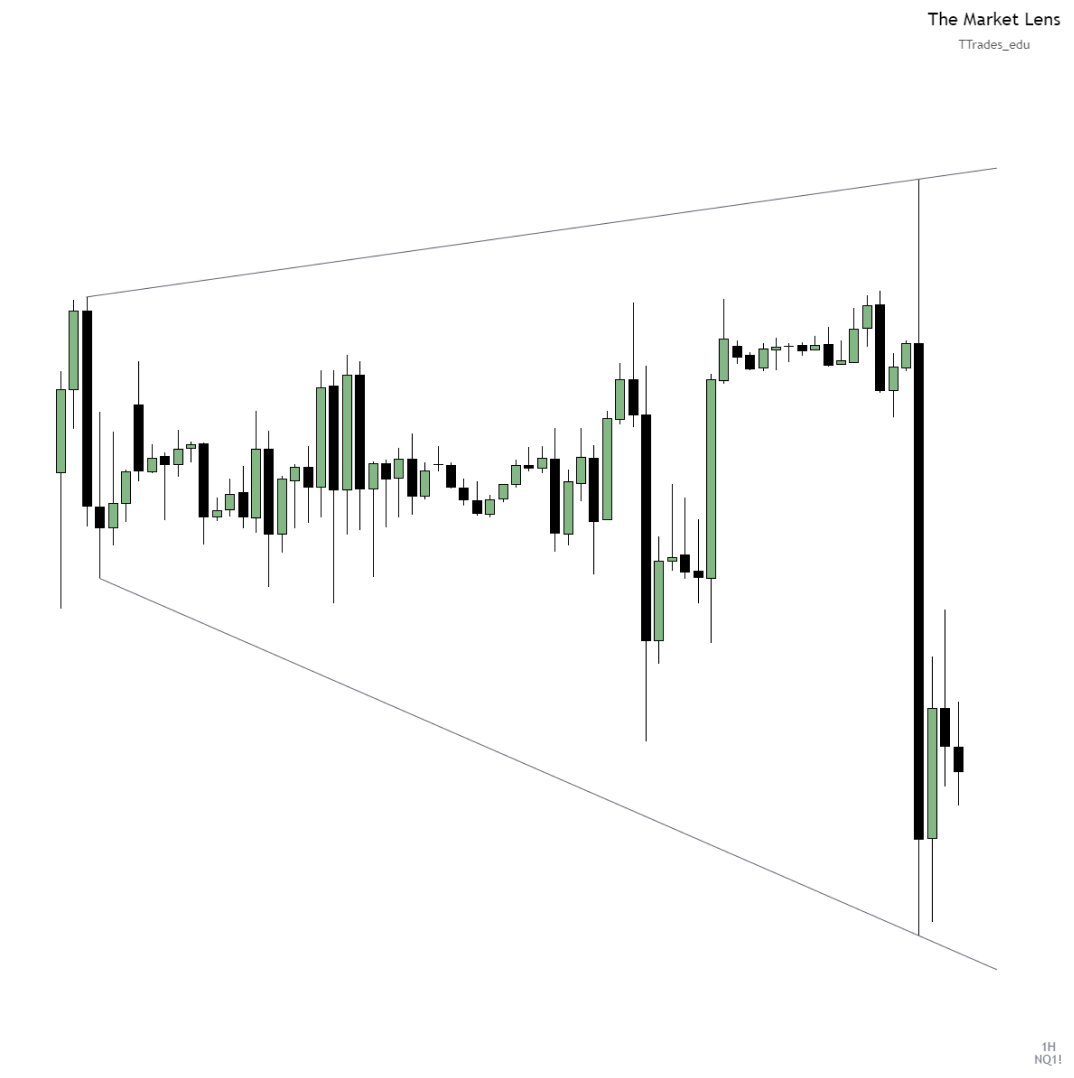
A broadening formation occurs when price keeps expanding beyond a defined range without holding a breakout. Imagine price trapped inside a consolidation, only to constantly sweep one side, then the other. Over time, this creates a pattern of expansion both up and down, leading to a broader range than where it started.
Key features:
Price takes out one side of a range, fails, and trades back inside
The same process repeats, expanding both sides
The result is a megaphone-style structure that highlights liquidity hunts
How to Spot and Draw Broadening Formations
There are two common approaches:
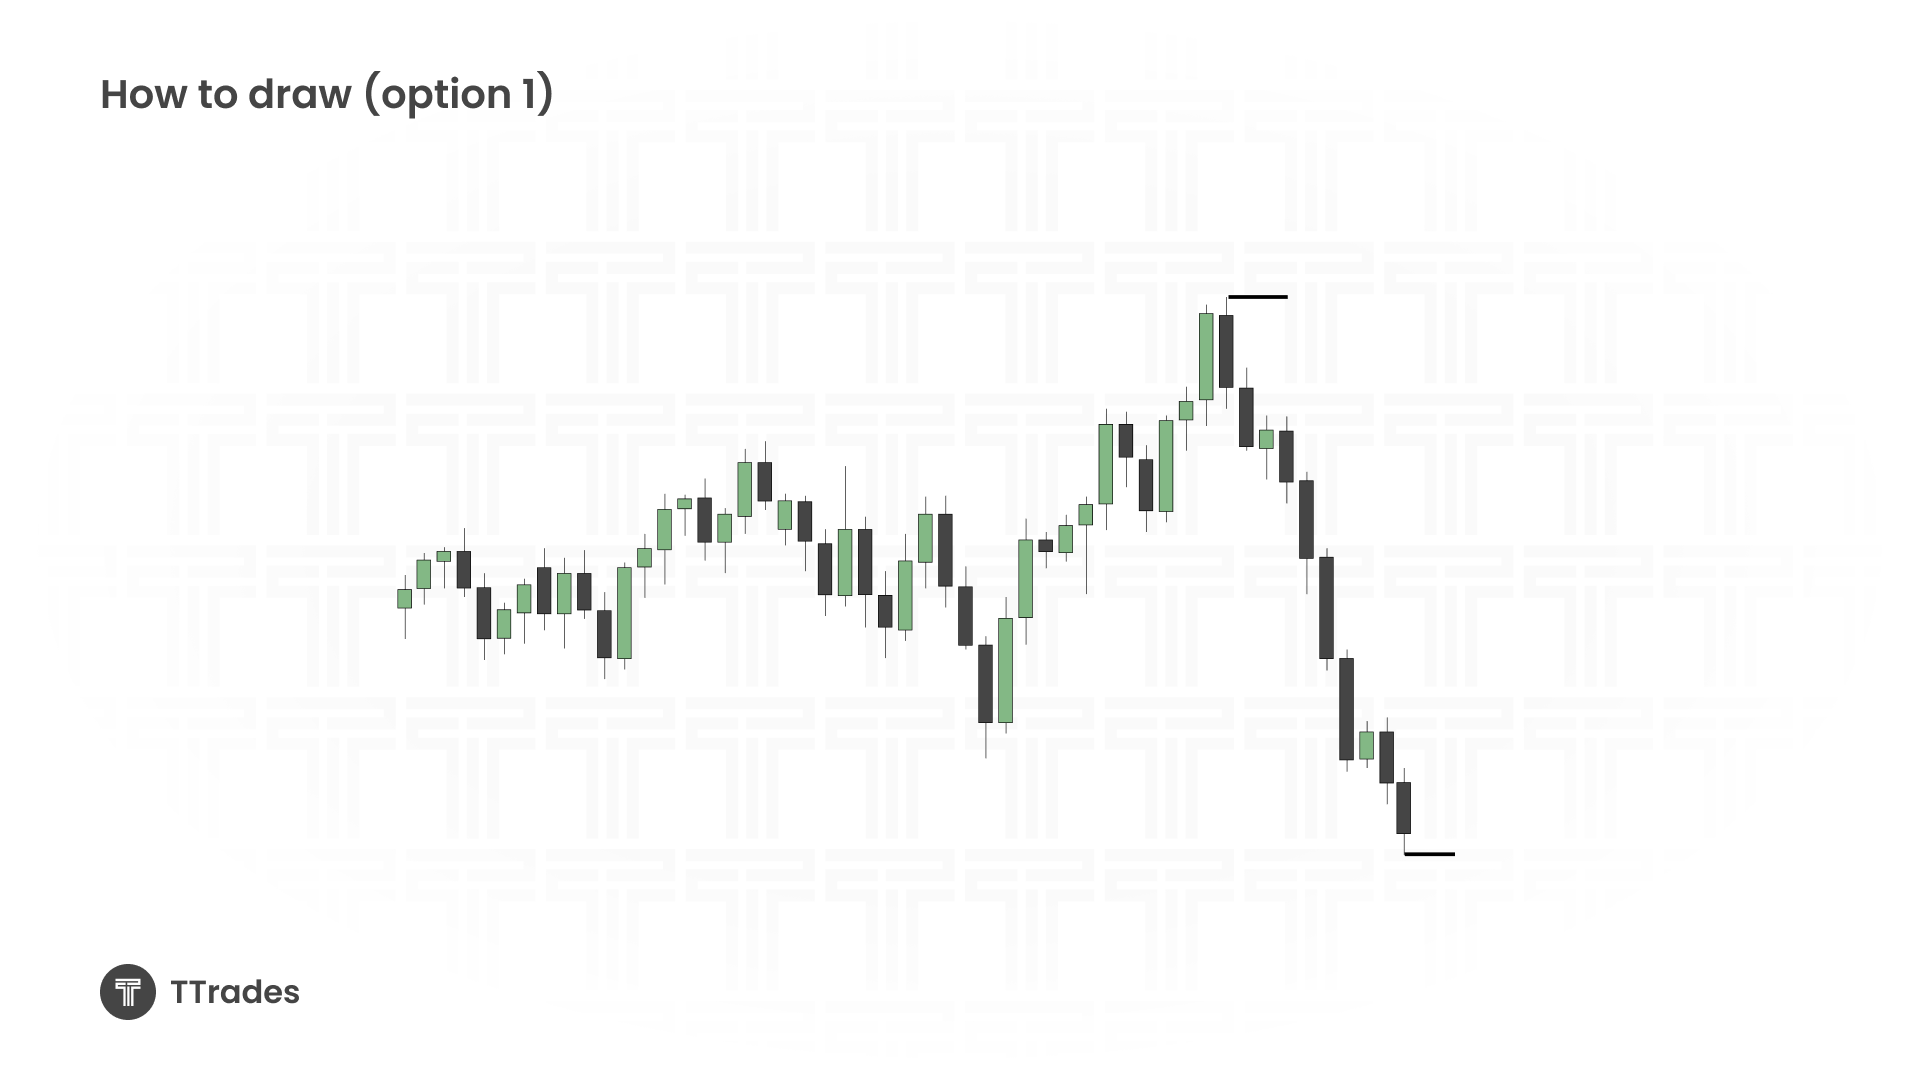
- High-Low Method
Identify a significant high and low
Look left to see which highs or lows were taken out
Connect these points and extend them outward as the range expands
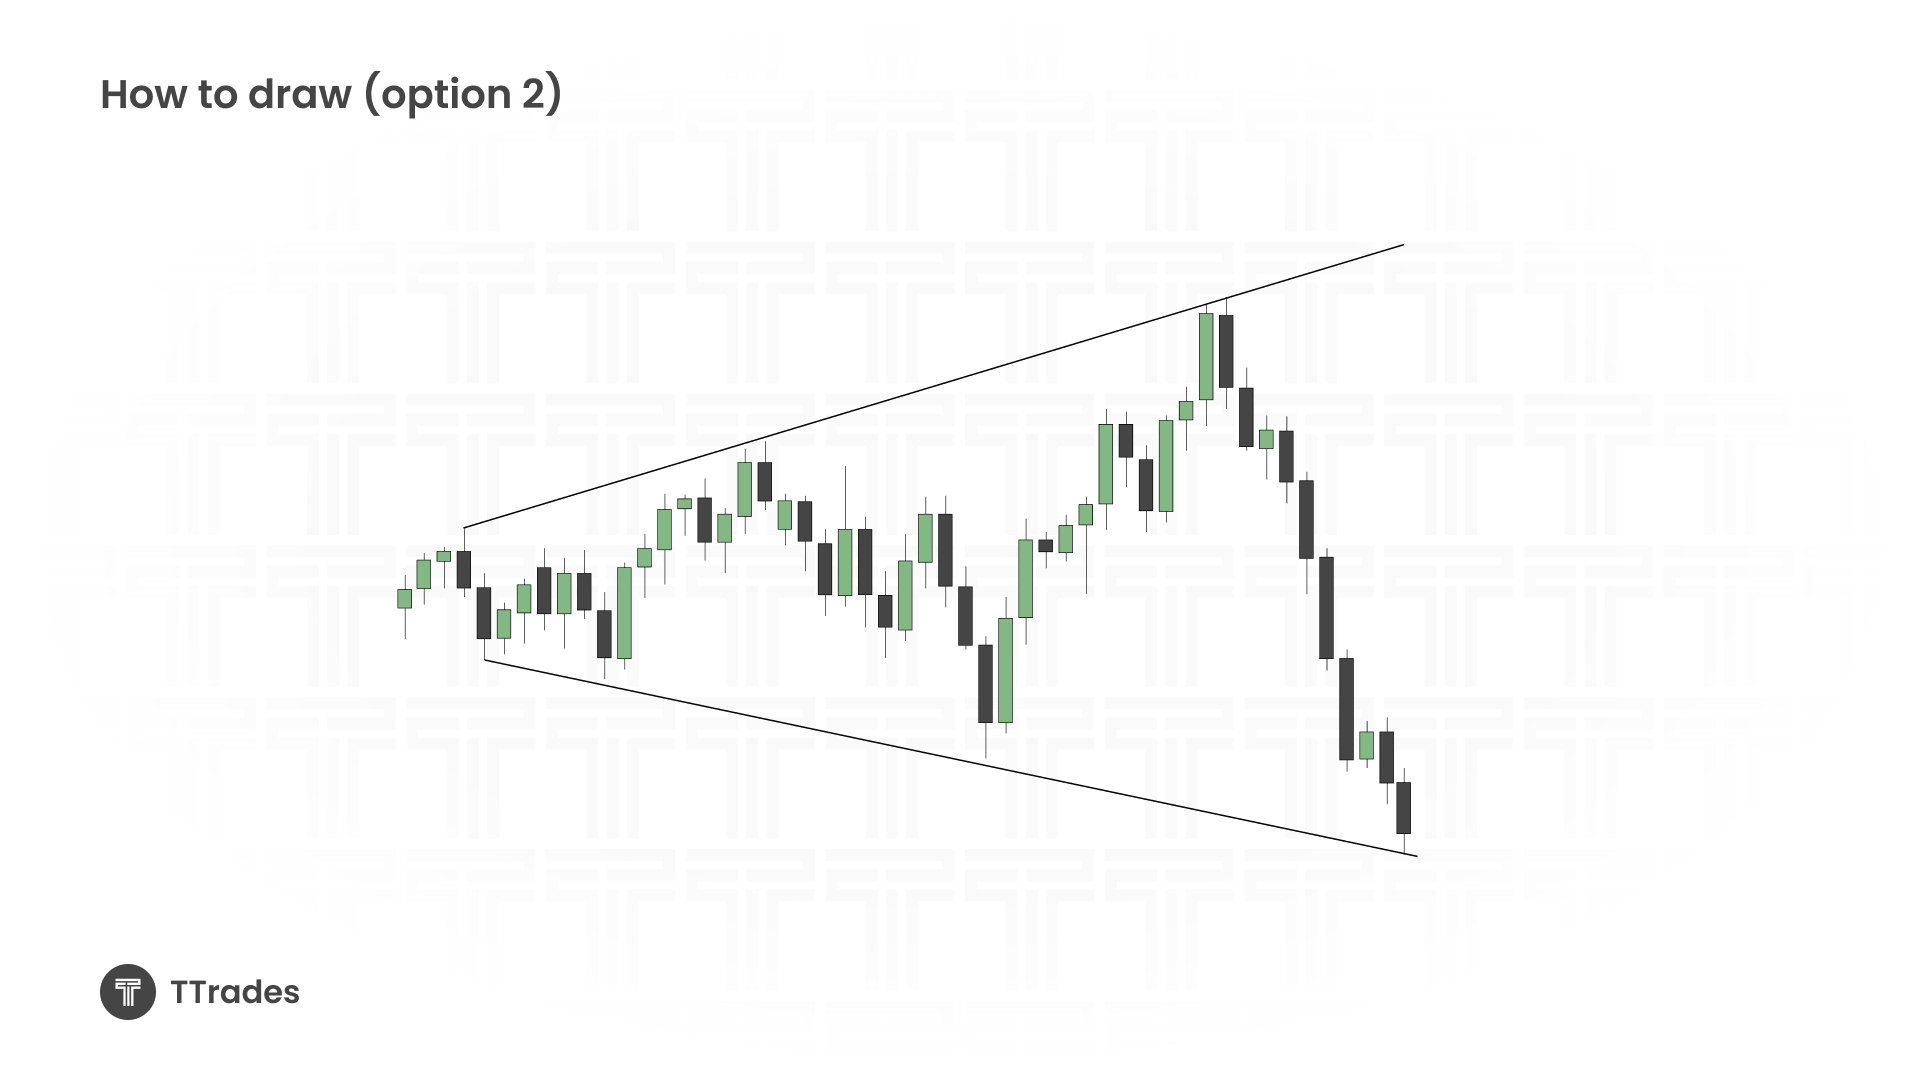
- Liquidity-Based Method
Identify buy-side and sell-side liquidity sweeps
Each time liquidity is taken, extend a line from that point
Continue this process as price expands, building out the broadening formation step by step
This approach keeps you focused on liquidity hunts rather than arbitrary points.
Using Broadening Formations in Real Time
Range Play: Expect price to move from one side of the range to the other
Targets: Use the edges of the broadening formation as liquidity targets
Support/Resistance Flip: If a breakout holds, that side may serve as support or resistance
SMT Divergence: Look for SMT confirmation at the edges to refine trade entries
Example:
If price sweeps sell-side liquidity, fails to displace lower, and equal highs form above, both ICT logic and broadening formation logic suggest targeting the buy-side.
Combining with ICT Concepts
Broadening formations become more powerful when combined with other ICT tools:
Power of Three (Accumulation, Manipulation, Distribution)
The broadening formation often reflects the manipulation phase, where both sides of liquidity are swept before a directional move.Discount and Premium
Mark equilibrium levels of the initial range. Price often reverts to equilibrium if higher time frame order flow aligns.Box Setup (Session Ranges)
Use Asia, London, and New York session highs/lows as the initial consolidation. A broadening formation around these sessions often frames the day’s liquidity hunt.
Broadening Formations on Higher Timeframes
On daily or higher charts, a broadening formation appears as an outside bar, where both the high and low of the previous day are taken. Extending these levels forward provides:
Reversal zones
Liquidity targets
Context for intraday setups
Example: If the daily candle takes both the prior high and low, intraday traders can treat that bar as a higher-timeframe broadening formation.

Broadening Formations in the Seek & Destroy Daily Profile
The ICT Seek & Destroy profile thrives on identifying false breakouts. Broadening formations naturally complement this idea.
If London sweeps Asia’s high and low without displacing, expect New York to respect London’s range as a new broadening formation
If multiple sessions fail to displace, the daily profile may remain choppy, and broadening formations help frame liquidity hunts throughout the day
These setups are especially effective during quieter news days or when the market is anticipating a major economic event. In those conditions, broadening formations often frame the back-and-forth liquidity hunts that define the day’s structure.
Final Thoughts
Broadening formations are more than just chart patterns. They provide a clear way to see how price sweeps liquidity, fails to break out, and shifts direction. When combined with ICT concepts such as SMT, Power of Three, session ranges, and higher timeframe outside bars, they become a reliable tool for anticipating price behavior. Instead of being caught off guard by choppy price action, you can recognize the natural rhythm of expansion and reversal within the market.