
Introduction
Relative strength and weakness is one of the most practical tools you can use when trading correlated assets. The objective is simple. You want to be longing the stronger asset and shorting the weaker one. When you understand how to properly identify which market is leading and which is lagging, your trade selection becomes much clearer.
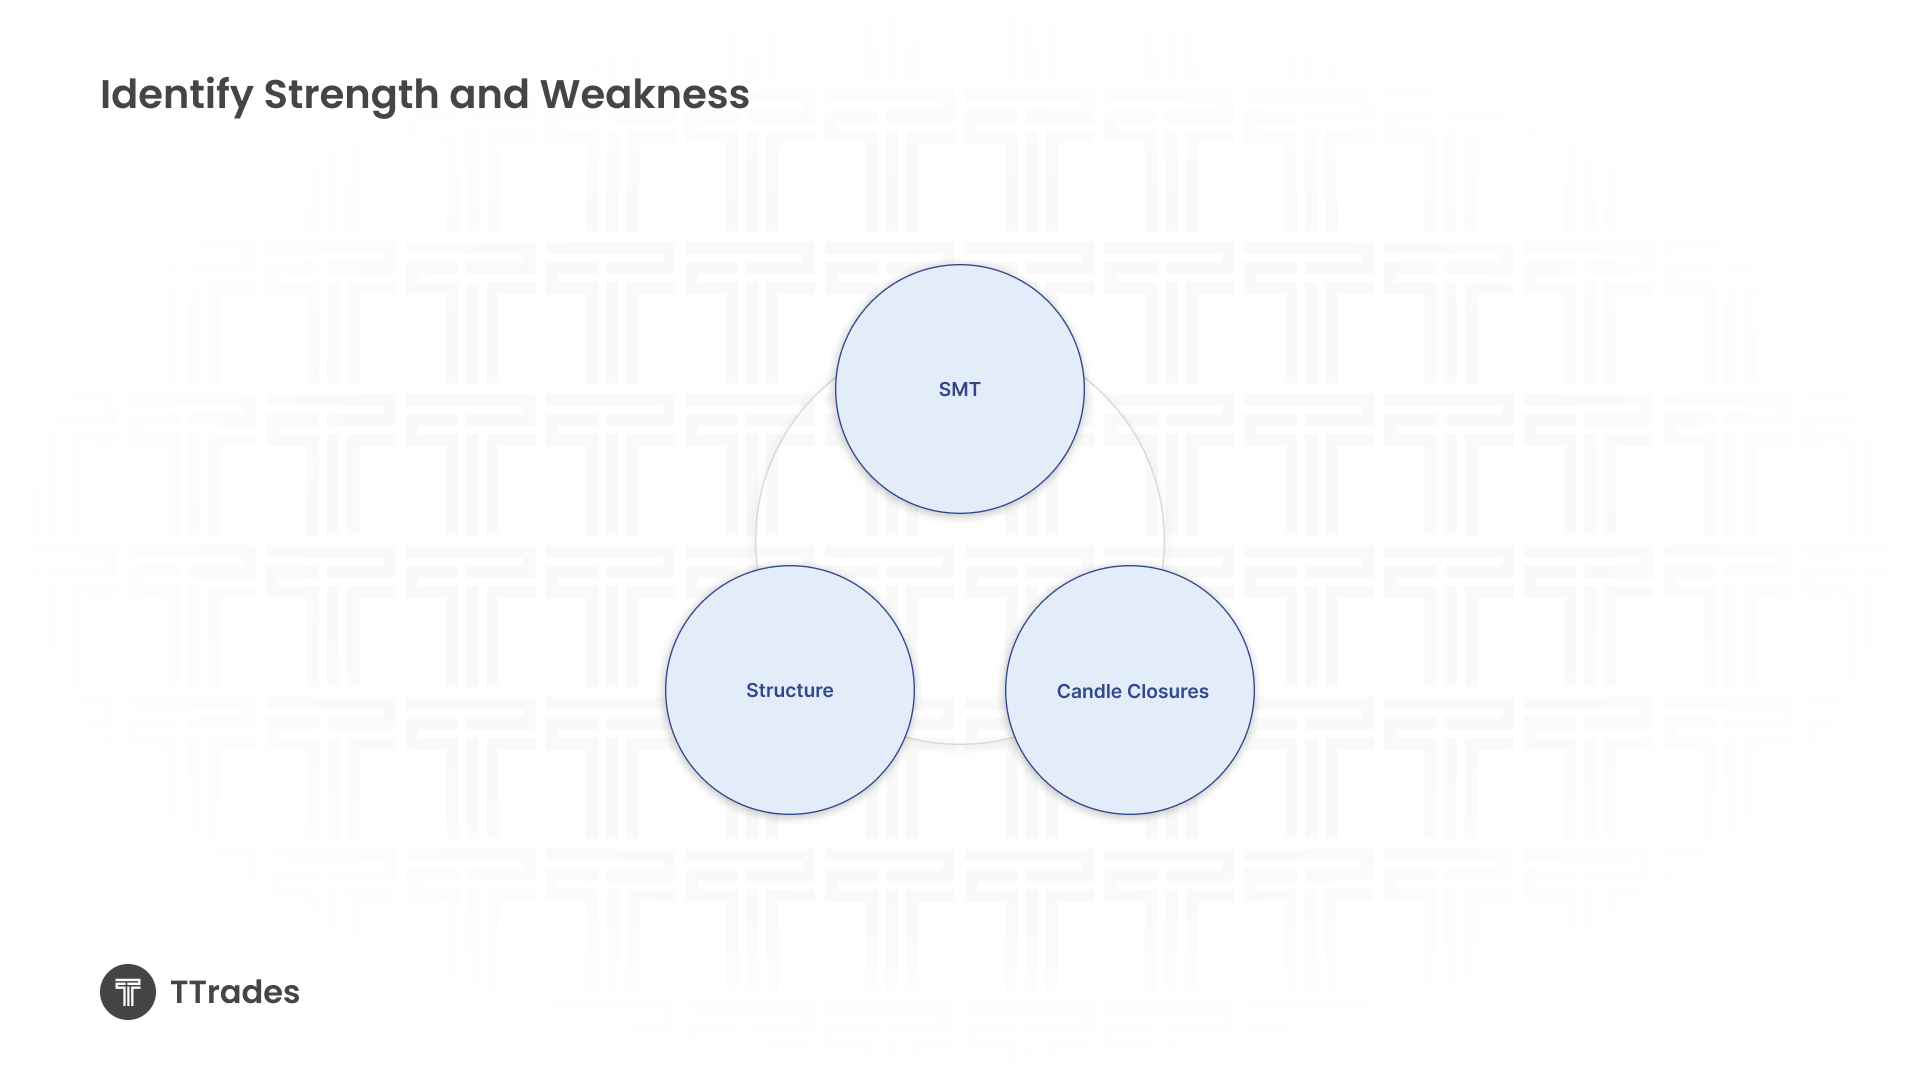
There are three core components used to determine relative strength and weakness. SMT, structure, and candle closures. When you learn how to combine them, you gain a powerful decision making filter that helps you focus on the right instrument instead of guessing.
Understanding Correlated Assets
This concept only works with correlated assets. These are markets that generally move in the same direction and share similar structure.
For example, the S&P 500 and the NASDAQ typically trend together. Gold futures and Silver Futures often move similarly as well. Because they are correlated, they should form similar highs and lows. When they do not, that difference reveals information.
That difference is where opportunity exists.
SMT: The Clearest Form of Relative Strength
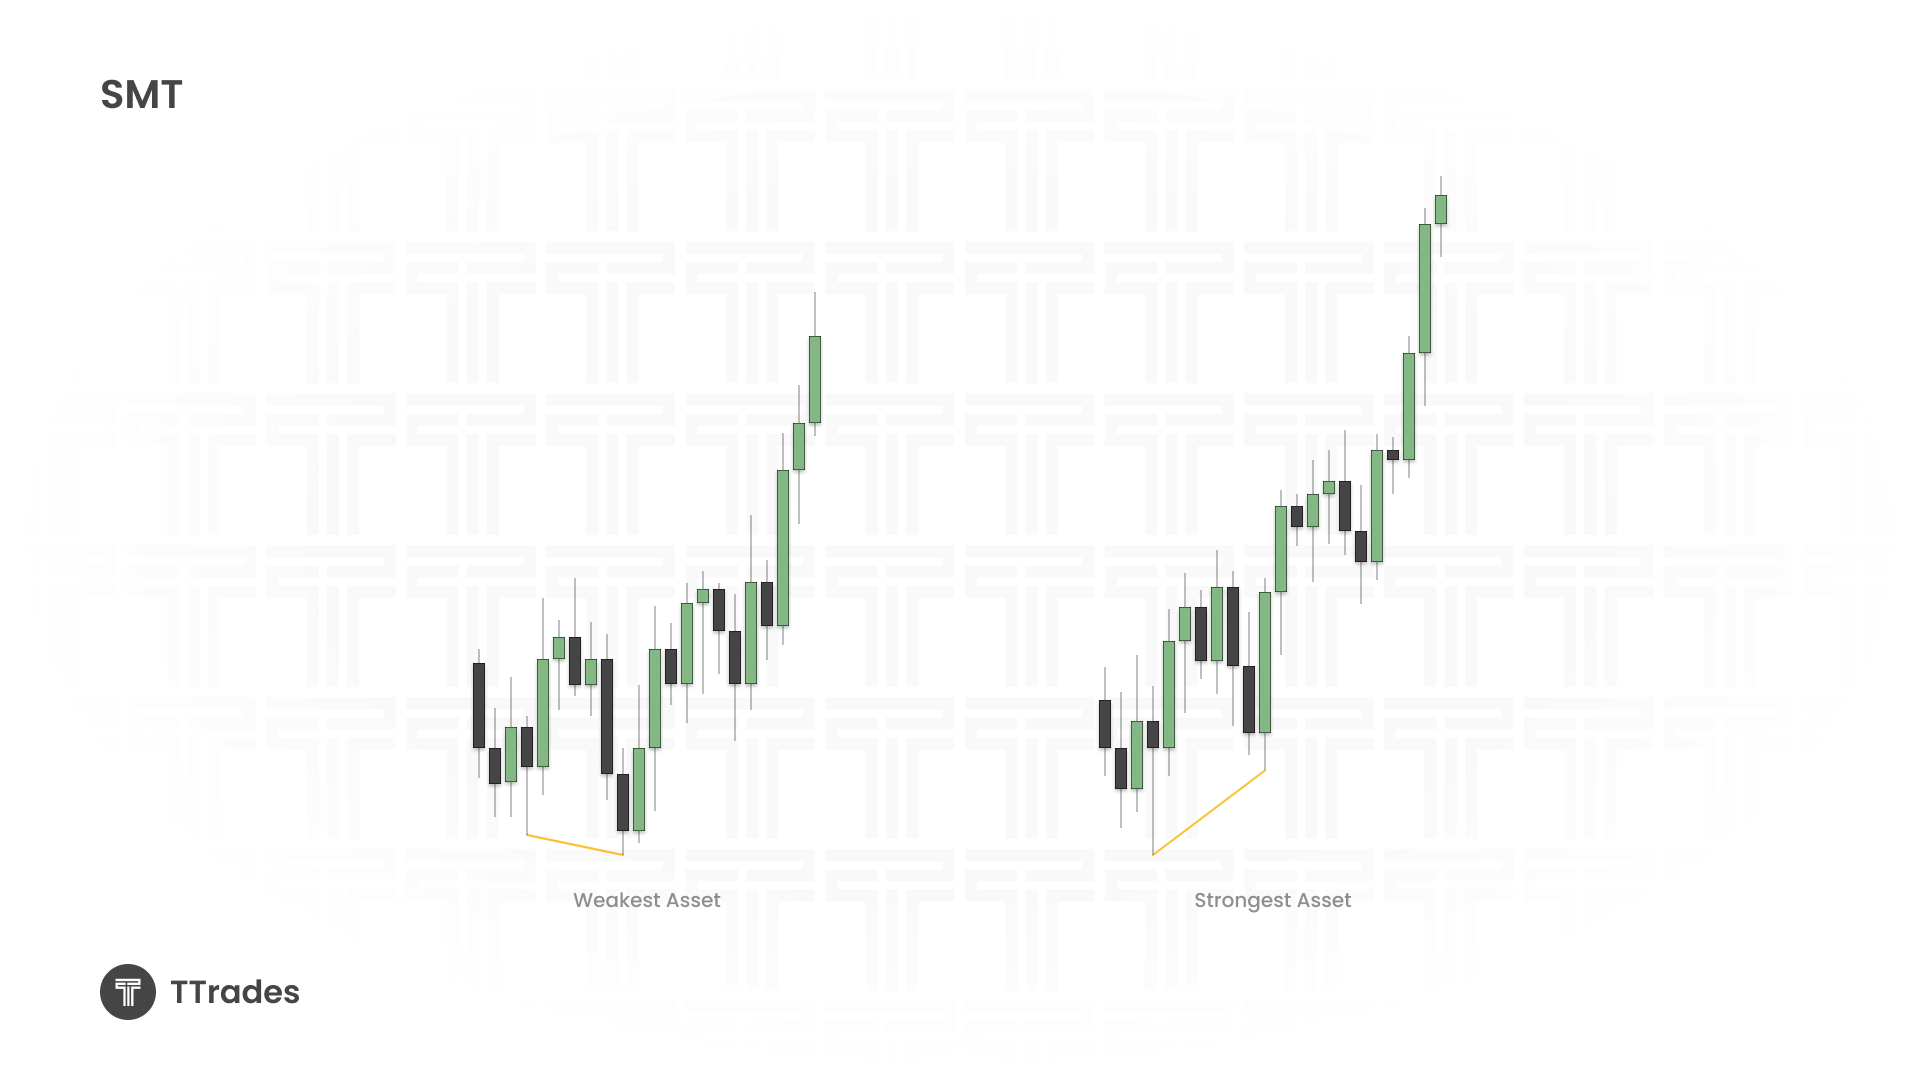
SMT simply means there is a difference in structure between two correlated assets.
If one asset makes a higher low while the other makes a lower low, the one making the higher low is stronger. The one making the lower low is weaker.
In a bearish scenario, flip the logic. If one makes a lower high and the other makes a higher high, the one failing to expand upward is weaker.
SMT is the easiest signal to spot because it is very visual. One market expands structurally while the other fails. When this happens, you already know where your directional focus should be.
If you are looking for longs, focus on the stronger asset. If you are looking for shorts, focus on the weaker one.
Structure and Separation
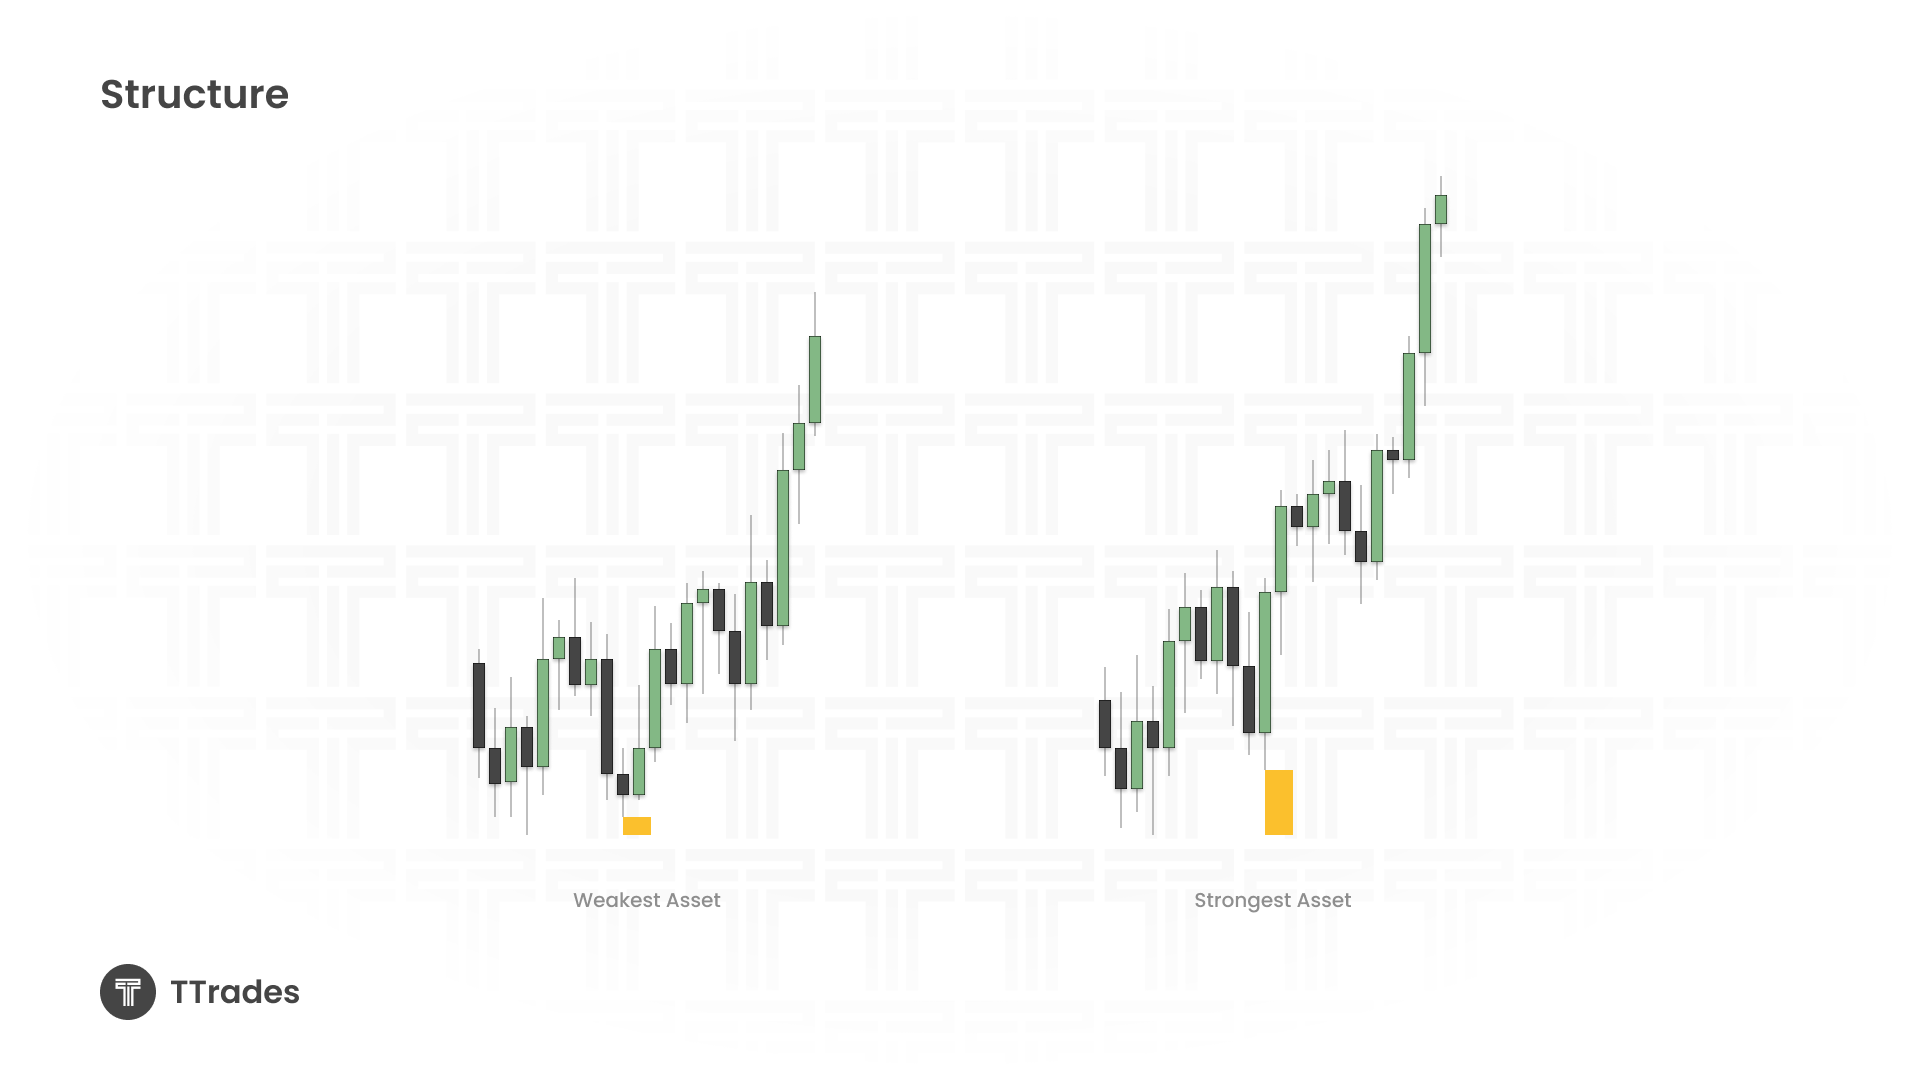
Sometimes both assets make the same structural move. They both create higher lows or both create lower highs. In that case, there is no clear SMT divergence.
This is when you use separation.
Look at the previous extreme low or high. Then measure how far the new retracement is from that level.
If one asset creates a higher low that is clearly separated from the previous low, while the other pulls back very close to the previous low, the one with more separation is stronger.
The greater the distance from prior liquidity, the stronger the structure.
Separation is subtle but extremely effective when SMT is not obvious.
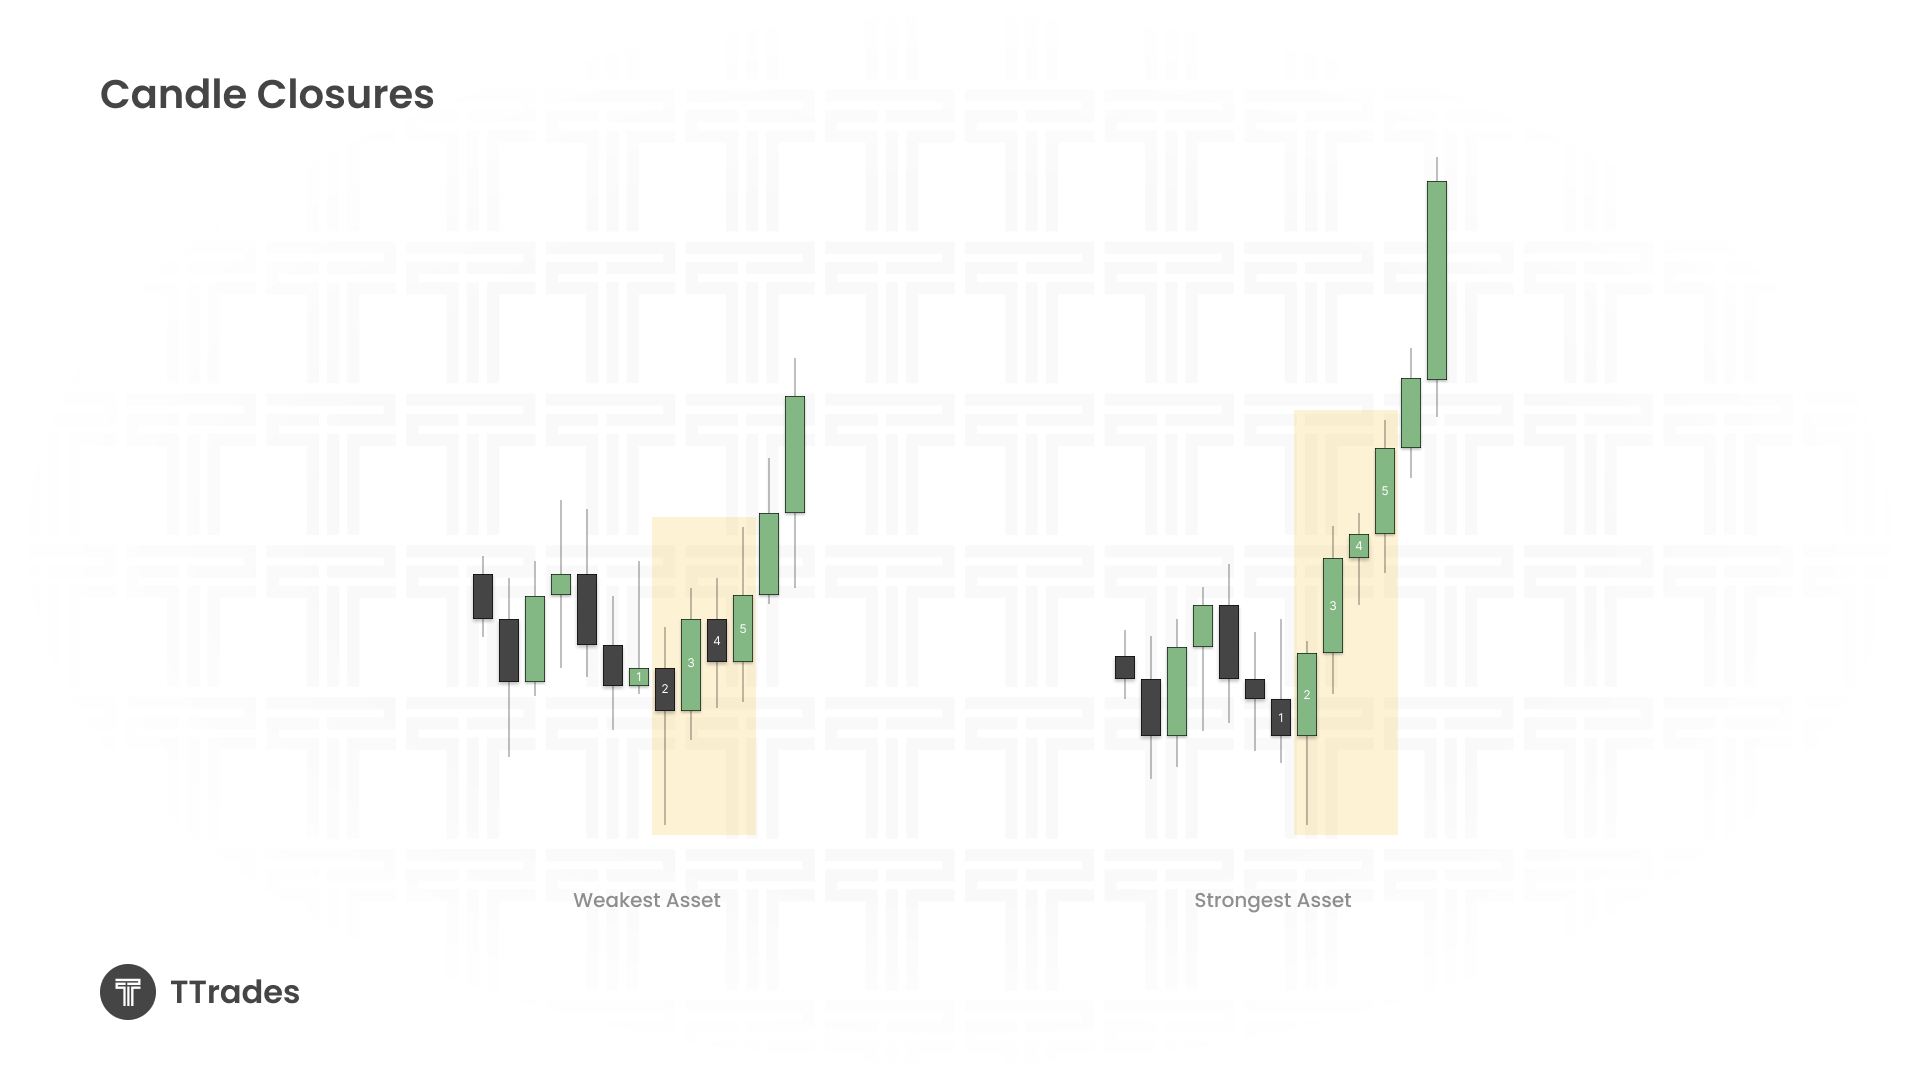
Candle Closures: The Advanced Confirmation
Candle closures add a deeper layer of confirmation.
Two assets can sweep the same low, but how they close tells the real story. If one closes strongly bullish above prior candle bodies and the other closes weakly or prints a doji, the stronger close reveals stronger participation.
Strong bullish closures after liquidity sweeps suggest buyers are stepping in aggressively. Weak closures suggest hesitation or continued pressure.
You should pay close attention to candles that validate continuation or signal a shift in delivery. If one asset closes beyond a key level with conviction and the other fails to do so, that difference matters.
Candle behavior often reveals strength and weakness before the larger expansion move occurs.
Combining All Three
The real power comes from stacking confirmations.
First look for SMT. If it is present, that is your primary clue.
If SMT is not present, evaluate structural separation.
Then use candle closures to confirm which asset is truly showing conviction.
When all three align, the direction becomes much clearer. You are not just trading a bias. You are selecting the asset that is most likely to deliver expansion.
Strength Can Rotate
One important thing to understand is that strength is not permanent.
An asset that was stronger during one leg of the move can become weaker during consolidation. Candle closures can shift. Separation can narrow. New SMT can appear in the opposite direction.
Relative strength must be evaluated continuously, not assumed.
Final Thoughts
Relative strength and weakness should not be used as a standalone strategy. It is a refinement tool. You still need higher timeframe bias, structure, and a defined entry model.
What this concept does is help you choose which correlated asset deserves your attention.
When you consistently focus on the stronger asset for longs and the weaker asset for shorts, you stop fighting momentum and start aligning with it.
That alignment alone can dramatically improve your consistency.