
Introduction
In this breakdown, we’re going to walk step by step through kill zones, also known as trading sessions, and explain why they matter so much in day trading. We’ll cover the timing of each session, how they differ between Forex and Indices, how to mark them manually and automatically in TradingView, and how volatility behaves during these windows. We’ll finish by touching on the Silver Bullet and how it fits into the larger framework.
This is designed to be practical, instructional, and easy to follow, whether you’re brand new to trading or looking to refine your model.
Understanding Time Zones and Chart Setup
Before anything else, it’s important to clarify that all times referenced are in New York time, also known as Eastern Standard Time (EST).
Daylight savings can cause confusion, so the simplest solution is to confirm your TradingView chart is set to New York time. Once your chart is aligned correctly, all kill zones will line up as intended.
If your time zone is off, your analysis will be off.
What Are Kill Zones?
Kill zones are specific time windows during the trading day when volatility increases. This increase in volatility creates better conditions for price expansion, resulting in higher probability setups.
These windows align with major global trading sessions. Asia, London, and New York. Each playing a different role in how price develops throughout the day.
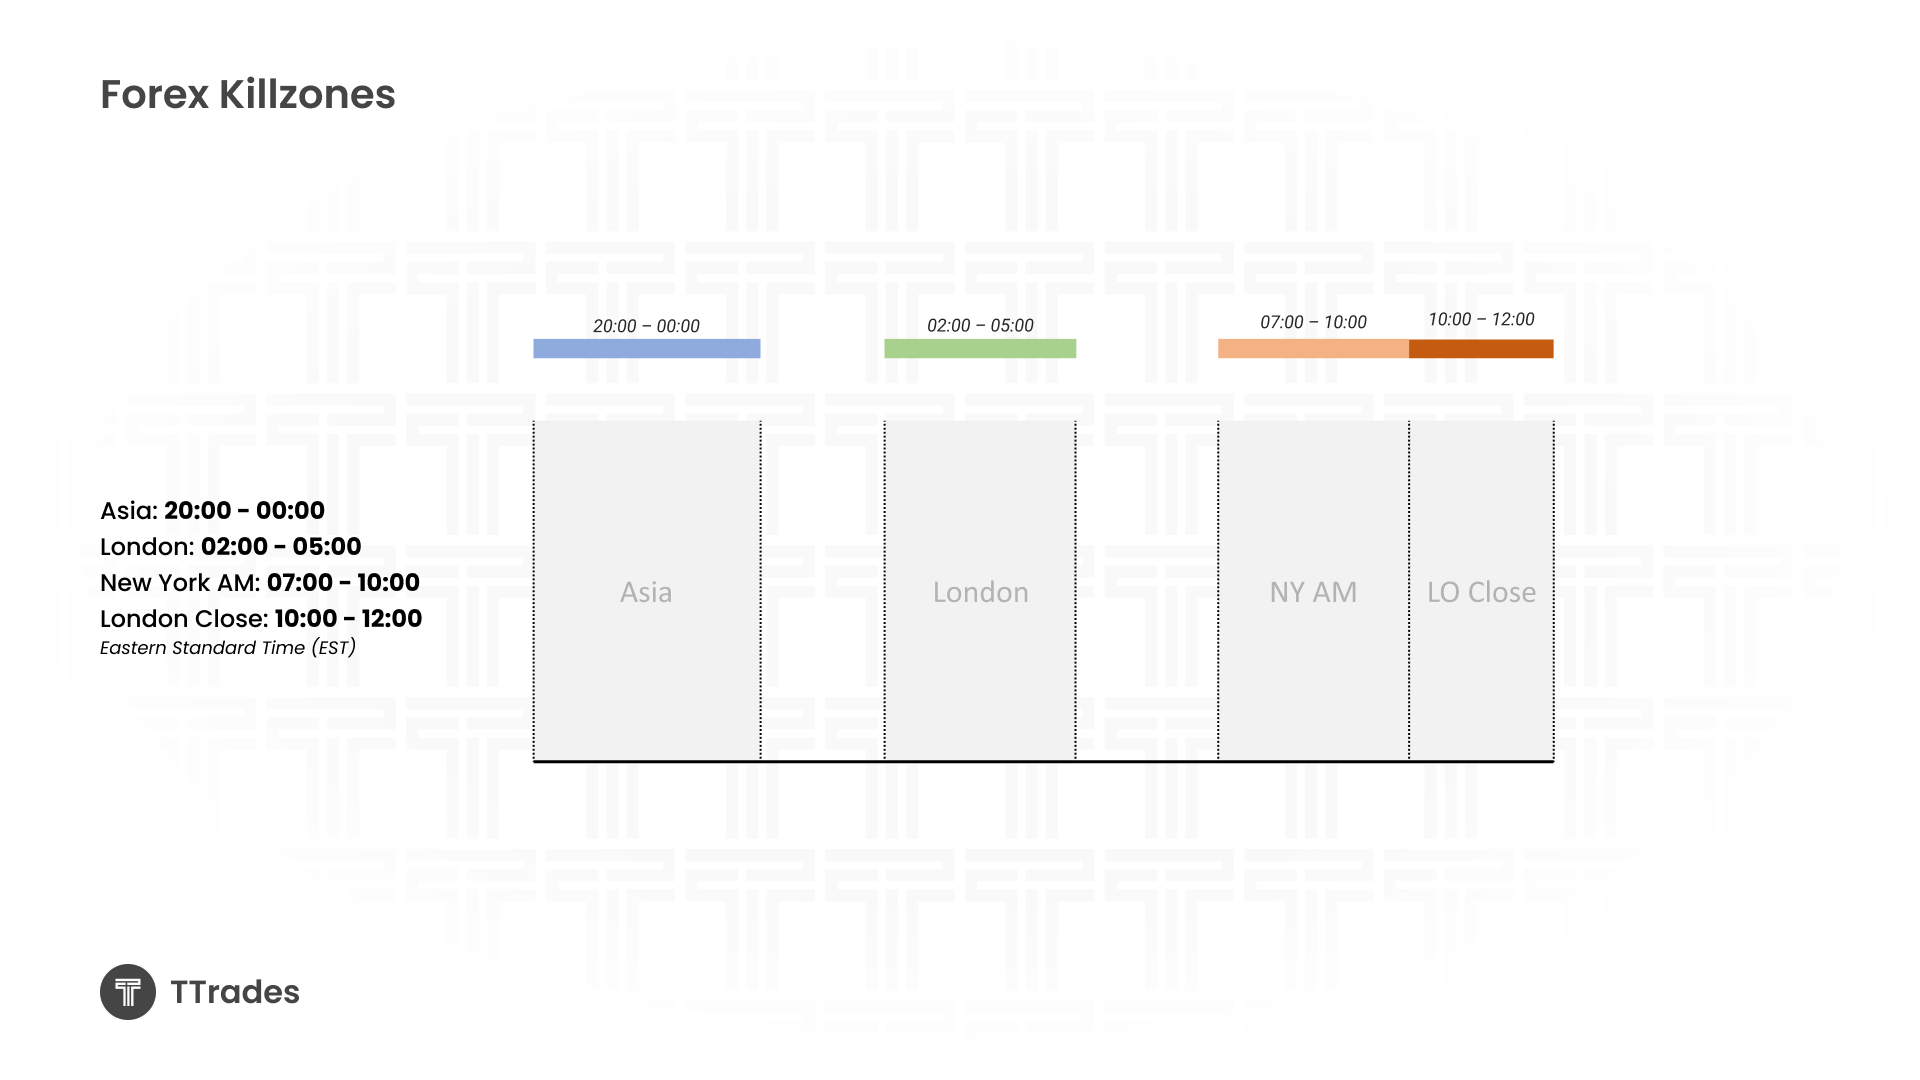
Forex Kill Zones Timing
For Forex, the primary kill zones are based on four key windows during the trading day.
The Asia session runs from 20:00 to 00:00.
The London session runs from 02:00 to 05:00.
The New York AM session runs from 07:00 to 10:00.
London close is from 10:00 to 12:00.
These sessions often reflect an accumulation, manipulation, and distribution cycle that repeats across many trading days.
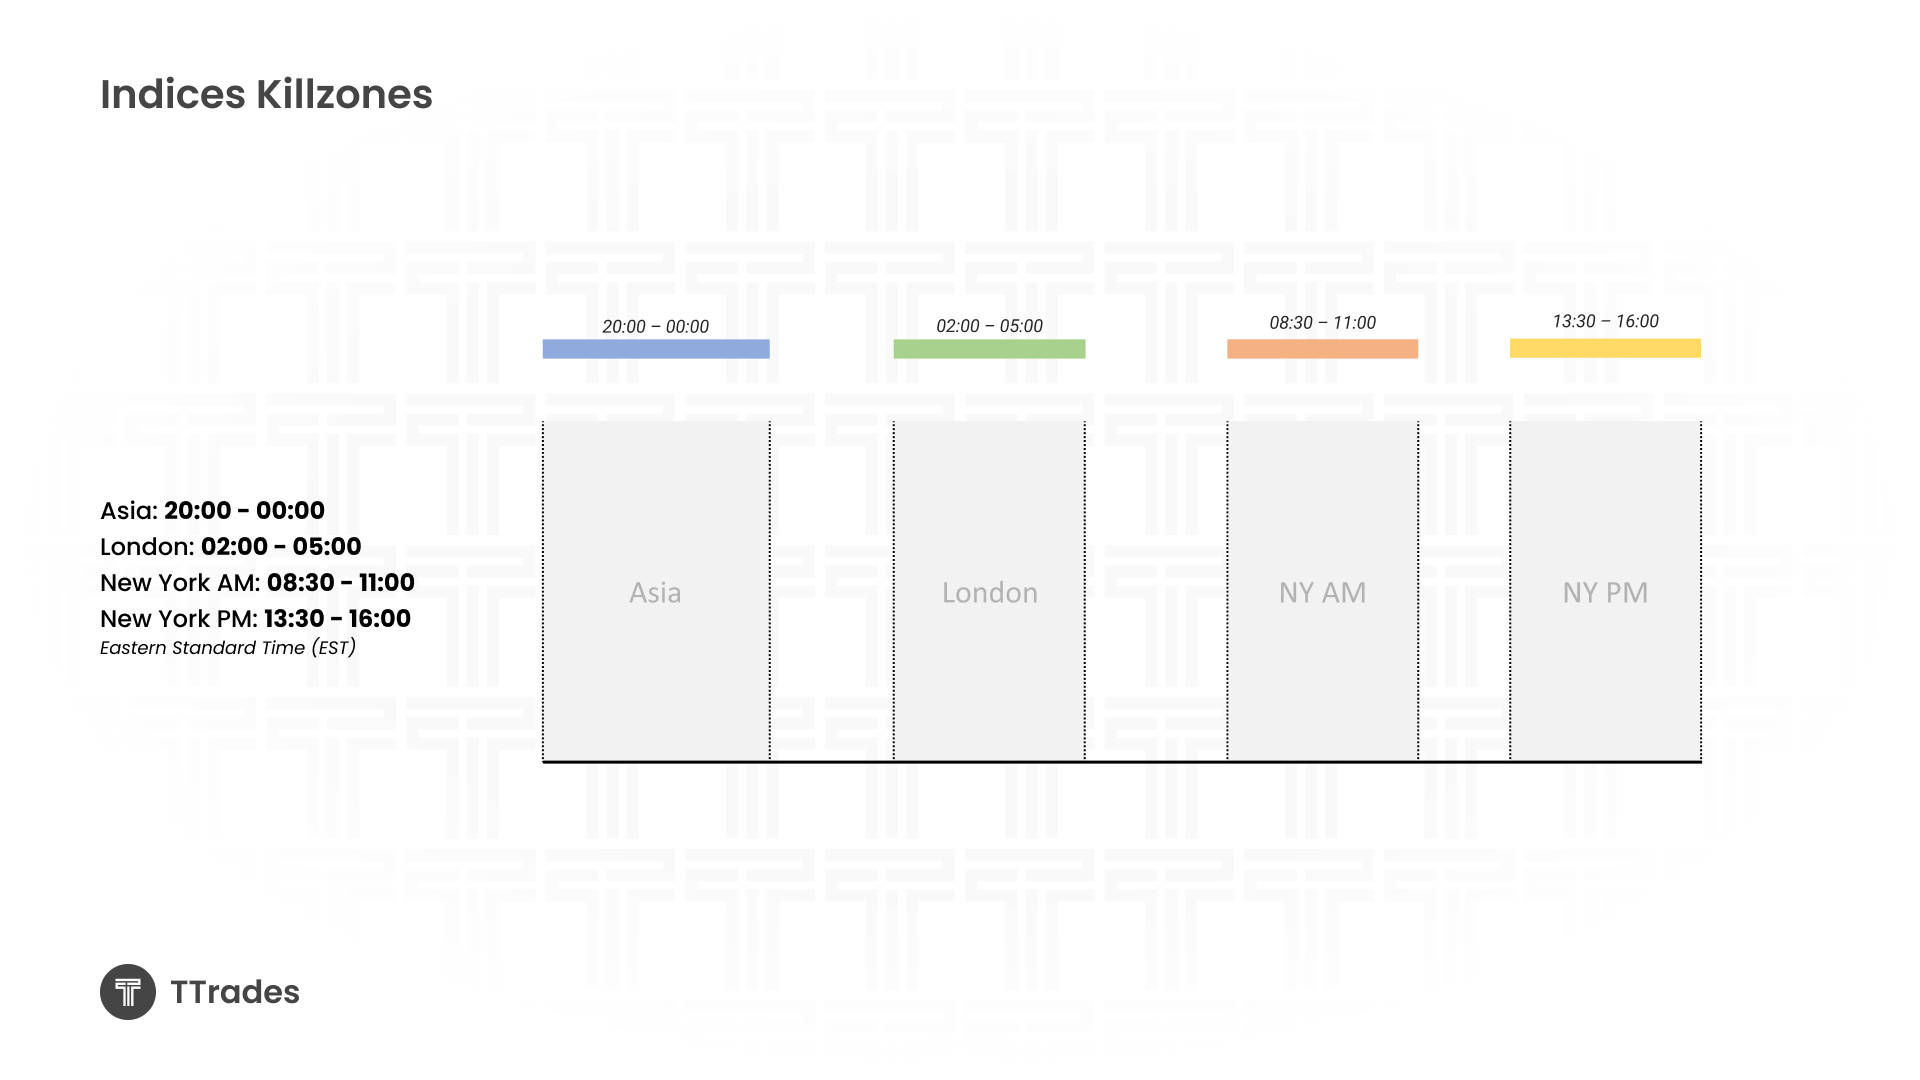
Indices Kill Zones Timing
Indices follow the same Asia and London sessions, but the New York sessions are slightly different.
The Asia session runs from 20:00 to 00:00.
The London session runs from 02:00 to 05:00.
The New York AM session runs from 08:30 to 11:00.
The New York PM session runs from 13:30 to 16:00.
When trading indices, you will often notice that a large portion of the daily range is created during the New York AM session.
Manually Marking Kill Zones on the Chart
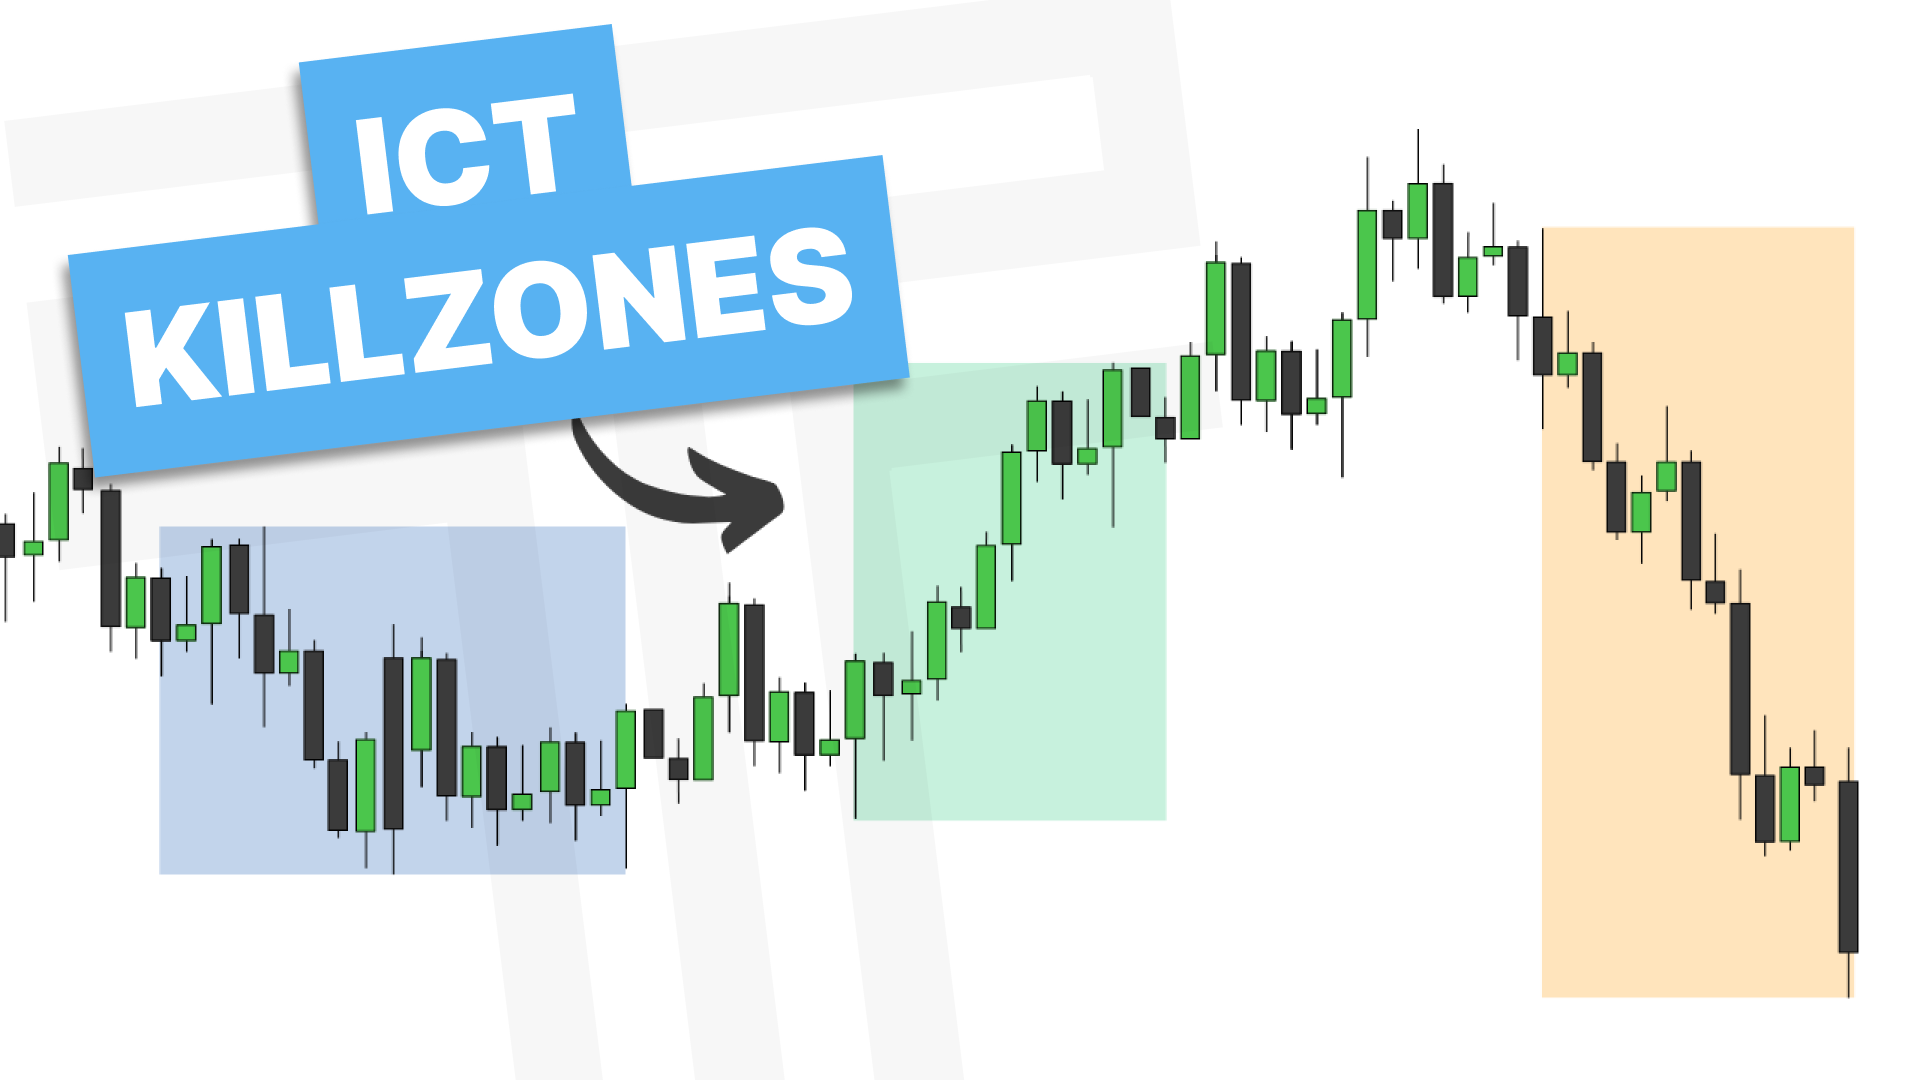
One of the best ways to understand kill zones is to mark them manually on your charts.
This involves using vertical lines to define the start and end of each session and boxing in the price range created during that time. Over time, this exercise makes session behavior very clear and easy to recognize.
When done consistently, you will start to notice that Asia often consolidates, London manipulates the range, and New York delivers expansion.
Automating Kill Zones with an Indicator
To save time, you can automate this process using the ICT Killzone and Pivots (TFO) indicator on TradingView.
After adding it to your chart, the most important settings involve session history, timeframe visibility, time zone alignment, and kill zone box visibility. Many traders prefer to turn session labels off to keep the chart clean and rely on color instead.
You can also customize each session’s color to match your personal workflow.
Kill Zone Pivots and Liquidity Levels
Kill zone pivots mark the highs and lows created during each session. These levels often act as important liquidity references throughout the trading day.
Session highs and lows are frequently used as targets, reversal zones, or areas where price reacts aggressively. They function similarly to daily and weekly highs and lows and often attract price later in the session.
Opening Prices and Time Stamps
The indicator also allows you to mark specific opening prices and time stamps.
Horizontal lines can be placed at important opens such as 08:30am or the 9:30 open. Vertical time stamps can be added at key moments like midnight or true day open. These references help align entries with institutional timing.
Using Kill Zones in Trade Scenarios
High probability setups tend to occur inside kill zones rather than outside of them.
Kill zones also help frame larger concepts such as power of three and the daily open, high, low, and close.
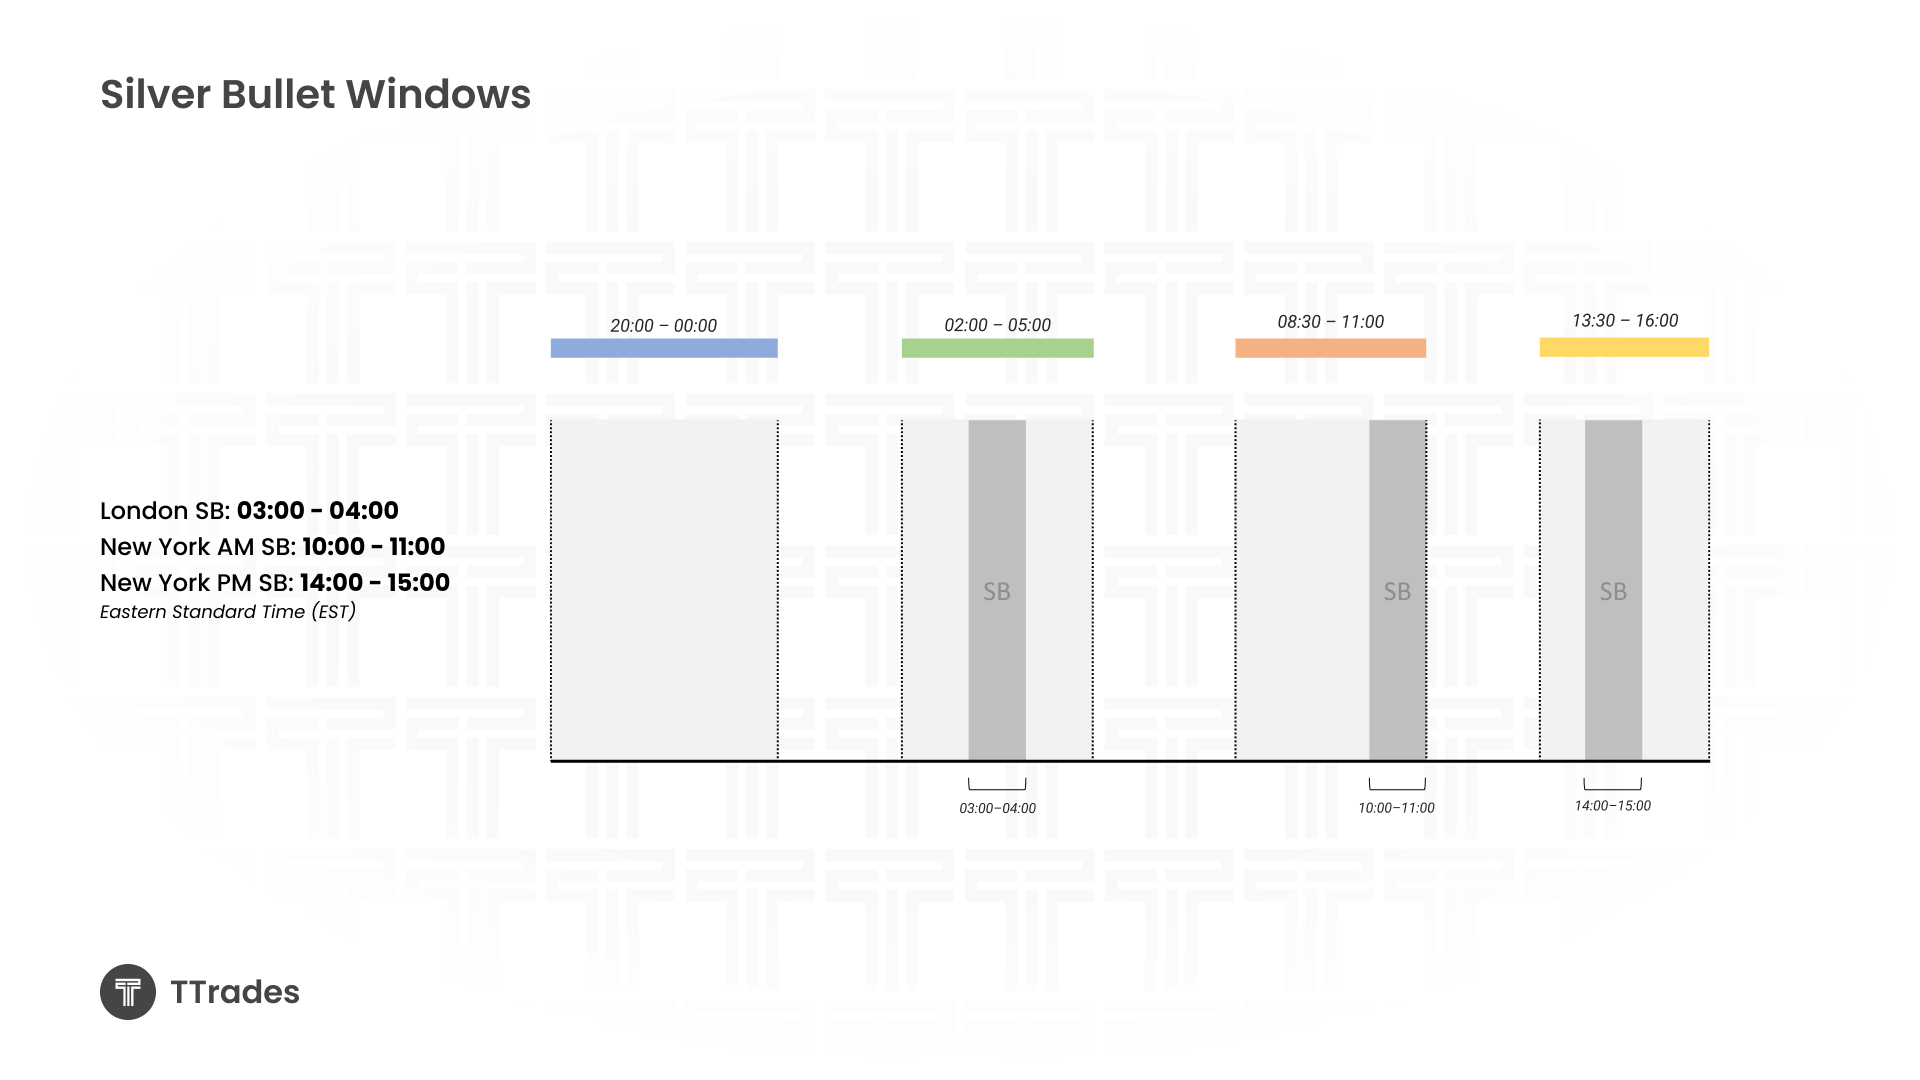
The Silver Bullet Explained
The Silver Bullet further narrows kill zones into a one hour window, still based on New York time.
Within this window, traders look for price to draw toward liquidity, show displacement, and react from imbalance or key levels. The Silver Bullet is not a standalone strategy but rather a timing refinement tool.
You can mark the Silver Bullet using vertical time stamps or by adjusting a session box within the indicator to reflect the correct hour.
Final Thoughts
Kill zones give structure to the trading day. They help define when to focus, where liquidity is likely to form, and when expansion is most probable. When combined with sound market structure and liquidity concepts, kill zones become a framework rather than just a timing tool.