
Introduction
In this blog, we’re breaking down one of the simplest and most consistent draws on liquidity you’ll find in the market: previous day high and previous day low. This concept shows up almost every trading day and can dramatically simplify how you frame daily bias, targets, and lower time frame entries.
Understanding the Core Idea
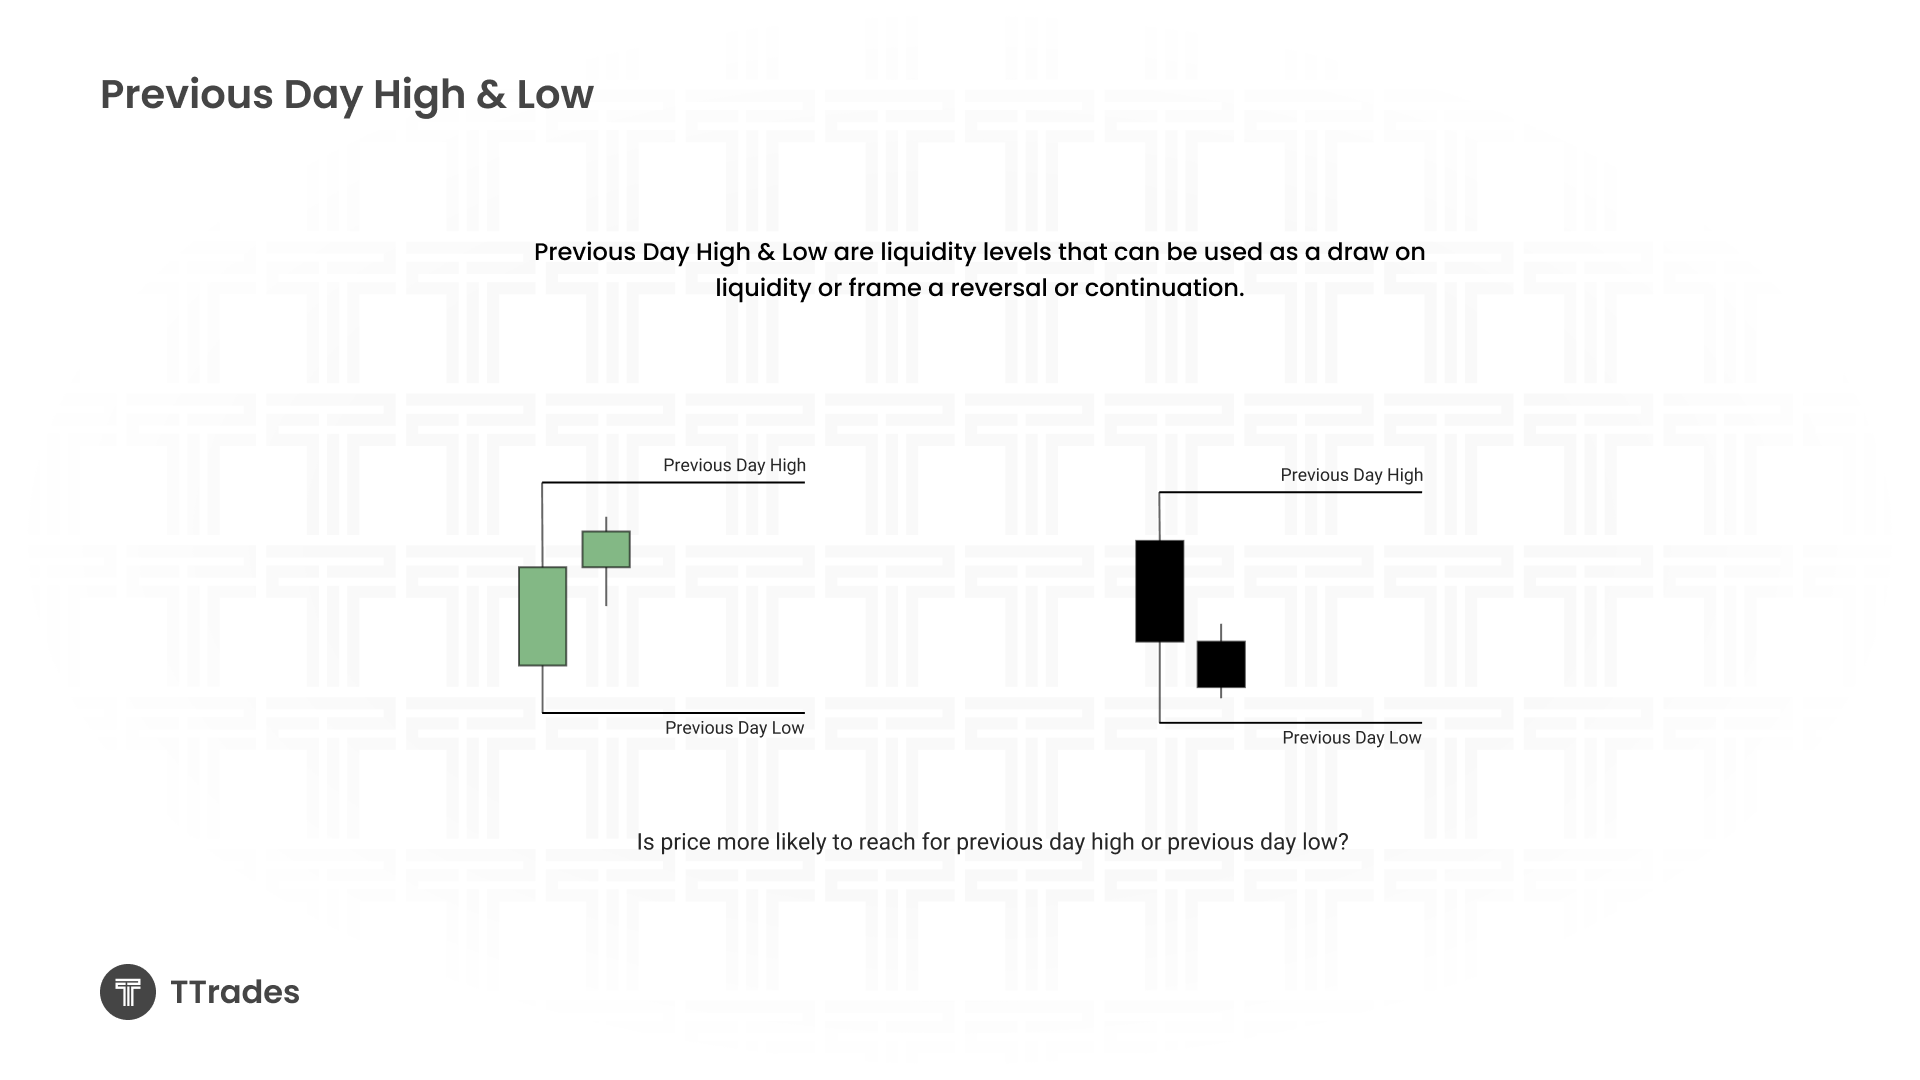
Unless price is stuck in a tight consolidation where neither side of the range is taken, price is usually reaching for liquidity. Most of the time, that liquidity is found at previous day high, previous day low, or sometimes both.
By staying out of consolidations and identifying whether price is trending up or down, we can anticipate which side of liquidity is more likely to be taken.

How Trend Defines the Draw on Liquidity
The easiest way to define trend is very simple.
In a bullish trend, price repeatedly takes previous day highs.
In a bearish trend, price repeatedly takes previous day lows.
If price keeps reaching for previous day high day after day, we are trending up. If price keeps reaching for previous day low day after day, we are trending down. No complicated indicators are required.
Trend Explained
When higher time frame arrays such as fair value gaps or order blocks are supporting price higher, continuation is expected. This means marking out previous day high and anticipating price to reach it. If price closes above it, the expectation is for the next day’s high to be targeted again.
This repeated behavior is what confirms bullish structure.
In a bearish trend, the logic flips. Price seeks previous day lows. If a previous day low is not taken, there is usually a reason, often a fair value gap or another higher time frame inefficiency.
Using the Daily Chart to Frame Bias
When opening the daily chart, the first question to ask is whether price is more likely to reach previous day high or previous day low.
Once that question is answered, a clear draw on liquidity and a defined target already exist. From there, lower time frames are used to frame entries that align with that daily objective.
Displacement vs Failure to Displace
Another important factor is displacement around previous day high and previous day low.
Failure to displace above previous day high suggests a bearish bias toward previous day low. Failure to displace below previous day low suggests a bullish bias back into the range. Strong displacement through a level signals continuation.
For example, if price fails above previous day high and closes back below, the expectation becomes previous day low for the following session. If price displaces below previous day low, continuation lower is expected. If price fails to displace lower and reverses, previous day high becomes the likely draw.
This logic creates a clean and repeatable daily narrative.

Lookback Period
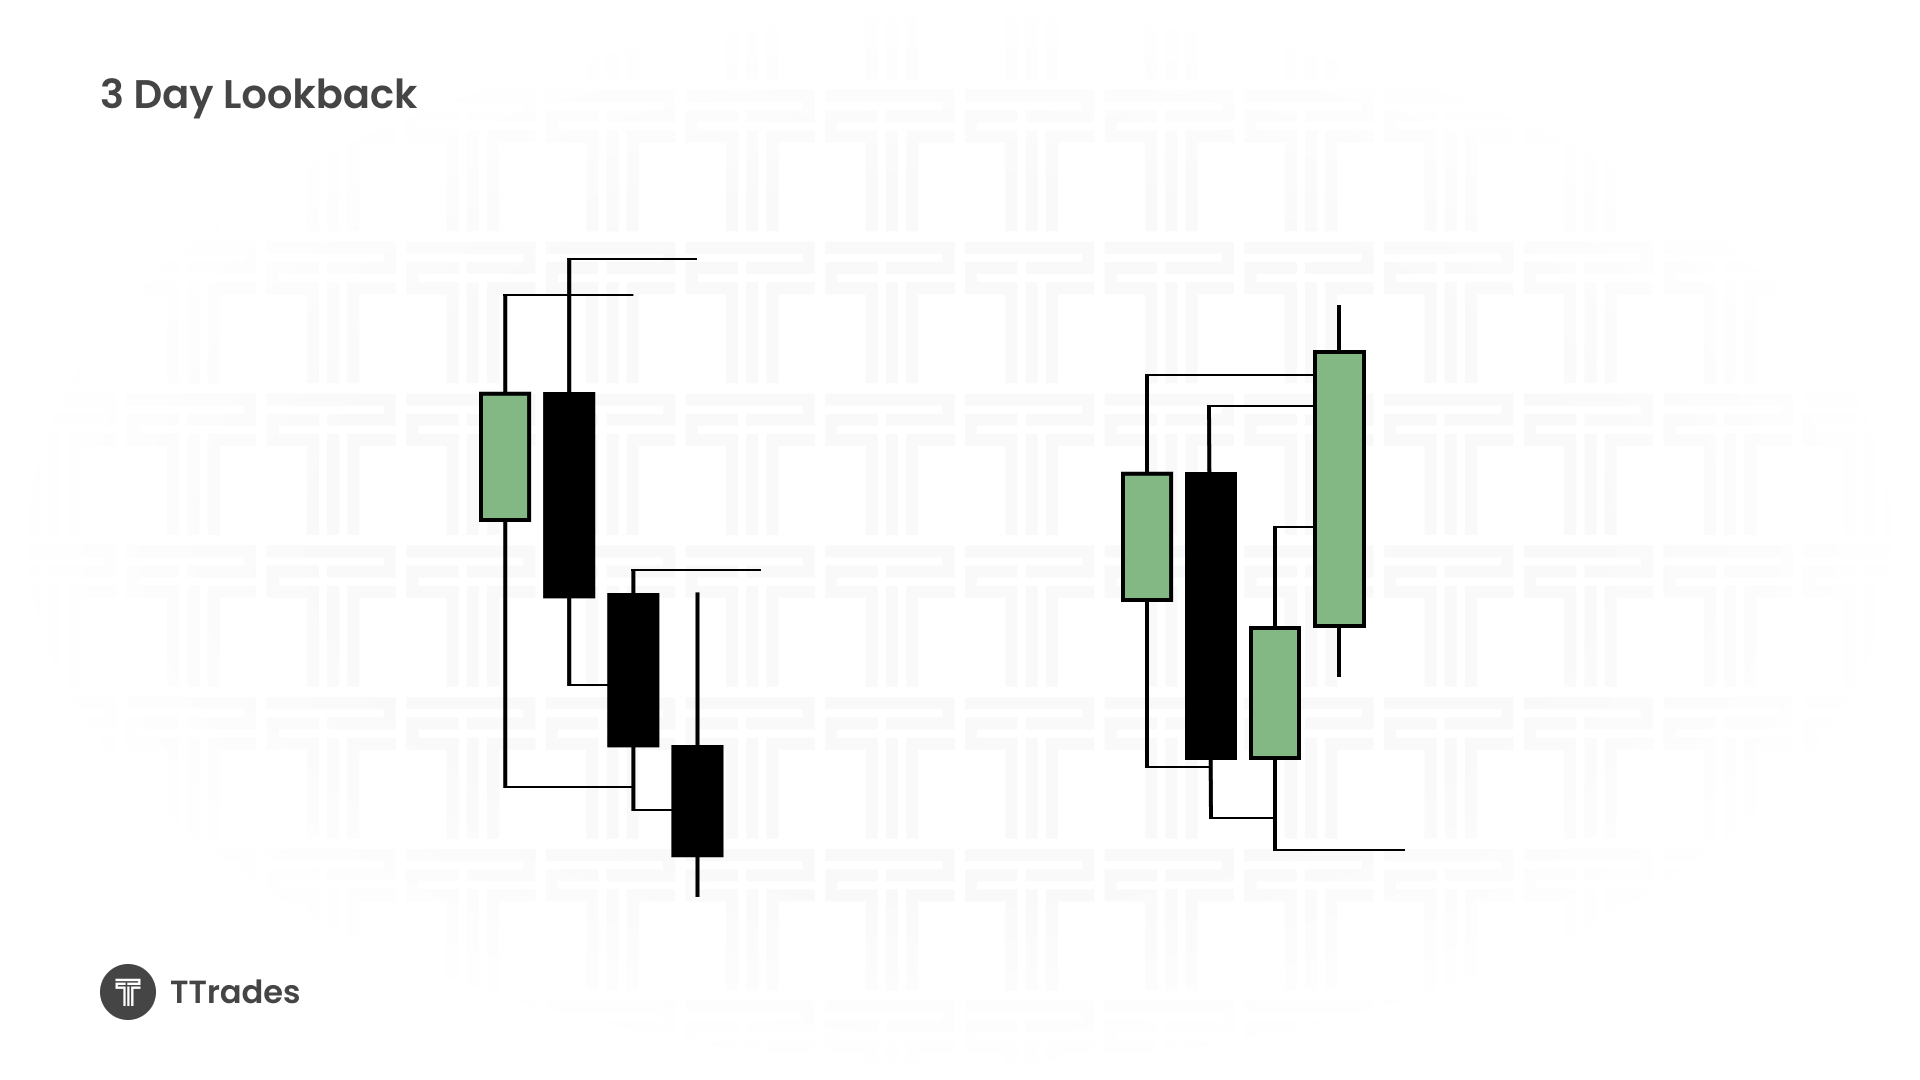
I personally look back three days.
On the current day, highs and lows from the previous three sessions are marked and extended forward. These levels frequently act as reaction points, support, resistance, or added confluence.
It is common to see price deviate below a prior day low, return to it, and then continue in the intended direction.
Final Takeaways
Previous day high and previous day low are simple, objective, and present almost every day.
When combined with trend, displacement, and daily structure, they form a powerful framework for bias and execution. Even with a clear draw on liquidity, patience is required. The goal is alignment, not forcing trades.