
Introduction
In this blog, we are breaking down ICT’s Power of Three, also known as Accumulation, Manipulation, and Distribution. This concept helps traders understand how intraday price action forms within a higher time frame candle, rather than relying on isolated patterns. We will walk through open high low close concepts, define AMD, explain how to identify it, and show how it plays out across time frames and trading sessions.
Open High Low Close and Open Low High Close
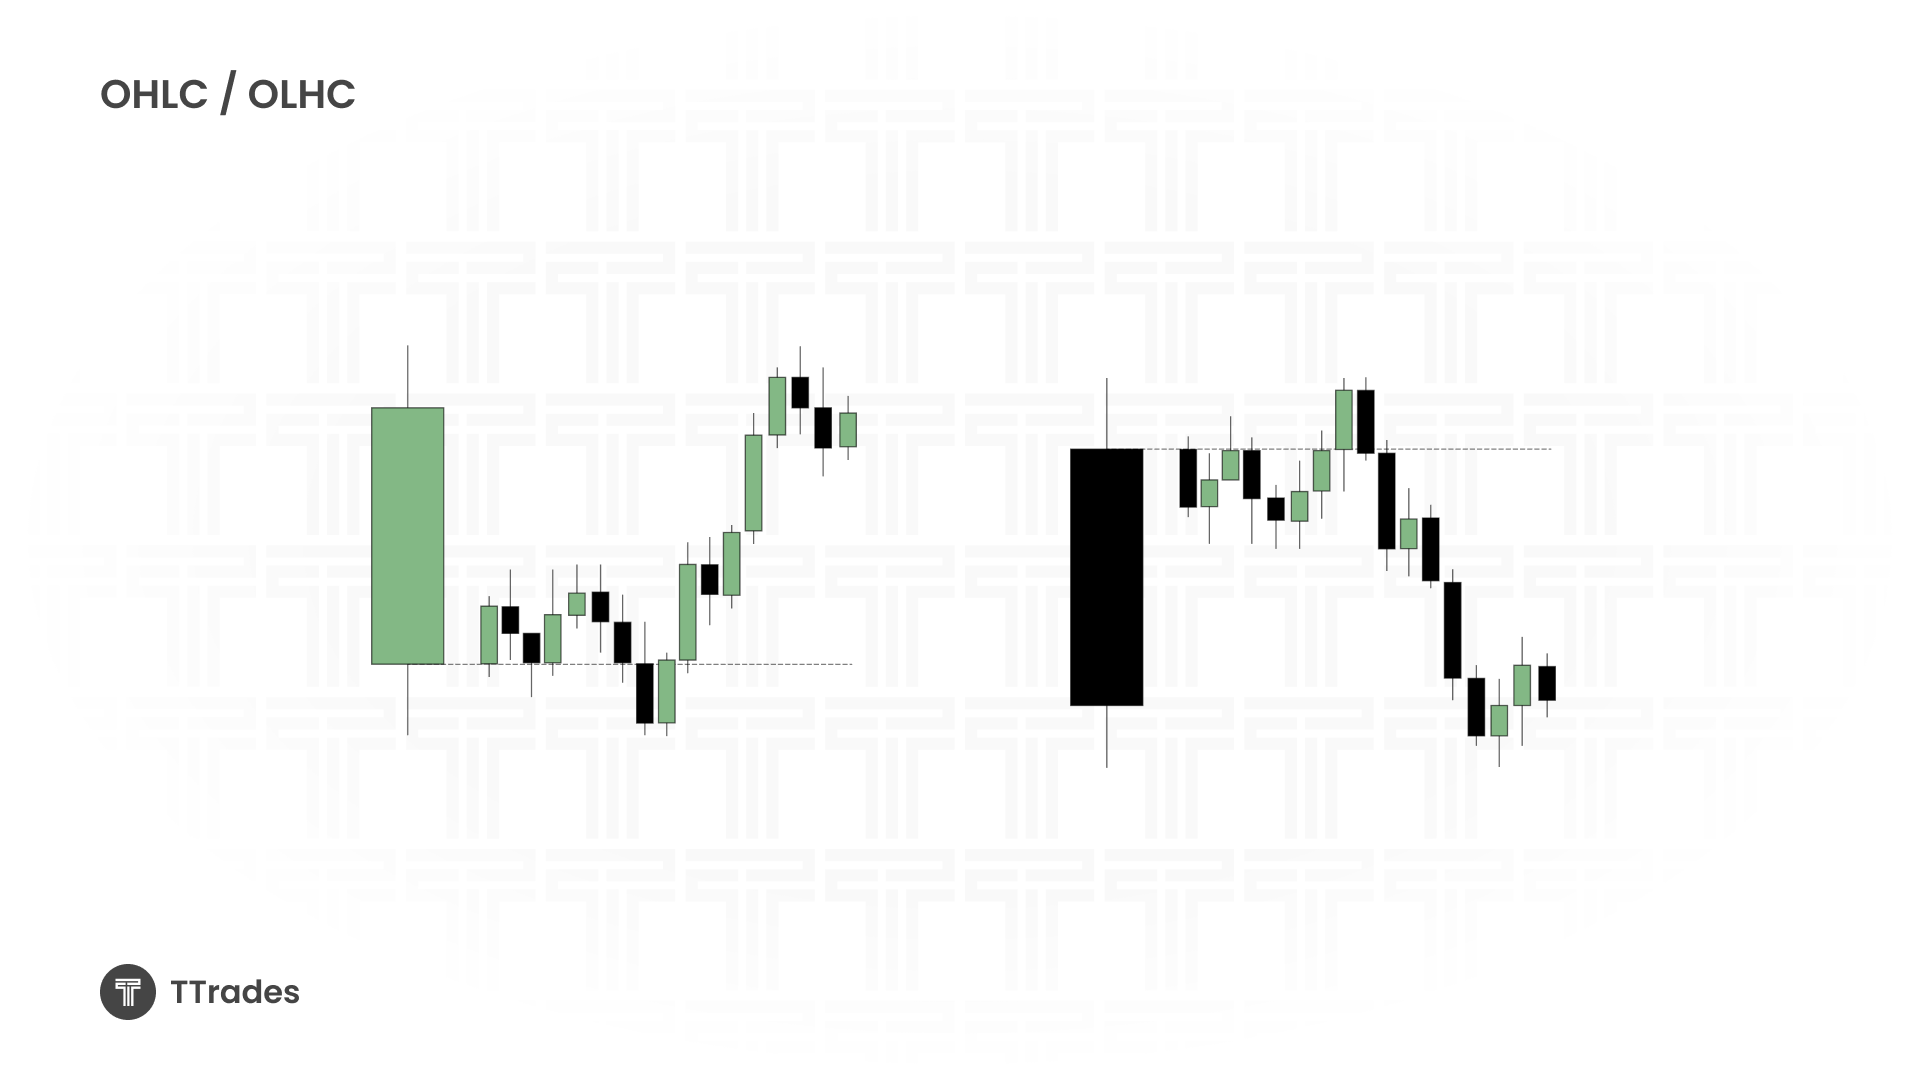
Open high low close and open low high close simply describe the sequence in which price forms a higher time frame candle, such as the daily.
In an open low high close scenario, price opens, trades lower, then expands higher before closing. In an open high low close scenario, price opens, trades higher, then moves lower before closing.
The objective is not to trade every intraday fluctuation, but to capture the expansion phase of the candle. That expansion is where the Power of Three becomes relevant.
What is Power of Three (AMD)
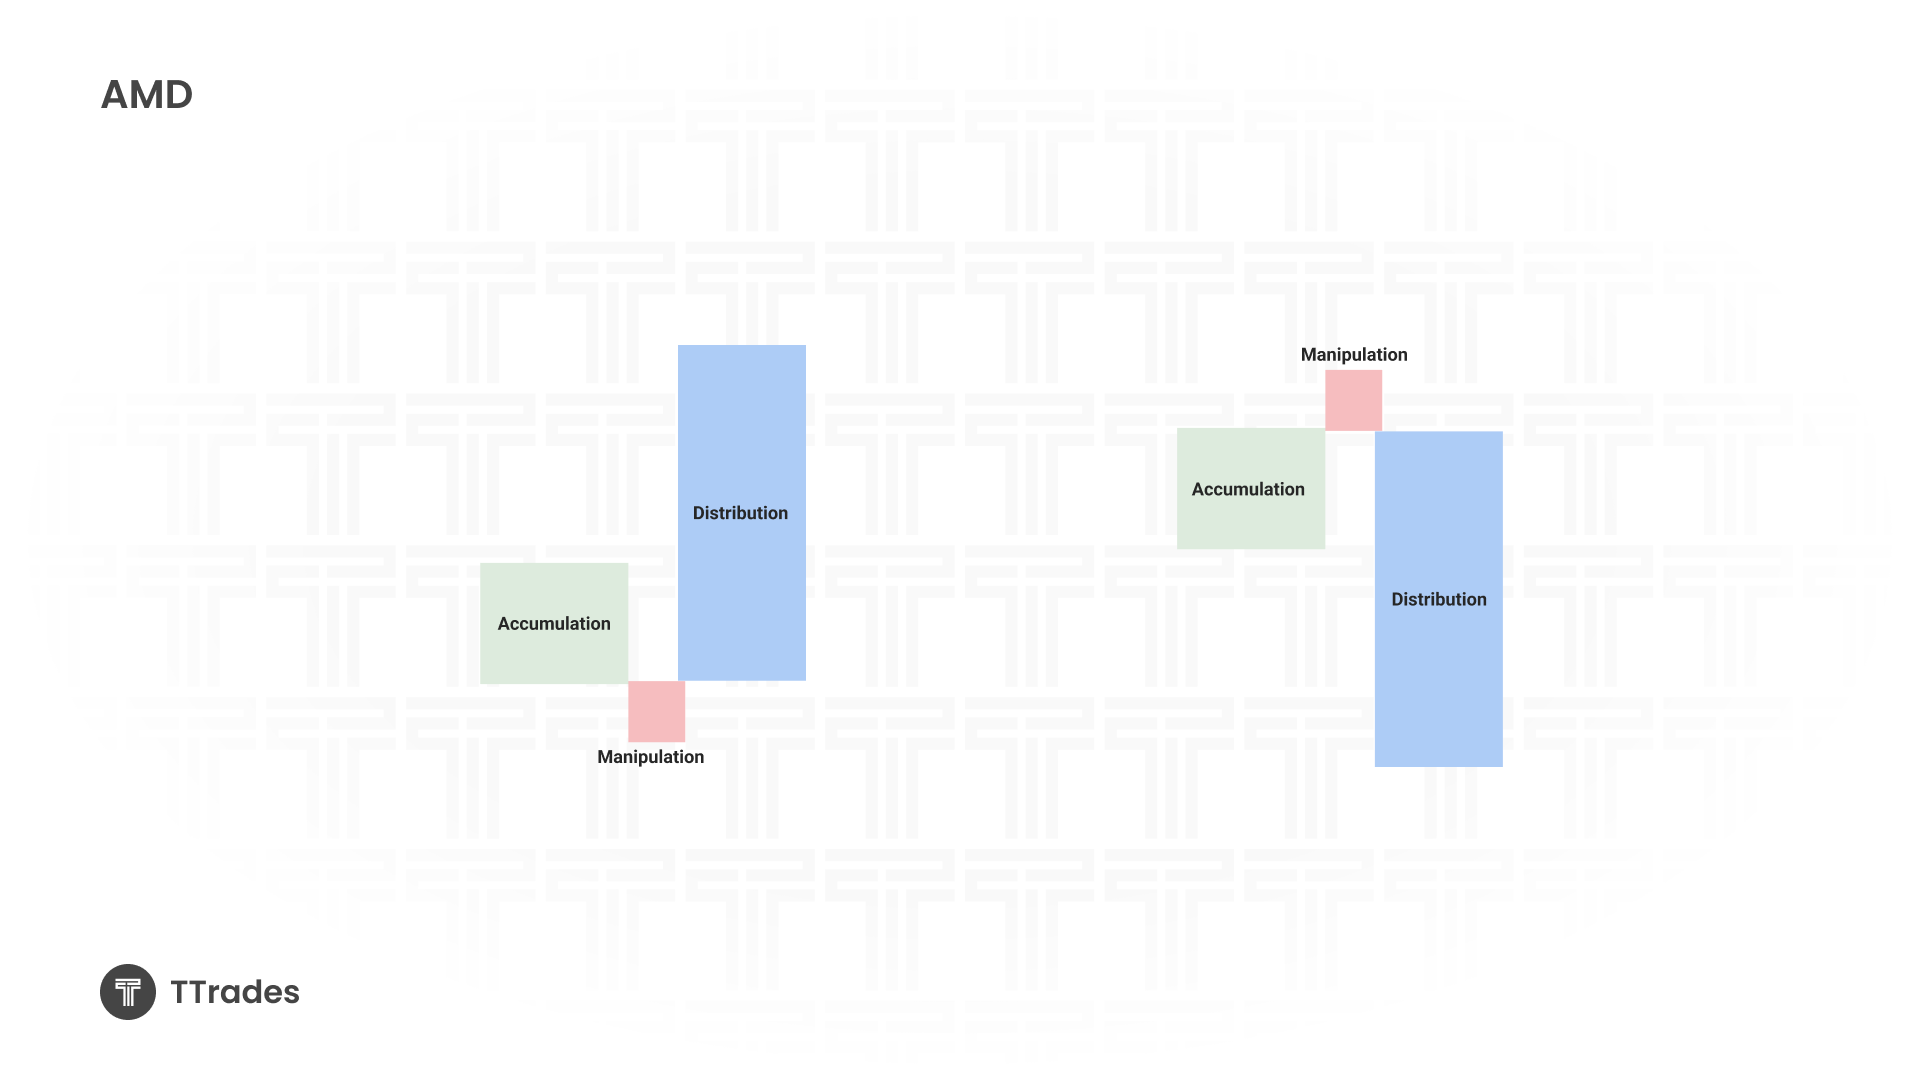
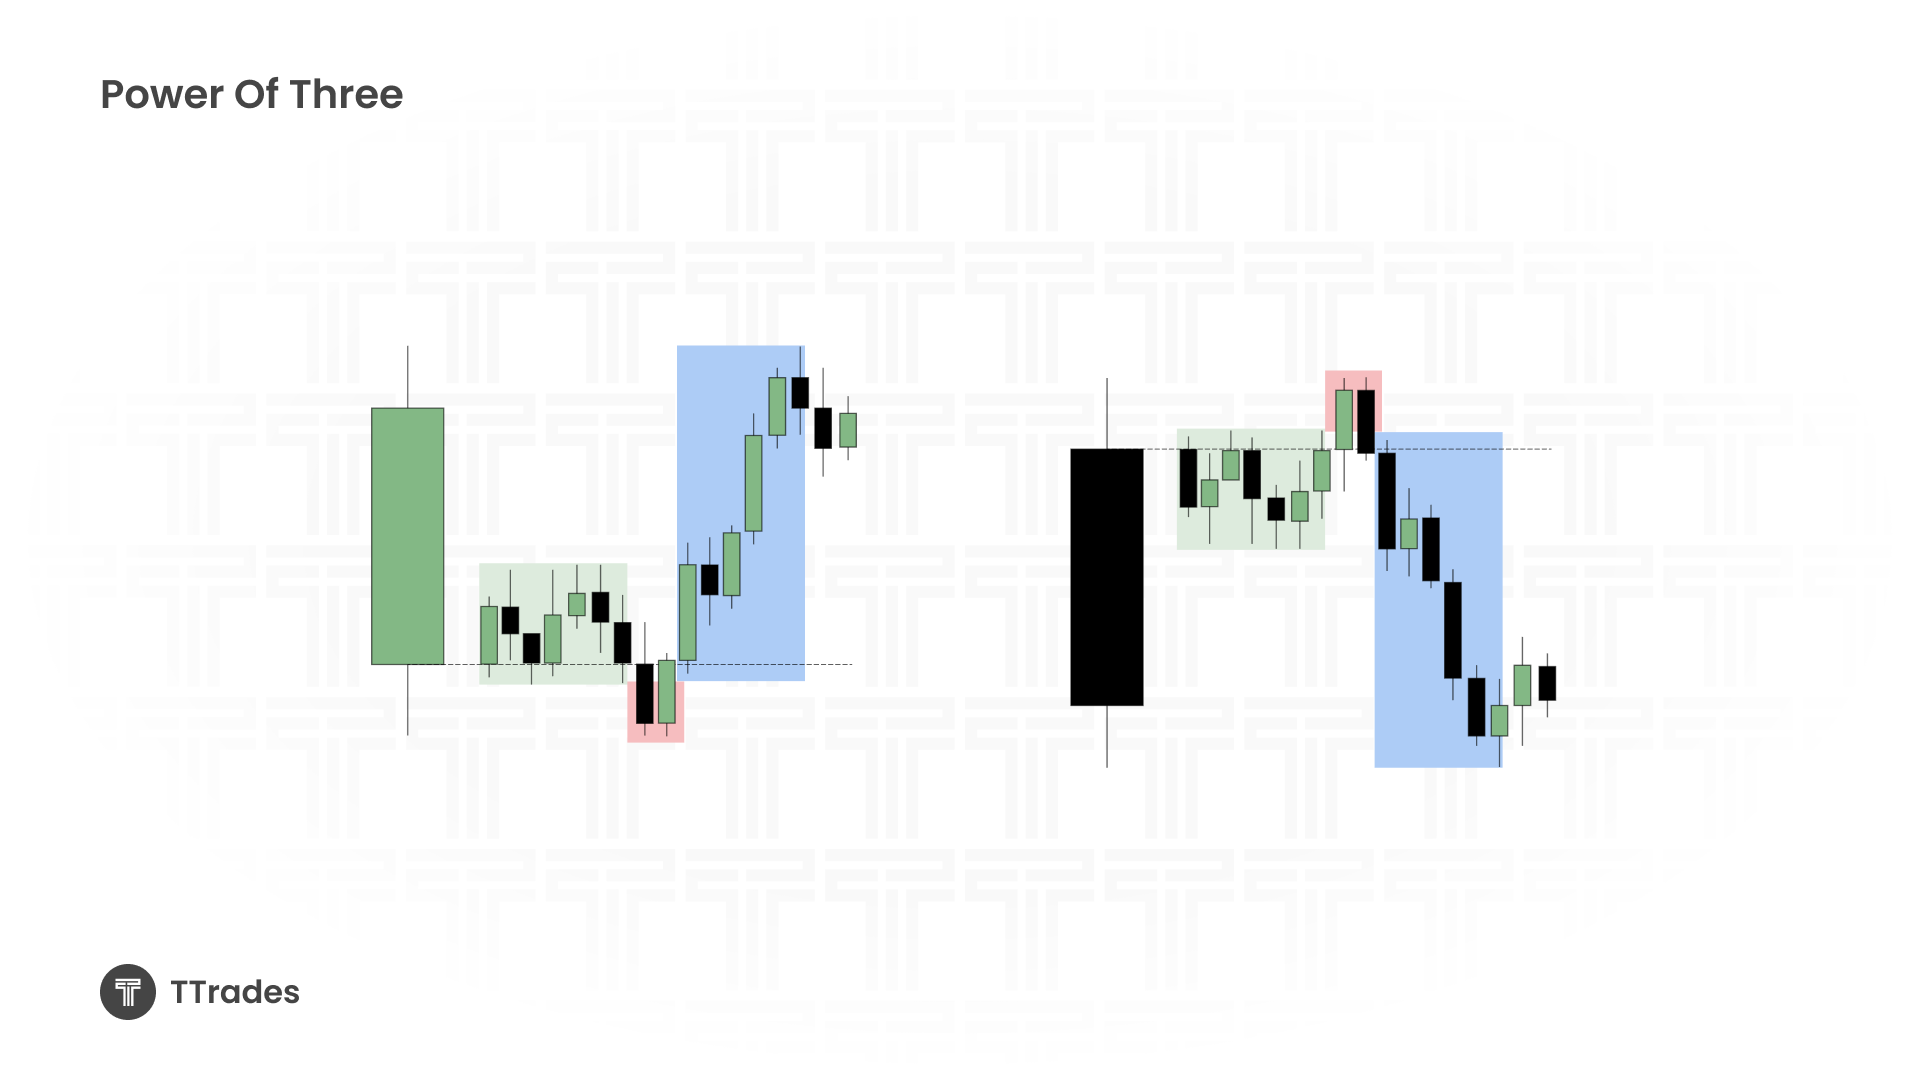
The Power of Three is a framework that explains how price typically moves through three phases during a trading period.
Accumulation is where price consolidates in a range. Manipulation is where price runs liquidity outside that range. Distribution is where price expands in the true intended direction.
This sequence explains why false breakouts occur and why strong directional moves often follow them.
Accumulation
Accumulation is usually seen as a tight range or consolidation. During this phase, price appears inactive, but liquidity is building on both sides of the range.
Buy stops accumulate above the highs of the range, while sell stops accumulate below the lows. This liquidity becomes the fuel for the next phase.
Manipulation
Manipulation occurs when price aggressively breaks out of the accumulation range and then quickly returns back inside it.
This move stops out traders who entered early and traps breakout traders in the wrong direction. The key characteristic of manipulation is aggressive displacement outside the range followed by a return back into it.
That false breakout is intentional and necessary to clear liquidity.
Distribution
Distribution is the expansion phase that follows manipulation. This is where price delivers the majority of the range.
This phase is where traders want to participate, either by entering near the end of manipulation or by joining continuation setups during distribution.
How Entries Are Taken Using AMD
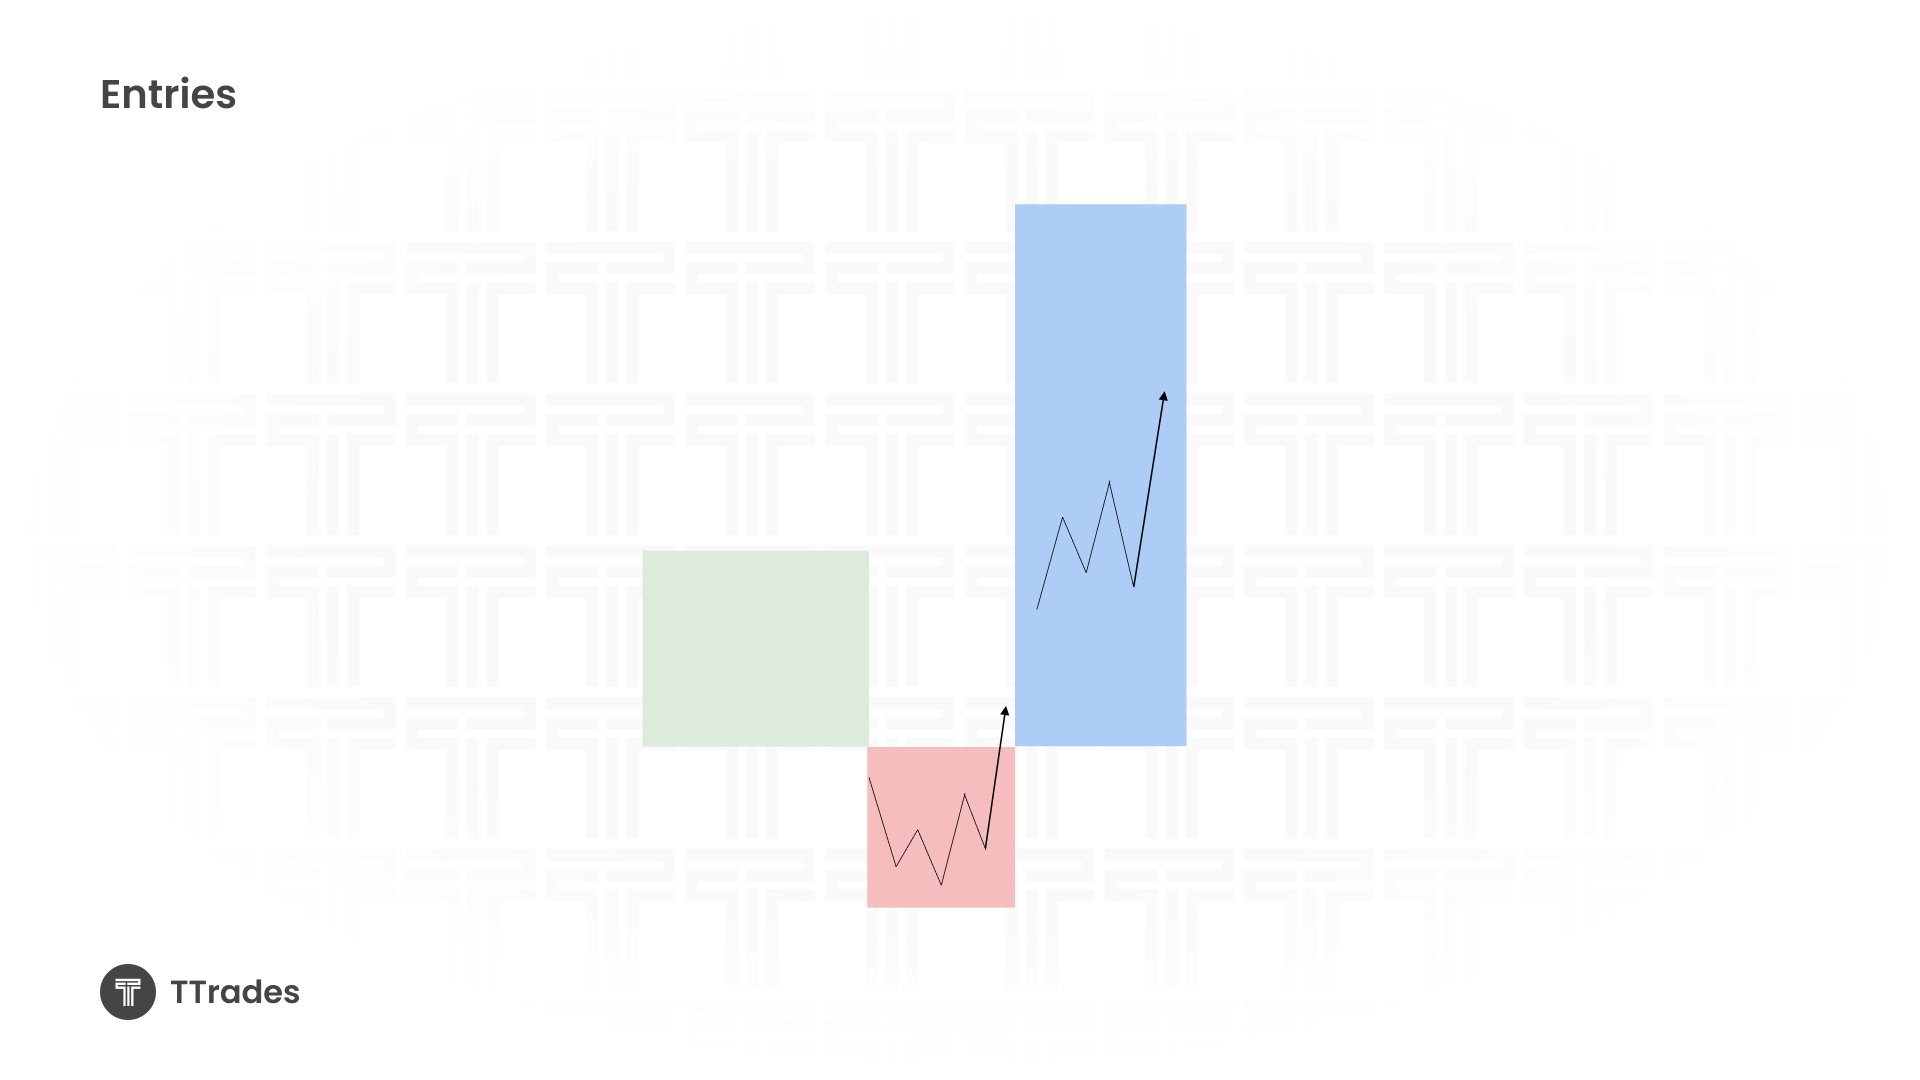
There are two primary ways to approach entries using the Power of Three.
One approach is entering during manipulation by looking for reversal behavior after liquidity is swept. This allows traders to capture the entire distribution move.
The second approach is entering during distribution using continuation models once price has clearly chosen a direction. This is often more conservative and still highly effective.
The Fractal Nature of AMD
The Power of Three is fractal, meaning it appears on all time frames.
It can be found on very low time frames such as the thirty second or one minute chart, as well as on higher time frames like the daily, monthly, and even yearly charts. The logic remains the same regardless of timeframe.
Lower Time Frame Application
On lower time frames, the process begins by identifying aggressive price action that moves out of a range and then back into it.
Once that manipulation is identified, the trader can define the accumulation range that price deviated from. From there, expectations shift toward distribution in the opposite direction.
Rather than forcing consolidation boxes, it is more effective to identify manipulation first and then work backward.
Daily Candle Power of Three
On the daily time frame, AMD often aligns with session behavior.
Asia commonly forms accumulation. London frequently provides manipulation, creating the wick of the daily candle. New York then delivers distribution, forming the body of the candle.
This behavior often results in a clean open low high close or open high low close daily candle.
Projecting Distribution
Distribution targets can be estimated by projecting the manipulation leg.
By measuring the distance from the high to the low that caused manipulation, traders can project likely expansion areas. These projections become more meaningful when aligned with liquidity such as equal highs, equal lows, prior session levels, or inefficiencies.
Stacked AMDs
Markets often form multiple AMD structures in sequence.
After one distribution completes, price may consolidate again, manipulate liquidity, and continue expanding in the higher time frame direction. This is why higher time frame order flow and liquidity draw are critical to context.
Without that narrative, AMD becomes a pattern rather than a framework.
Key Insight
If identifying accumulation feels difficult, shift focus to manipulation.
Aggressive movement out and back into a range reveals where accumulation existed. Once that is identified, distribution expectations become much clearer.
Final Thoughts
The Power of Three is not a standalone strategy. It is a framework that explains how price moves and why liquidity must be cleared before expansion occurs. When paired with higher time frame bias and liquidity concepts, AMD becomes a powerful tool for anticipating market behavior.