
Introduction
In trading, establishing a daily bias and understanding the concept of a draw on liquidity are essential for navigating price action. This help traders anticipate where price is likely headed and how to frame both continuations or reversals. One of the simplest yet most effective ways to do this is by using previous day’s highs and lows as reference points. This guide will walk you through how to build bias using these levels, how liquidity drives price, and how to apply these ideas with both daily and weekly ranges.
Using Previous Day Highs and Lows
The most basic approach to daily bias starts with marking out the previous day’s high and low. Price is unlikely to remain trapped between both without eventually taking one side.
-
If price is trending up, bias favors a run on the previous day’s high.
-
If trending down, bias favors a run on the previous day’s low.
-
If price sweeps one side but fails to displace beyond it, this can set up a reversal toward the opposite side.
Example scenarios:
-
Price takes out yesterday’s high but closes back inside the range → bias shifts bearish
-
Price takes out yesterday’s low but fails to hold below → bias shifts bullish
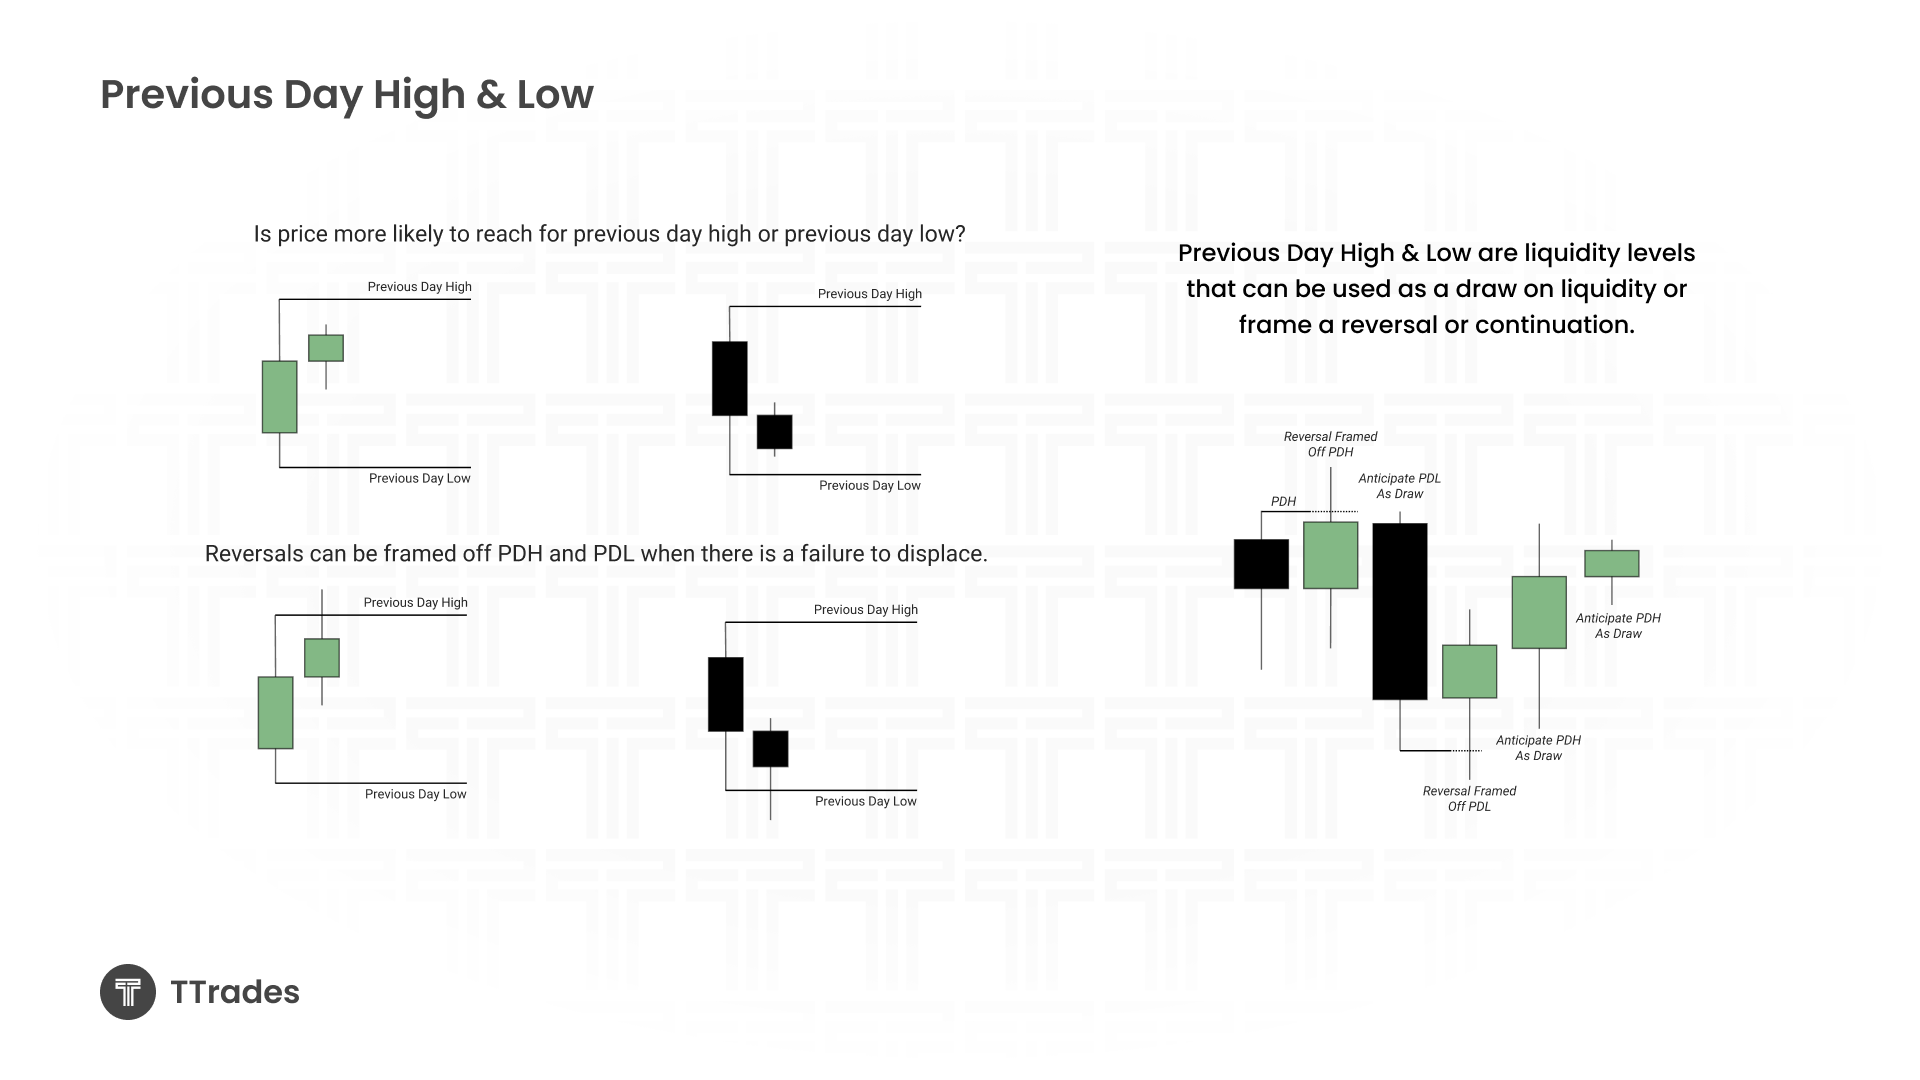
By simply watching the daily chart, you can create a map for where liquidity is most likely to be targeted next.
Using Weekly Highs and Lows
The same principle applies on the weekly scale. Marking the prior week’s high and low provides a bigger-picture liquidity map.
-
Price sweeping last week’s high and closing back below often signals downside continuation.
-
Price sweeping last week’s low and closes back above it often sets up bullish reversals.
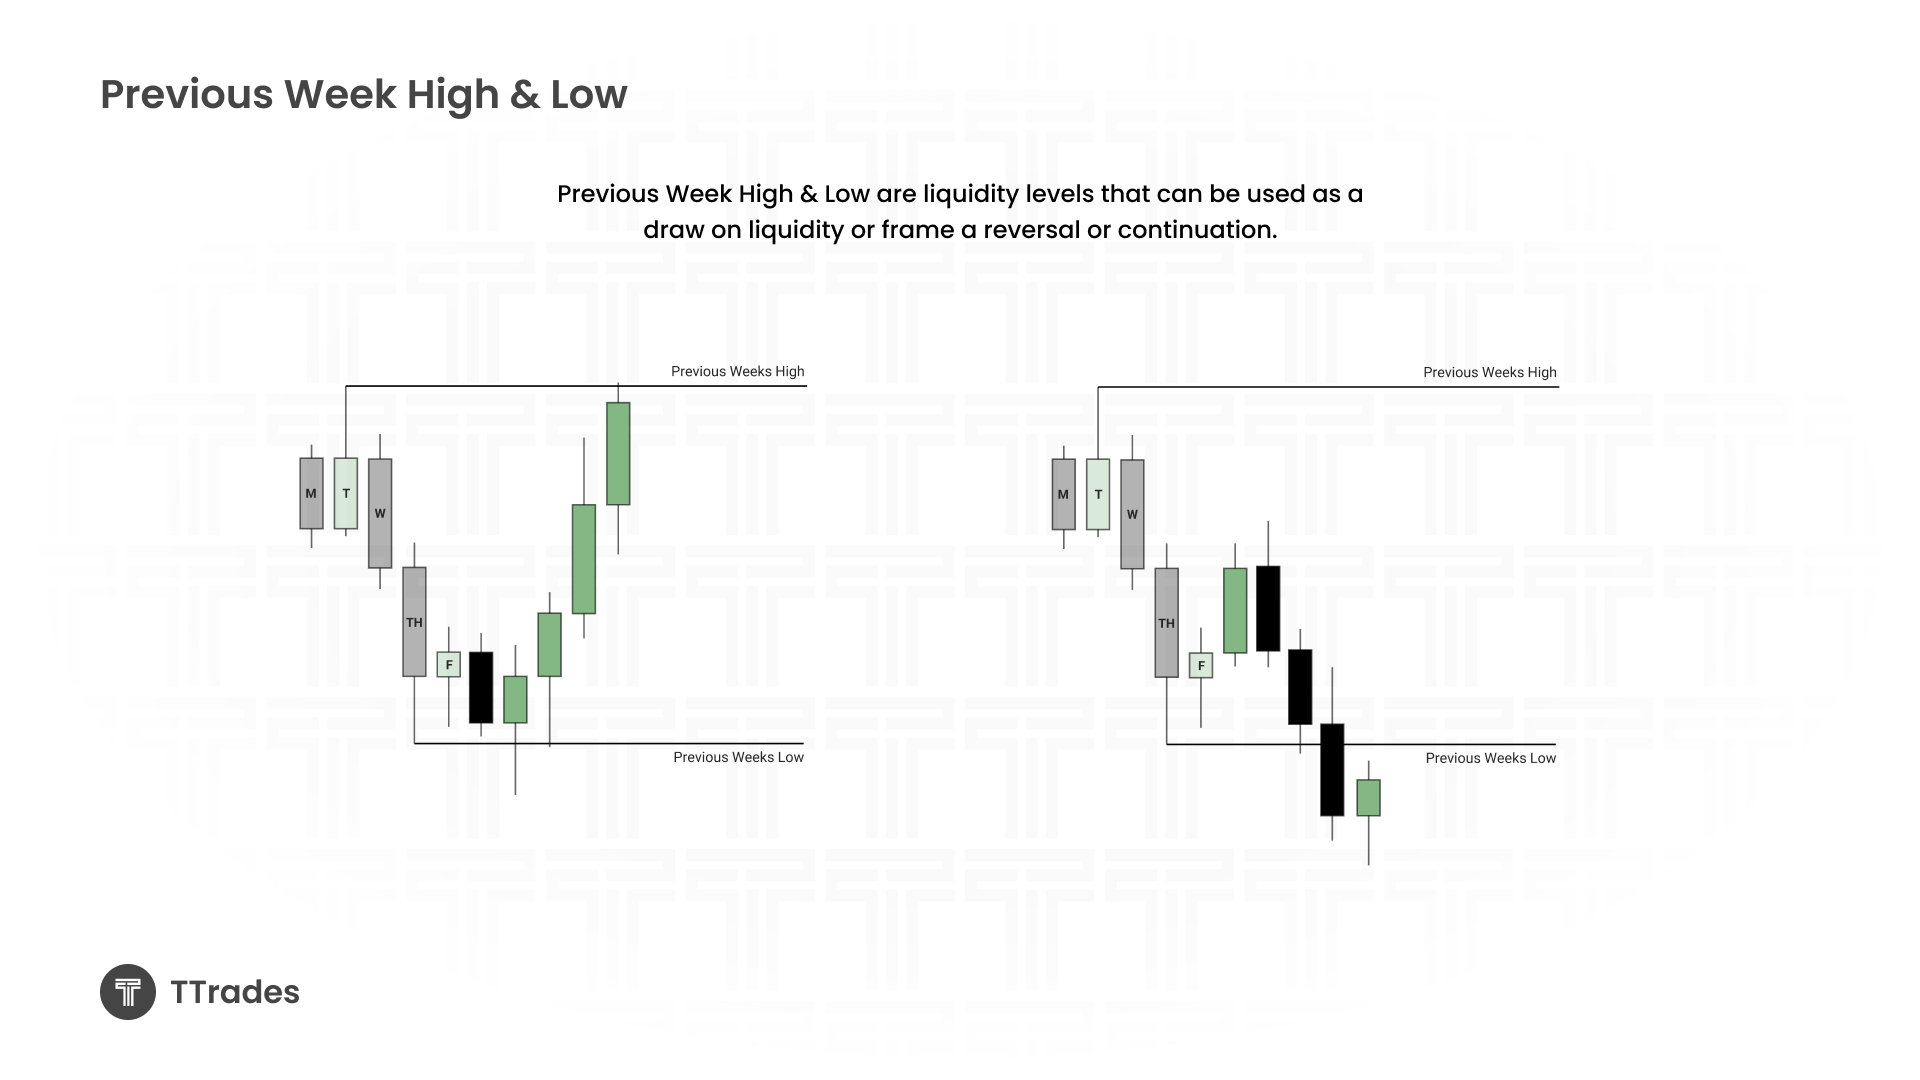
Weekly levels act as larger liquidity pools, and price frequently oscillates between them while forming swing moves.
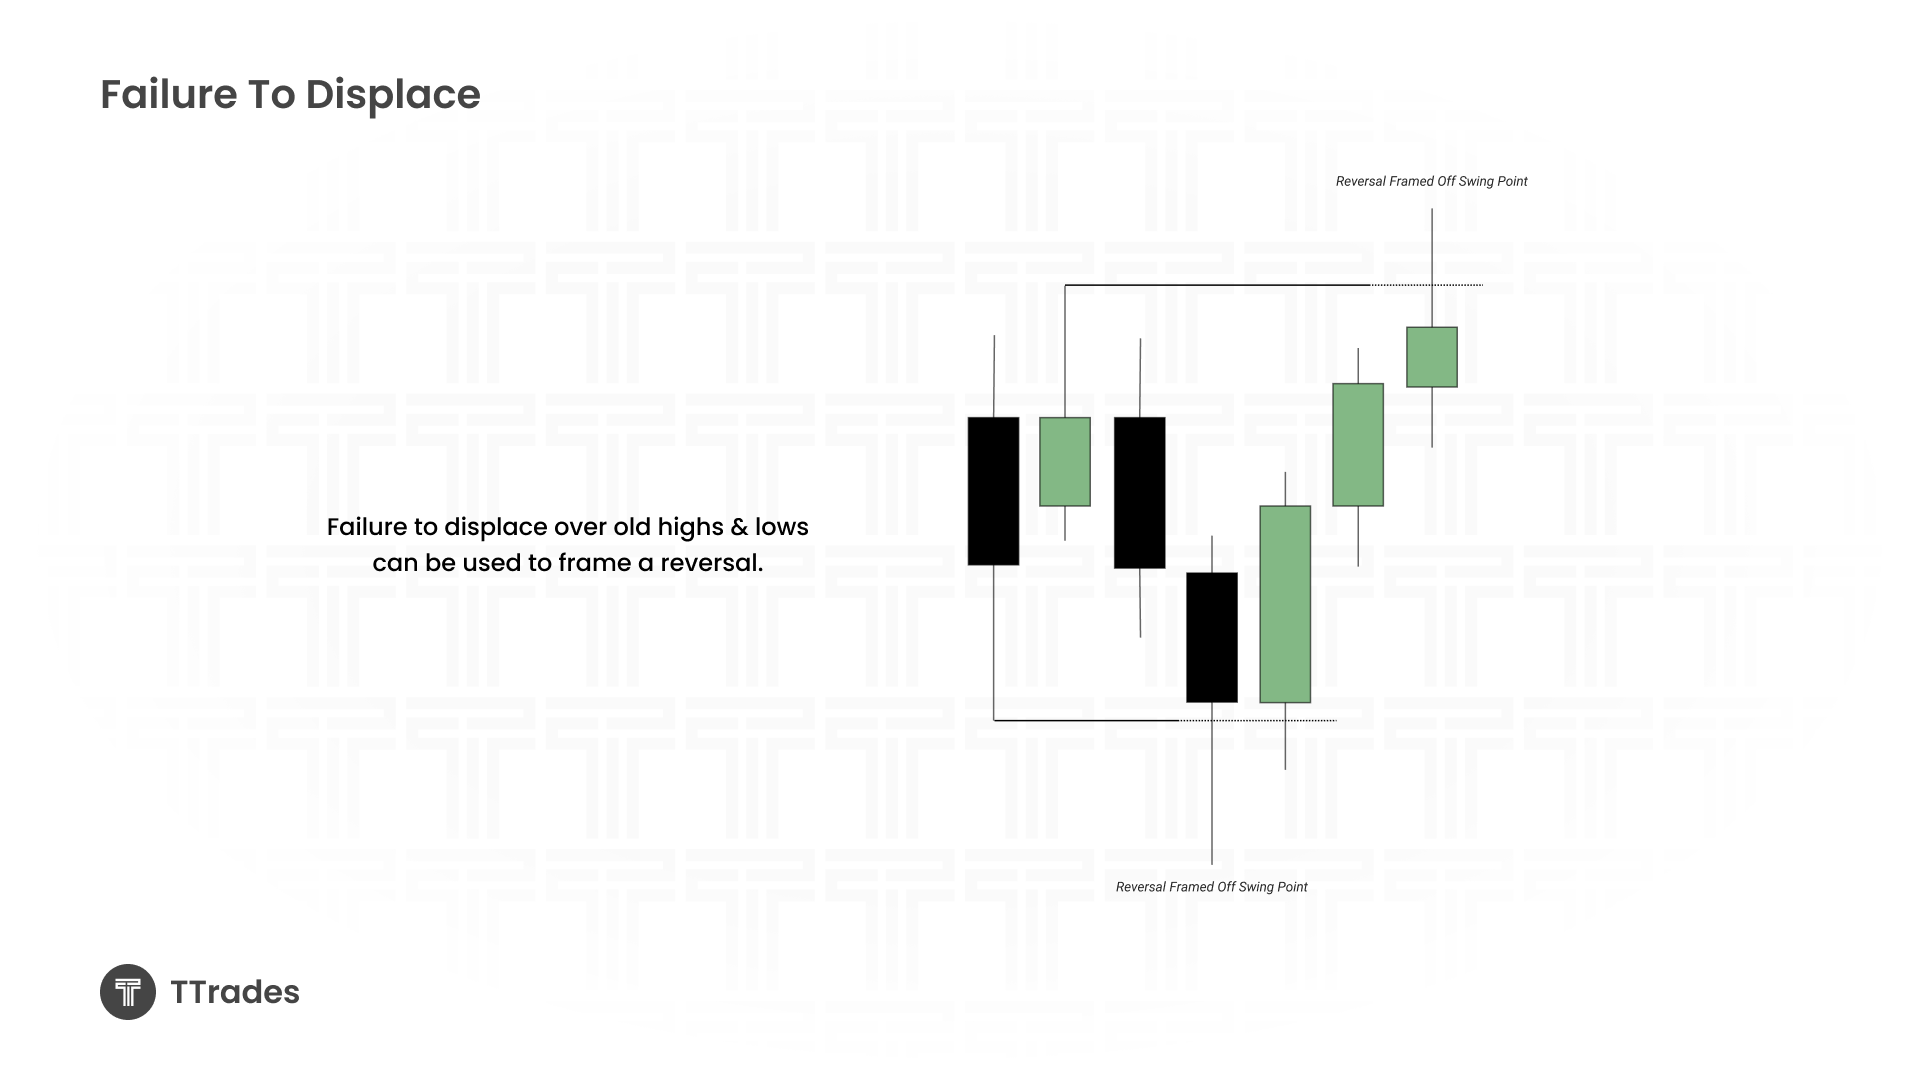
Swing Points and Failure to Displace
Beyond just daily and weekly highs/lows, swing points serve as magnets for liquidity. Old highs and lows resting in the market are natural liquidity targets.
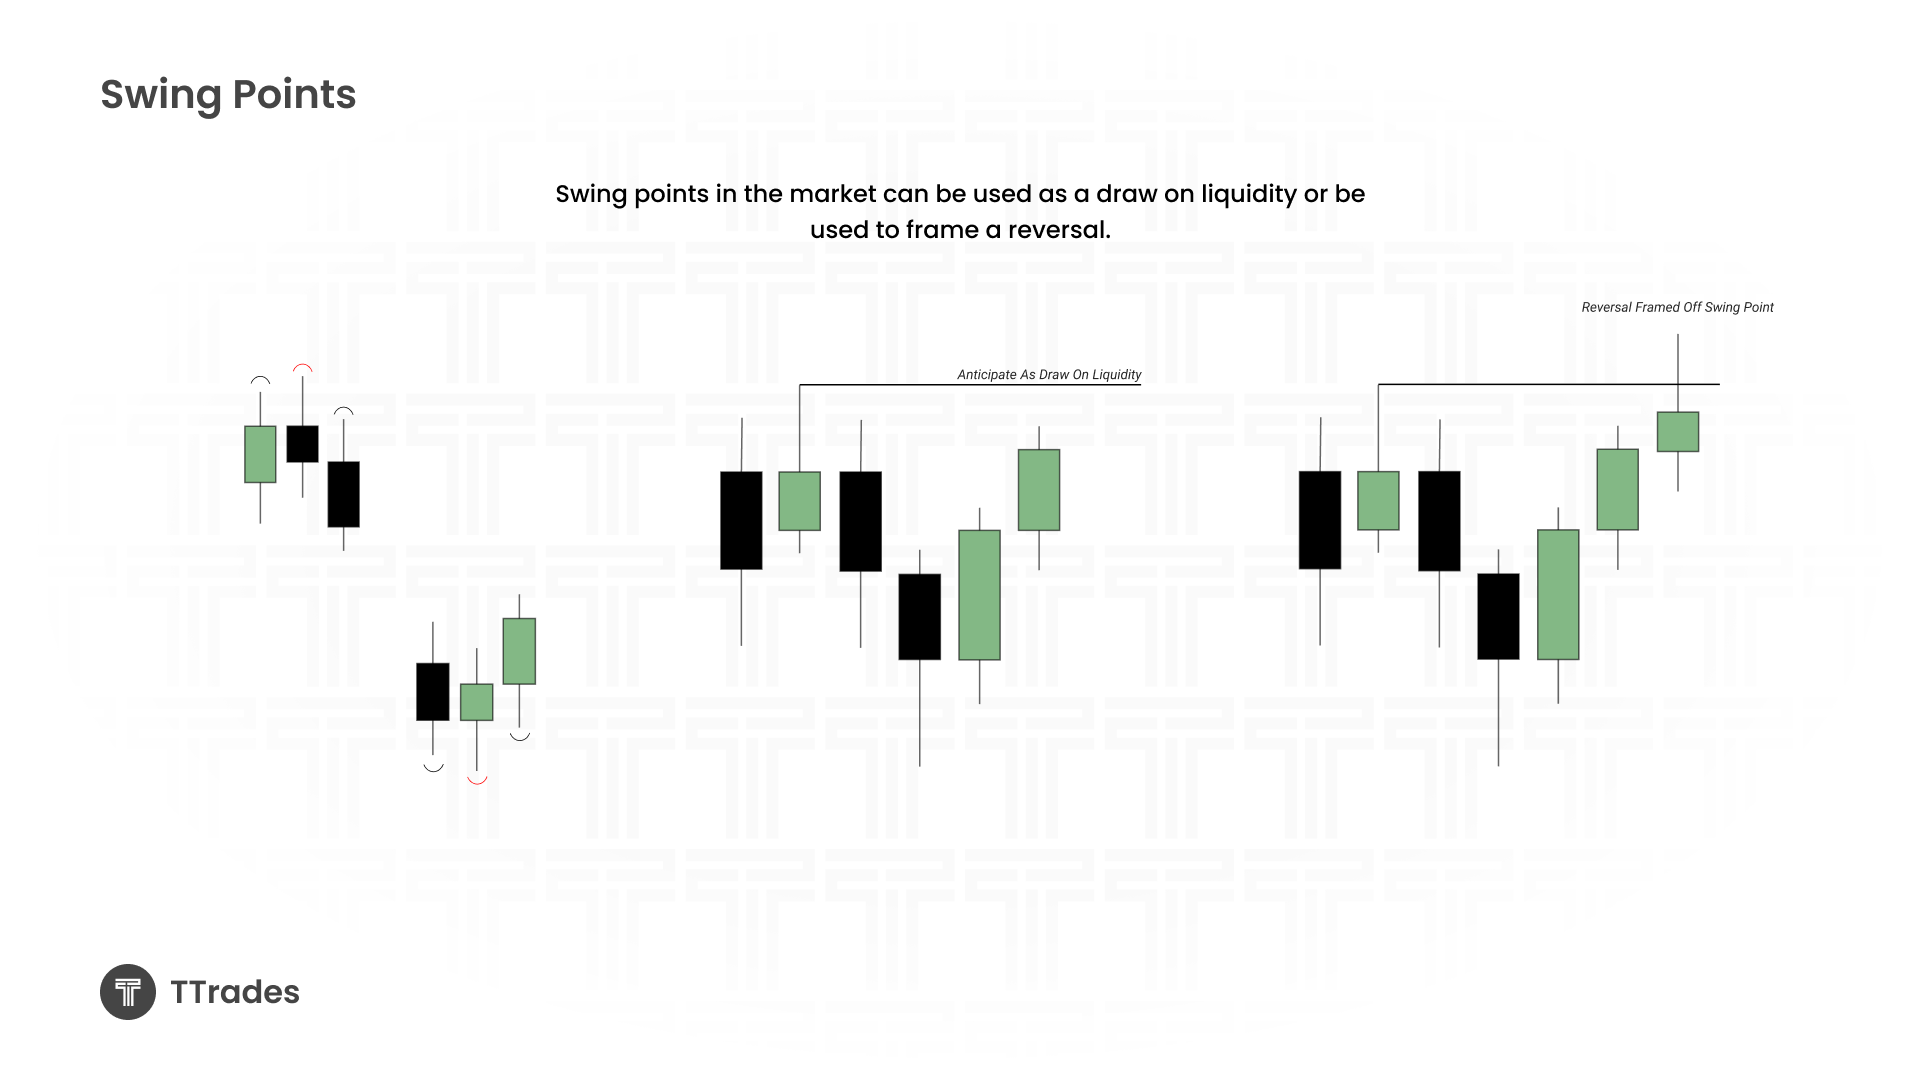
Key idea: failure to displace
-
If price fails to displace below a swing low, bias shifts bullish.
-
If price fails to displace above a swing high, bias shifts bearish.
This is a key concept for recognizing false breakouts and setting up next-day expectations.
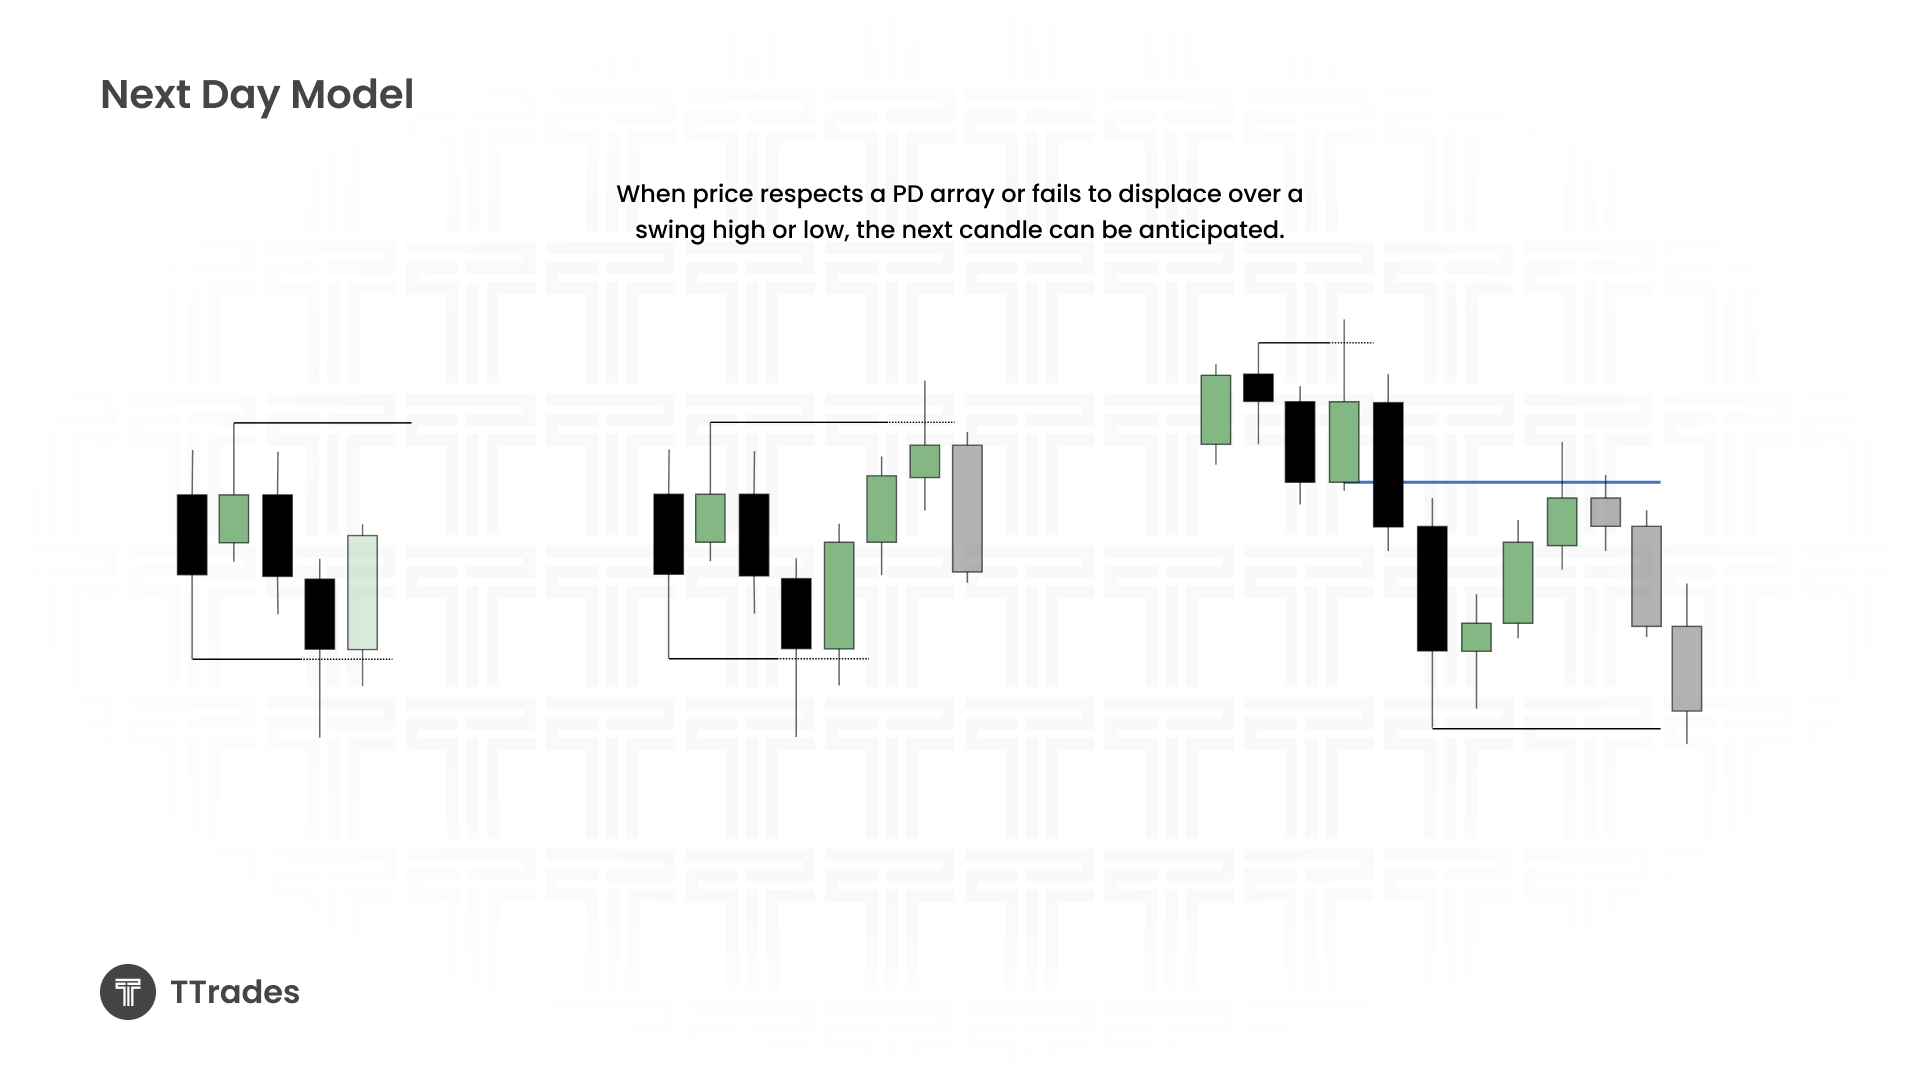
The Next Day Model
The next day model takes advantage of failed displacements. If a high or low is swept but price closes back inside the range, the following day often produces a candle in the opposite direction.
For example:
-
Sweep above a high, close back inside → anticipate a bearish next day (Open-High-Low-Close structure).
-
Sweep below a low, close back inside → anticipate a bullish next day (Open-Low-High-Close structure).
This approach refines daily bias and creates clear trade setups in line with liquidity behavior.
Wrapping It Up
By combining previous day highs/lows, weekly levels, swing points, displacement failures, and the next day model, you can consistently frame where liquidity is drawing. While not every day is textbook-perfect, this framework equips you with a structured way to track bias, reversals, and high-probability setups.