Introduction
In trading, understanding liquidity is essential to reading market behavior. ICT concepts dive deep into how price interacts with liquidity, and one of the most practical distinctions is between High Resistance Liquidity (HRLR) and Low Resistance Liquidity (LRLR). These two liquidity types help traders frame market bias, anticipate reversals, and refine entries.
Let’s break down what they mean, how they form, and how you can apply them to your trading.
What is a Failure Swing?
Before discussing liquidity types, you need to understand the failure swing:
A failure swing high occurs when price forms a swing high, then a lower high.
A failure swing low occurs when price forms a swing low, then a higher low.
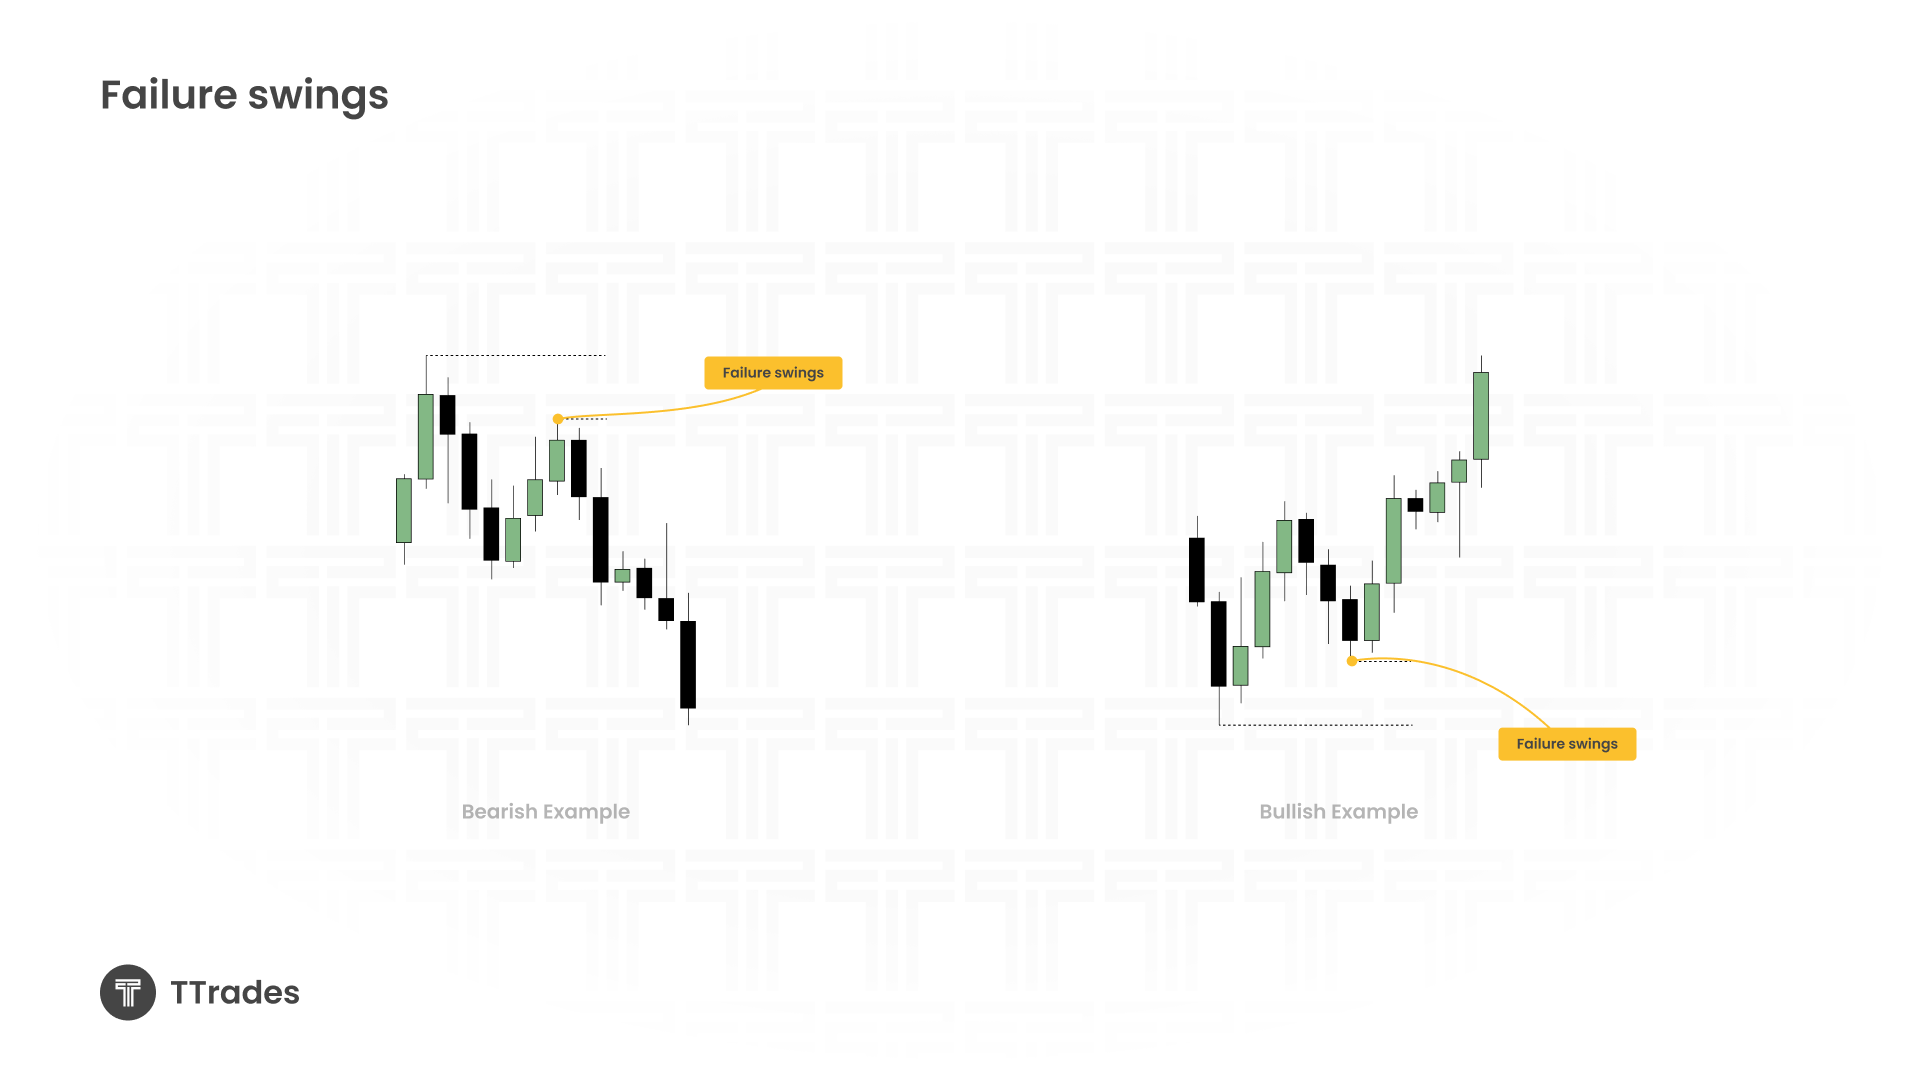
Failure swings show areas where liquidity remains untouched, creating opportunities for price to eventually revisit them.
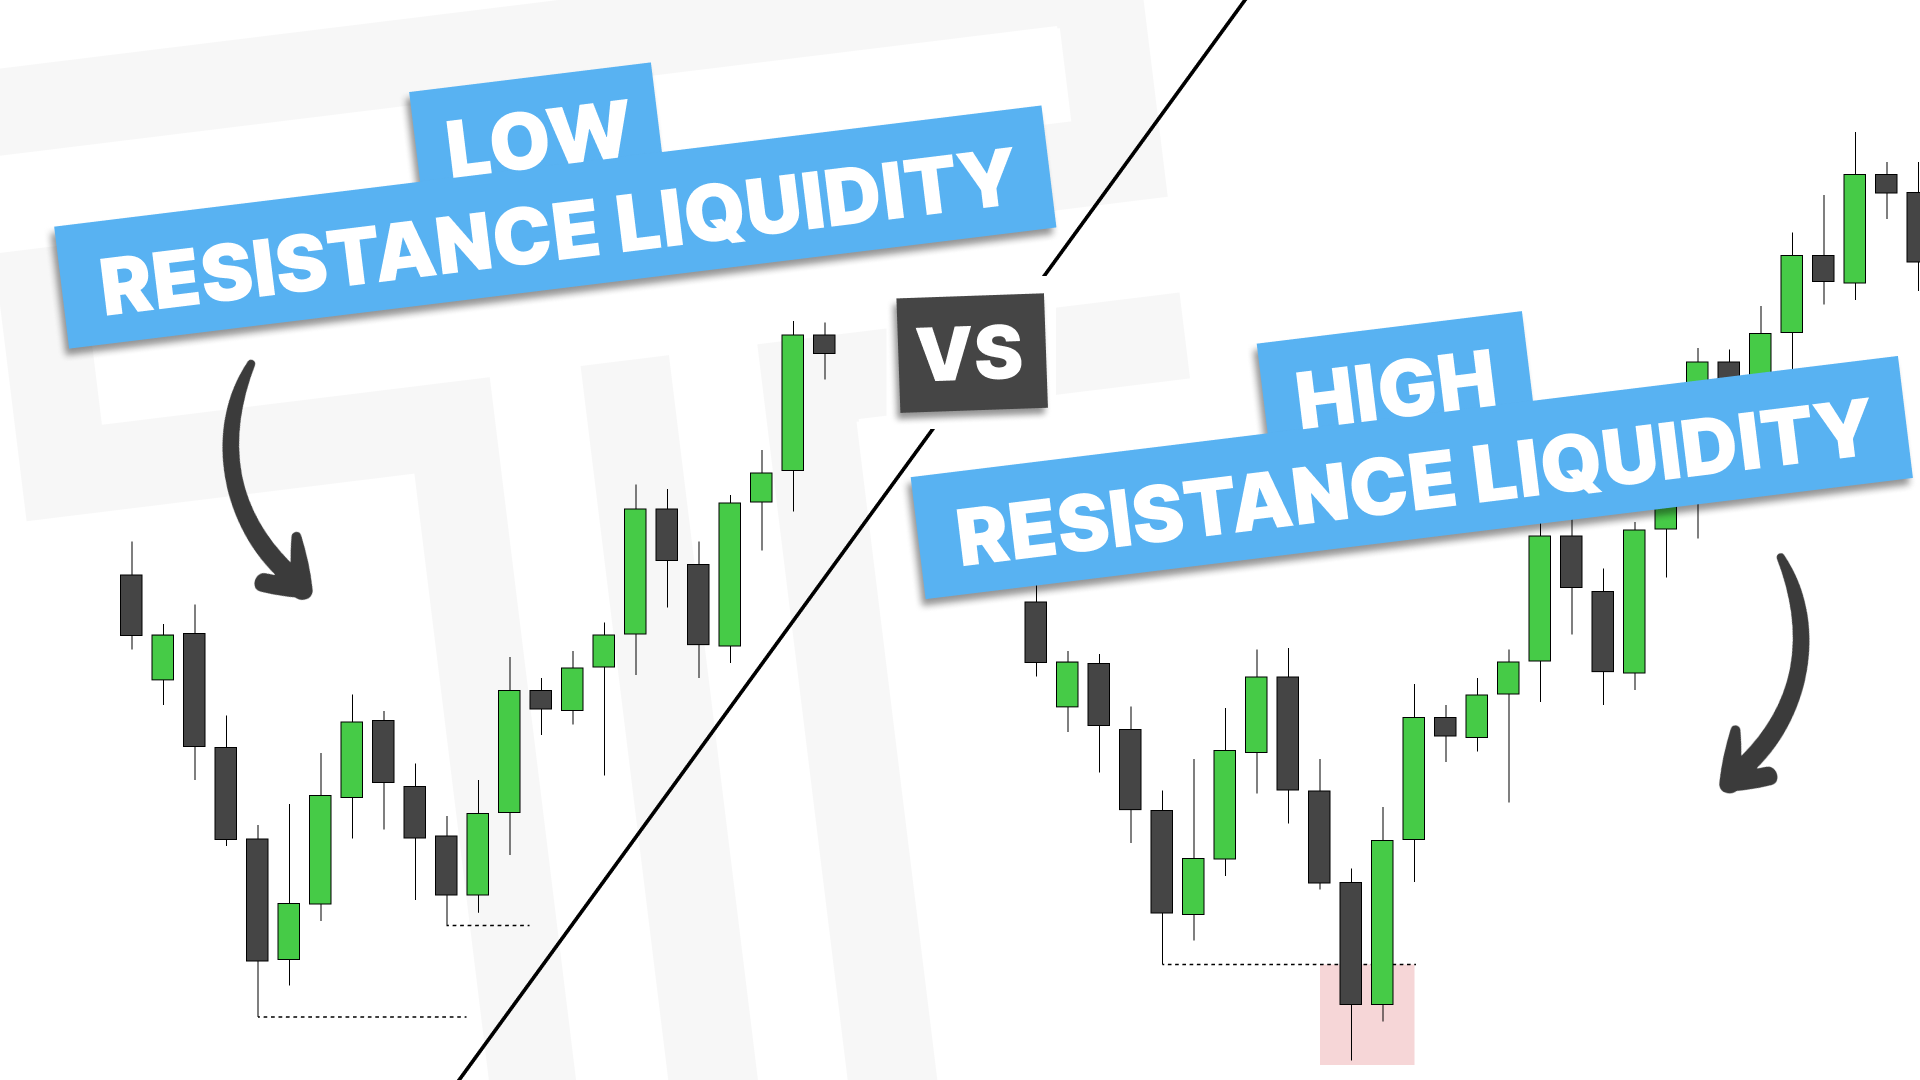
Low Resistance Liquidity (LRLR)
Definition: Liquidity that forms when price creates a failure swing (swing highs or lows left unswept).
Visual Example: A lower high next to a swing high, or a higher low next to a swing low.
- Why It Matters: LRLR is easy for price to target because liquidity is left behind without being cleared. It often acts as a magnet for price in future moves.
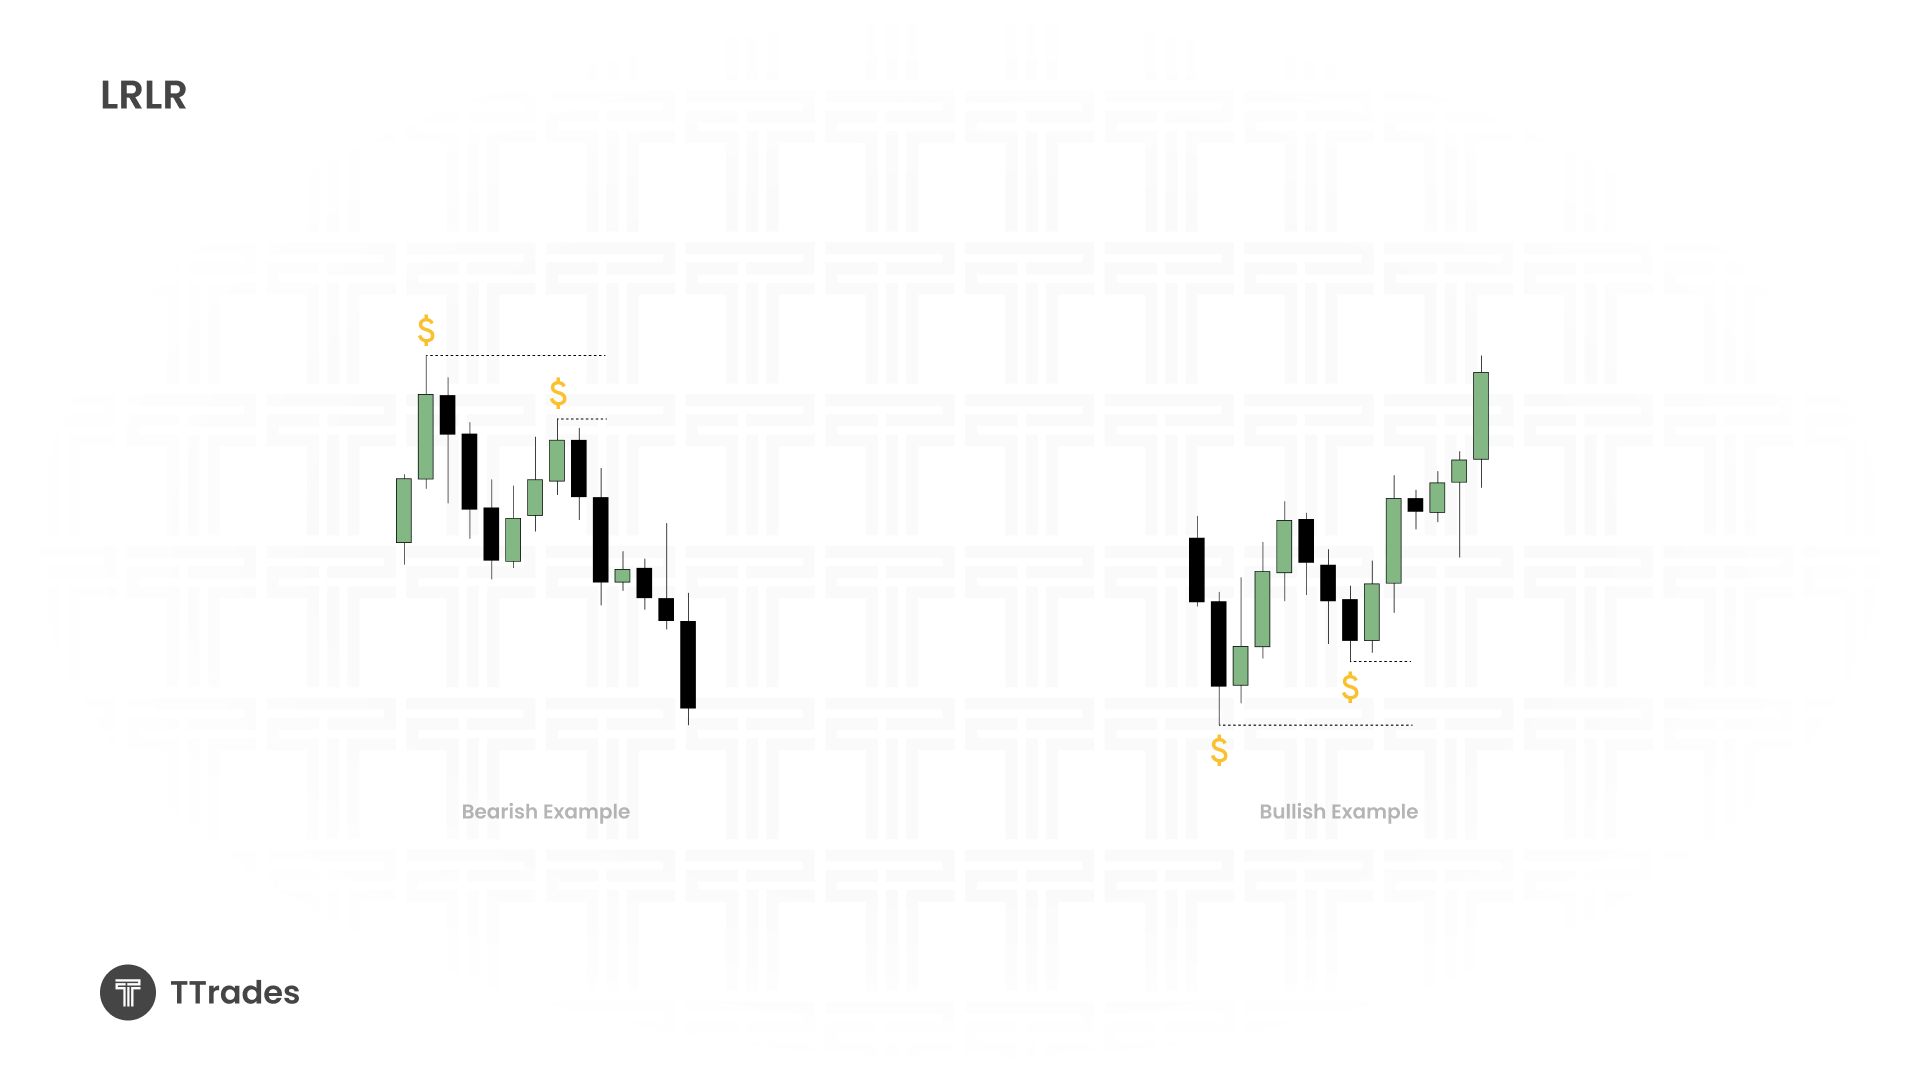
Think of LRLR as unfinished business, price tends to come back for it.
High Resistance Liquidity (HRLR)
Definition: Liquidity that forms when price sweeps a prior high or low before reversing.
Visual Example: Price makes a higher high before reversing lower, or a lower low before reversing higher.
Why It Matters: HRLR signals that liquidity has already been taken, meaning traders can use it as a protective stop.
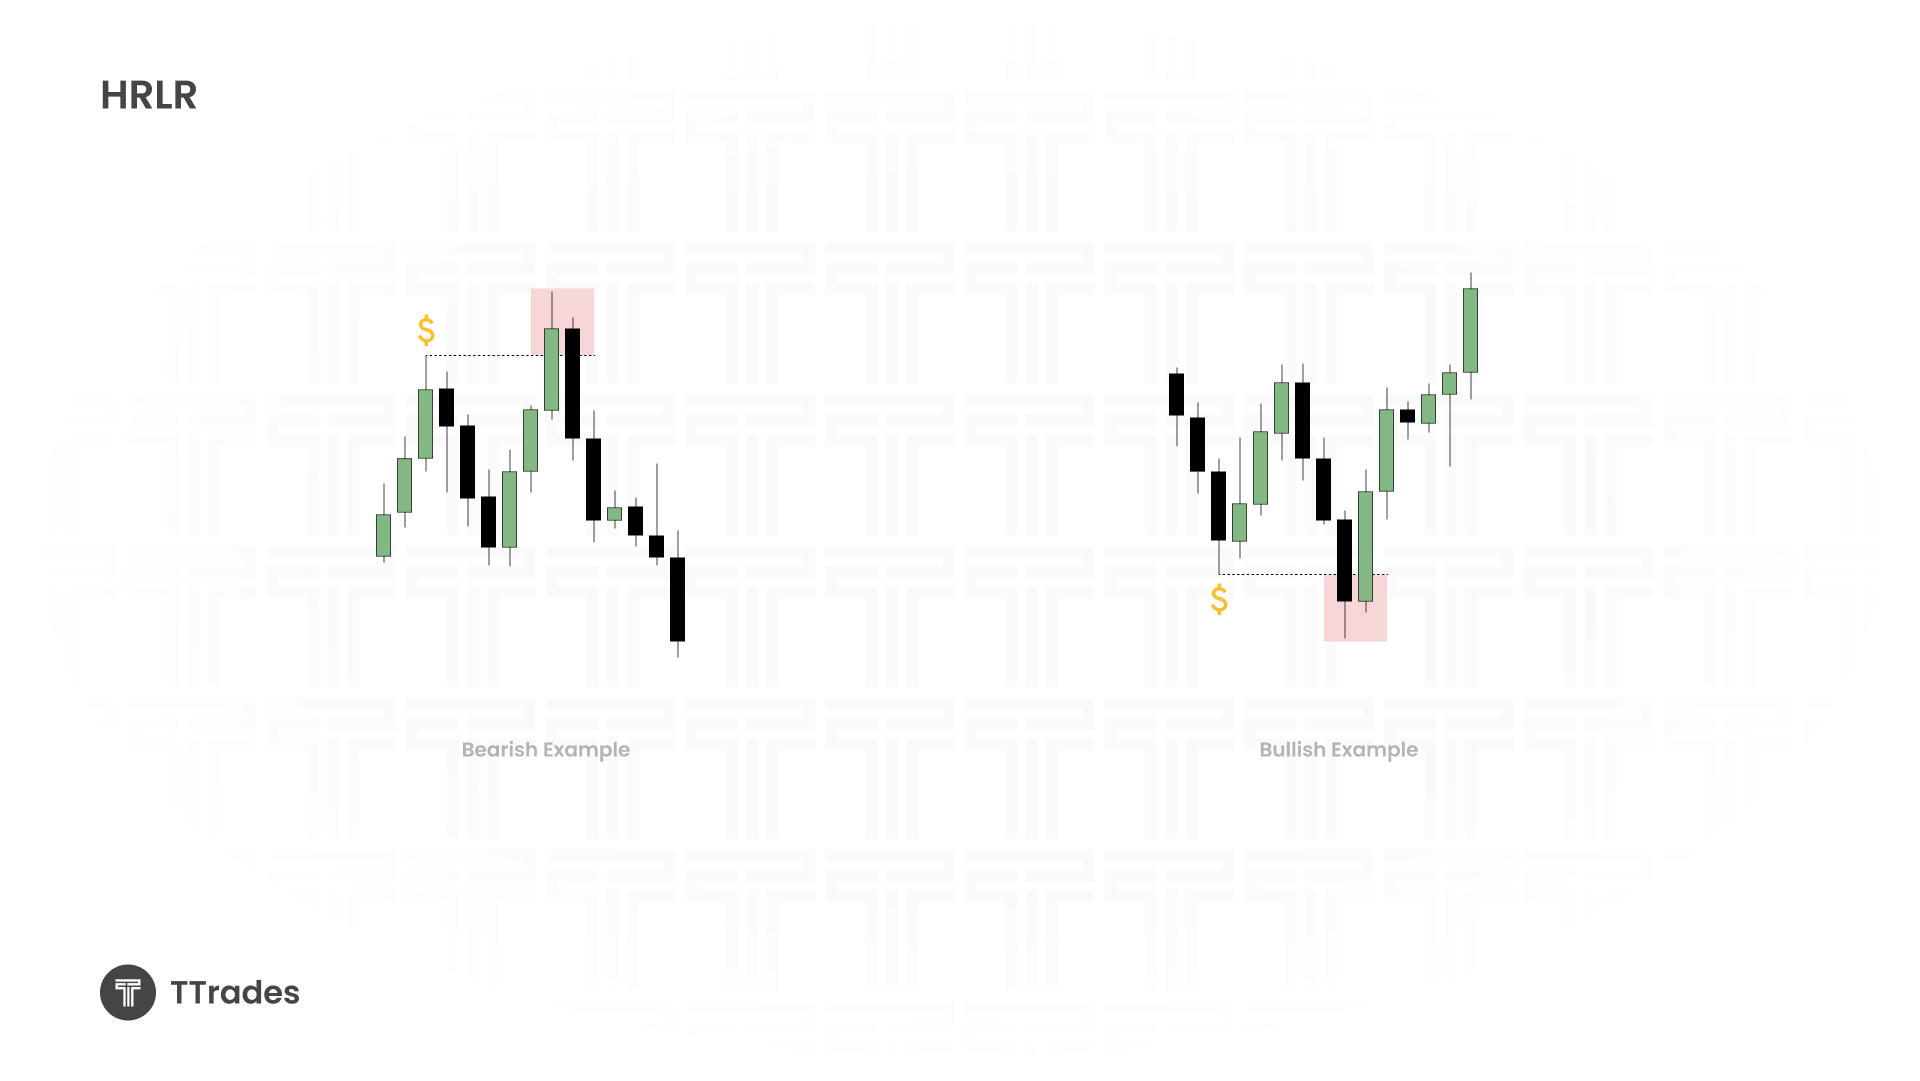
HRLR shows areas where liquidity was cleared, leaving cleaner setups on the opposite side.
How to Use HRLR and LRLR Together
Combining the two concepts:
Targeting: Aim for Low Resistance Liquidity as take profit zones.
Stops: Use High Resistance Liquidity for stop placement.
Practical Example:
If price sweeps a low (creating HRLR), then shifts structure upward, you can look for a long entry targeting LRLR (failure swing highs).
Conversely, if price sweeps a high (HRLR) and shifts structure downward, target LRLR lows.
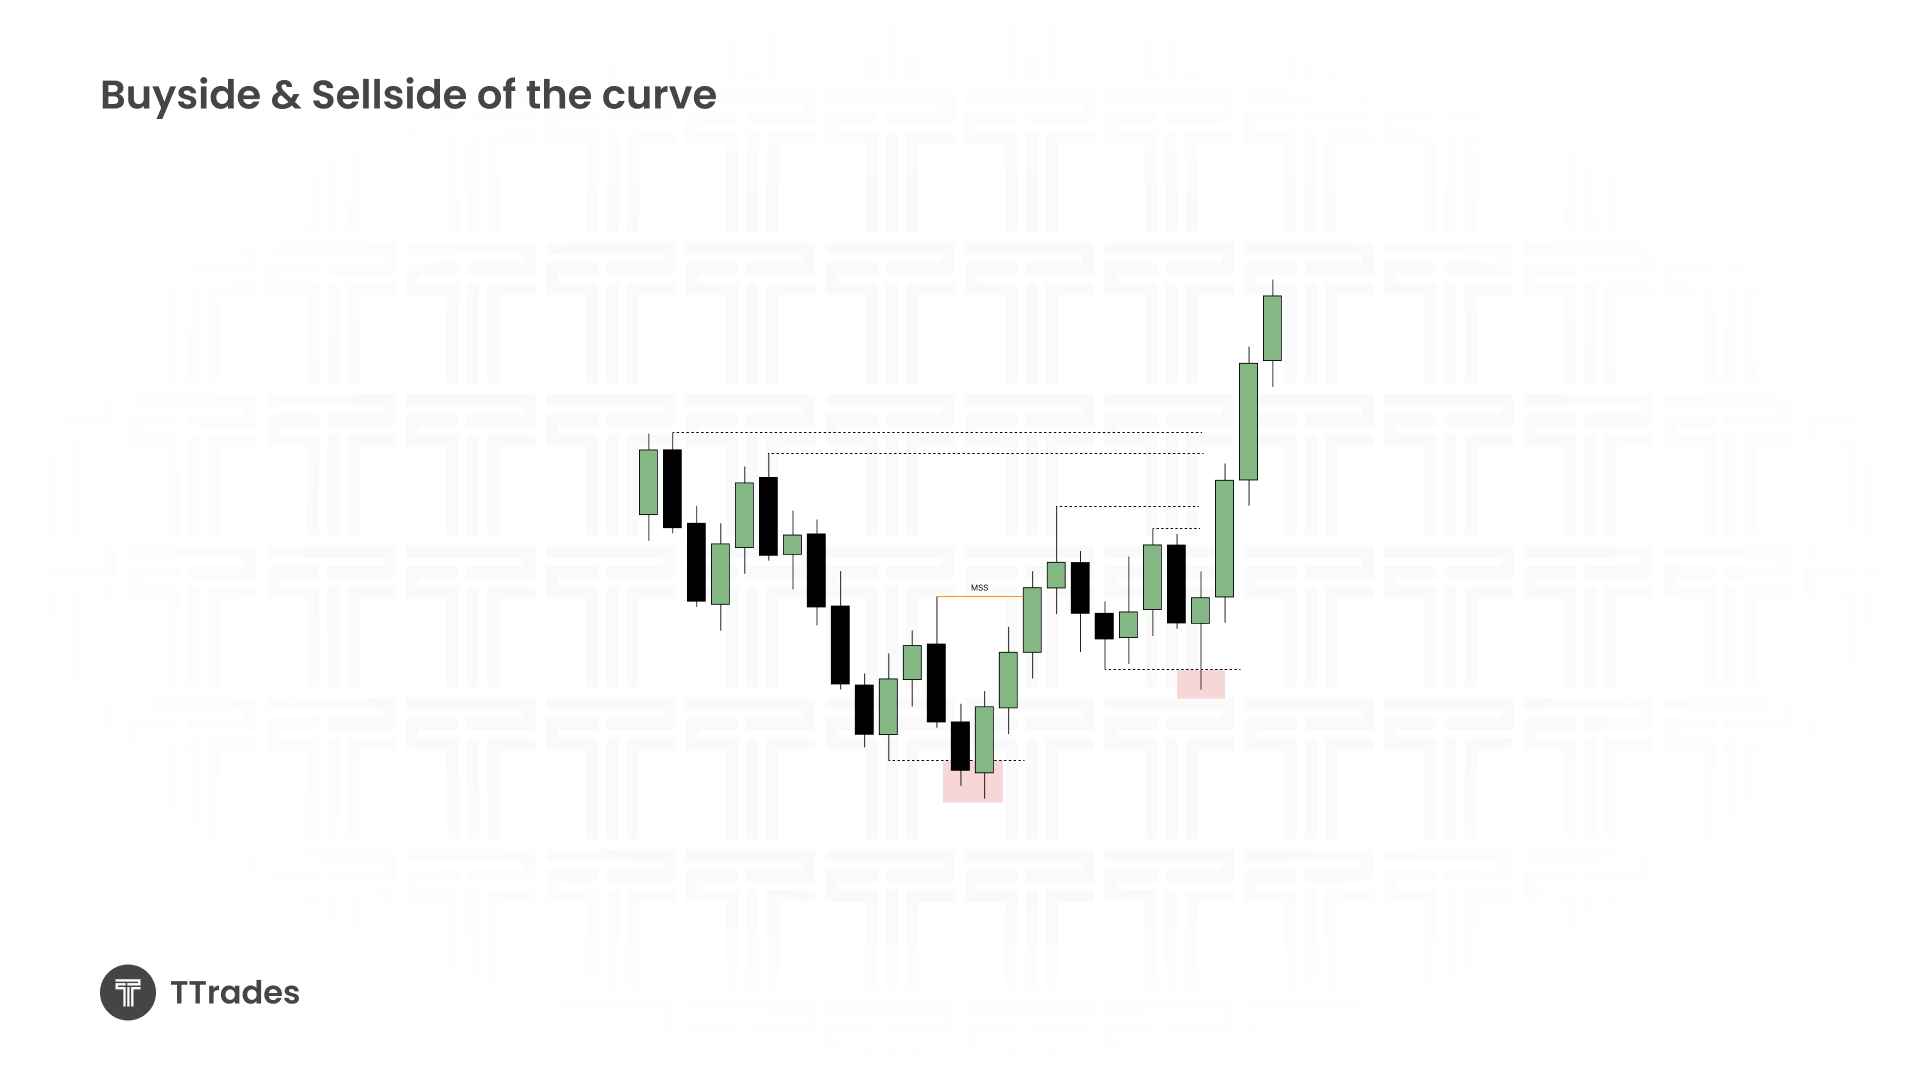
Chart Applications
From the examples shown in the lesson:
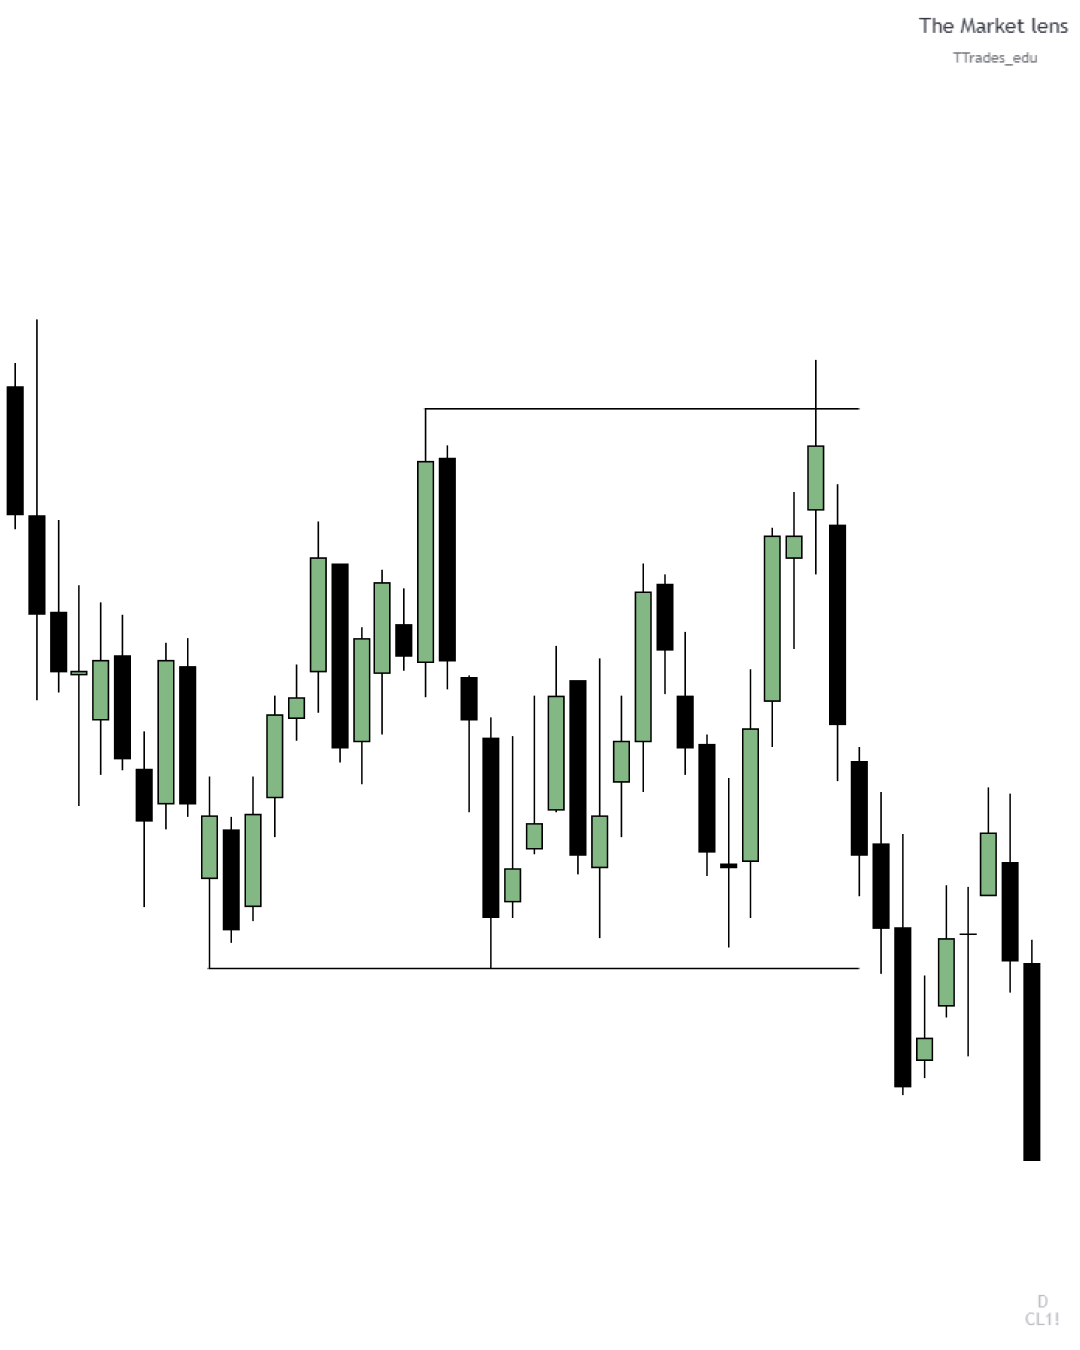
Daily Charts: Look for clusters of failure swings (LRLR) to identify liquidity pools. Use sweeps (HRLR) to confirm bias.
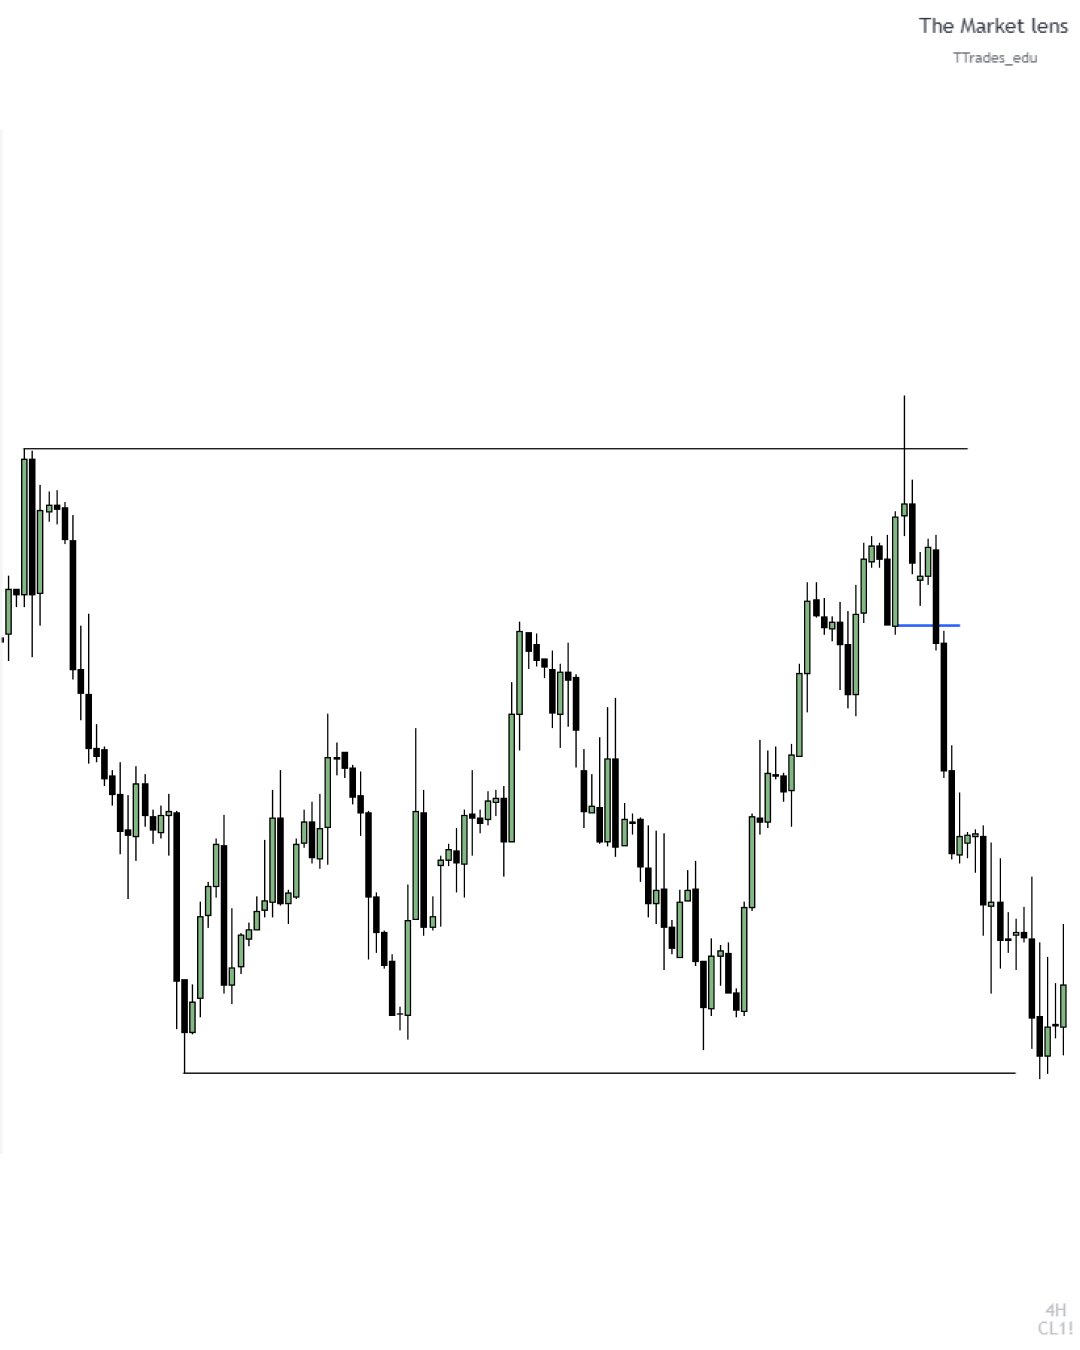
- Intraday Charts: Notice when price sweeps one side of a range (HRLR) before moving to the opposite side where LRLR rests.
- Order Blocks: HRLR often aligns with valid order blocks, creating strong confluence for entries.
Key Takeaways
LRLR = Failure swings → Targets for price.
HRLR = Swept liquidity → Stop placement.
Use HRLR for invalidation, LRLR for objectives.
The combination of both helps traders refine entries and manage risk effectively.