
Introduction
In trading, timing often matter just as much as the price an asset is trading. The Daily Profile framework helps traders understand how price tends to move within different sessions. One of the most straight forward setups is the New York manipulation profile, where the New York session sweeps the current days range high or low and then deliveries in the opposite direction.
This blog will break down what the New York manipulation profile looks like, how it plays out in bullish and bearish contexts, and how traders can frame entries using concepts like the change in the state of delivery.
What is the New York Manipulation Profile?
The New York manipulation is the Open-High-Low-Close (bullish profile) or Open-Low-High-Close (bearish profile) structure of a daily candle.
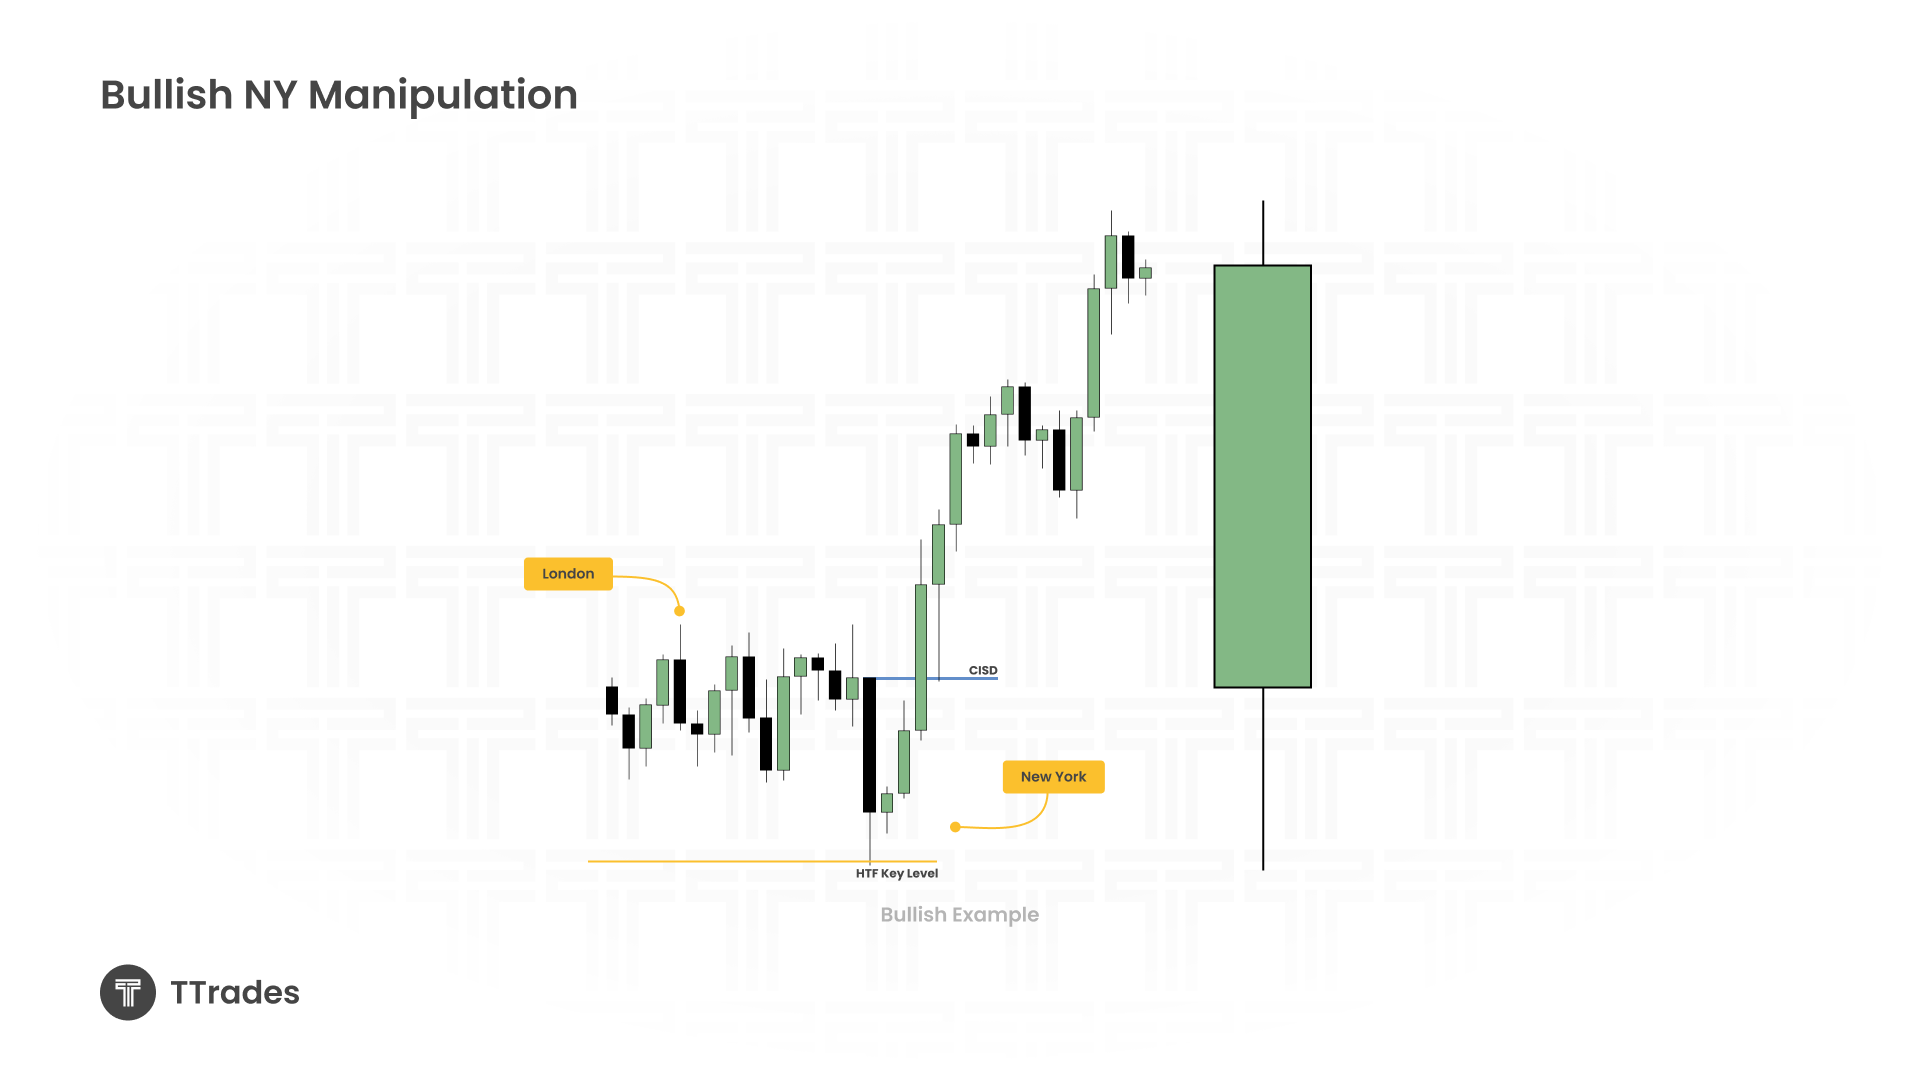
Bullish case: London consolidates, New York sweeps the range low, has a change in the state of delivery and then expands upward.
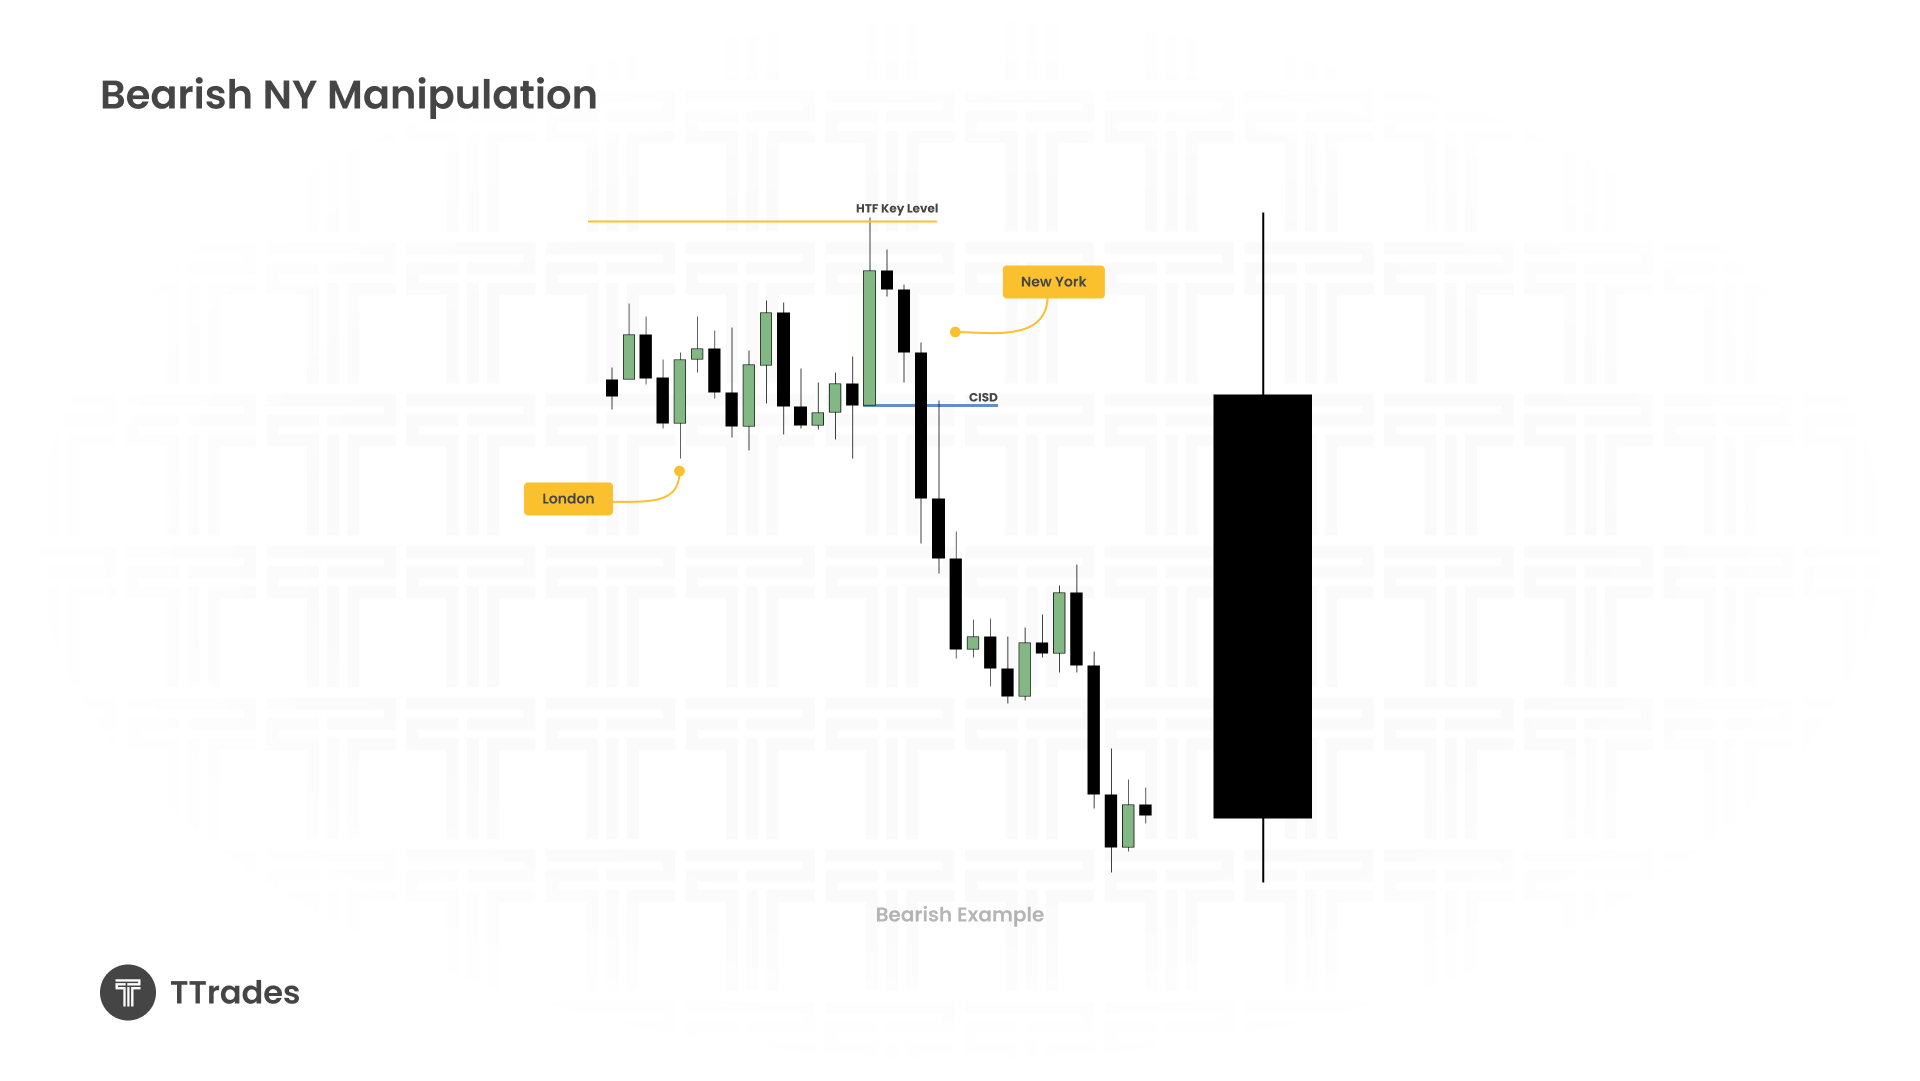
- Bearish case: London consolidates, New York sweeps the range high, has a change in the state of delivery and then expands downward.
This mirrors the Power of Three Model: Accumulation – Manipulation – Distribution.
How to Recognize It on Charts
To spot a New York manipulation, traders typically look for:
London Session Behavior: Did London create a significant high/low, or just consolidate? If it failed to reach a key level, New York is more likely to sweep the range high or low.
Liquidity Sweeps: Around 8:30 AM or 9:30 AM (News release and NYSE open), watch for false moves that sweep liquidity above or below London’s range.
Change in the State of Delivery: After the sweep, price must close through the opposing candles (e.g., down close candles in a bullish reversal) to confirm a directional shift.
Entry Models: Traders can refine entries using fair value gaps (FVGs), order blocks (OBs), or their choice of an entry model
Example: Bullish New York Manipulation
London consolidates without setting a clear low.
At 8:30, New York drives price lower, taking out a recent low (liquidity sweep).
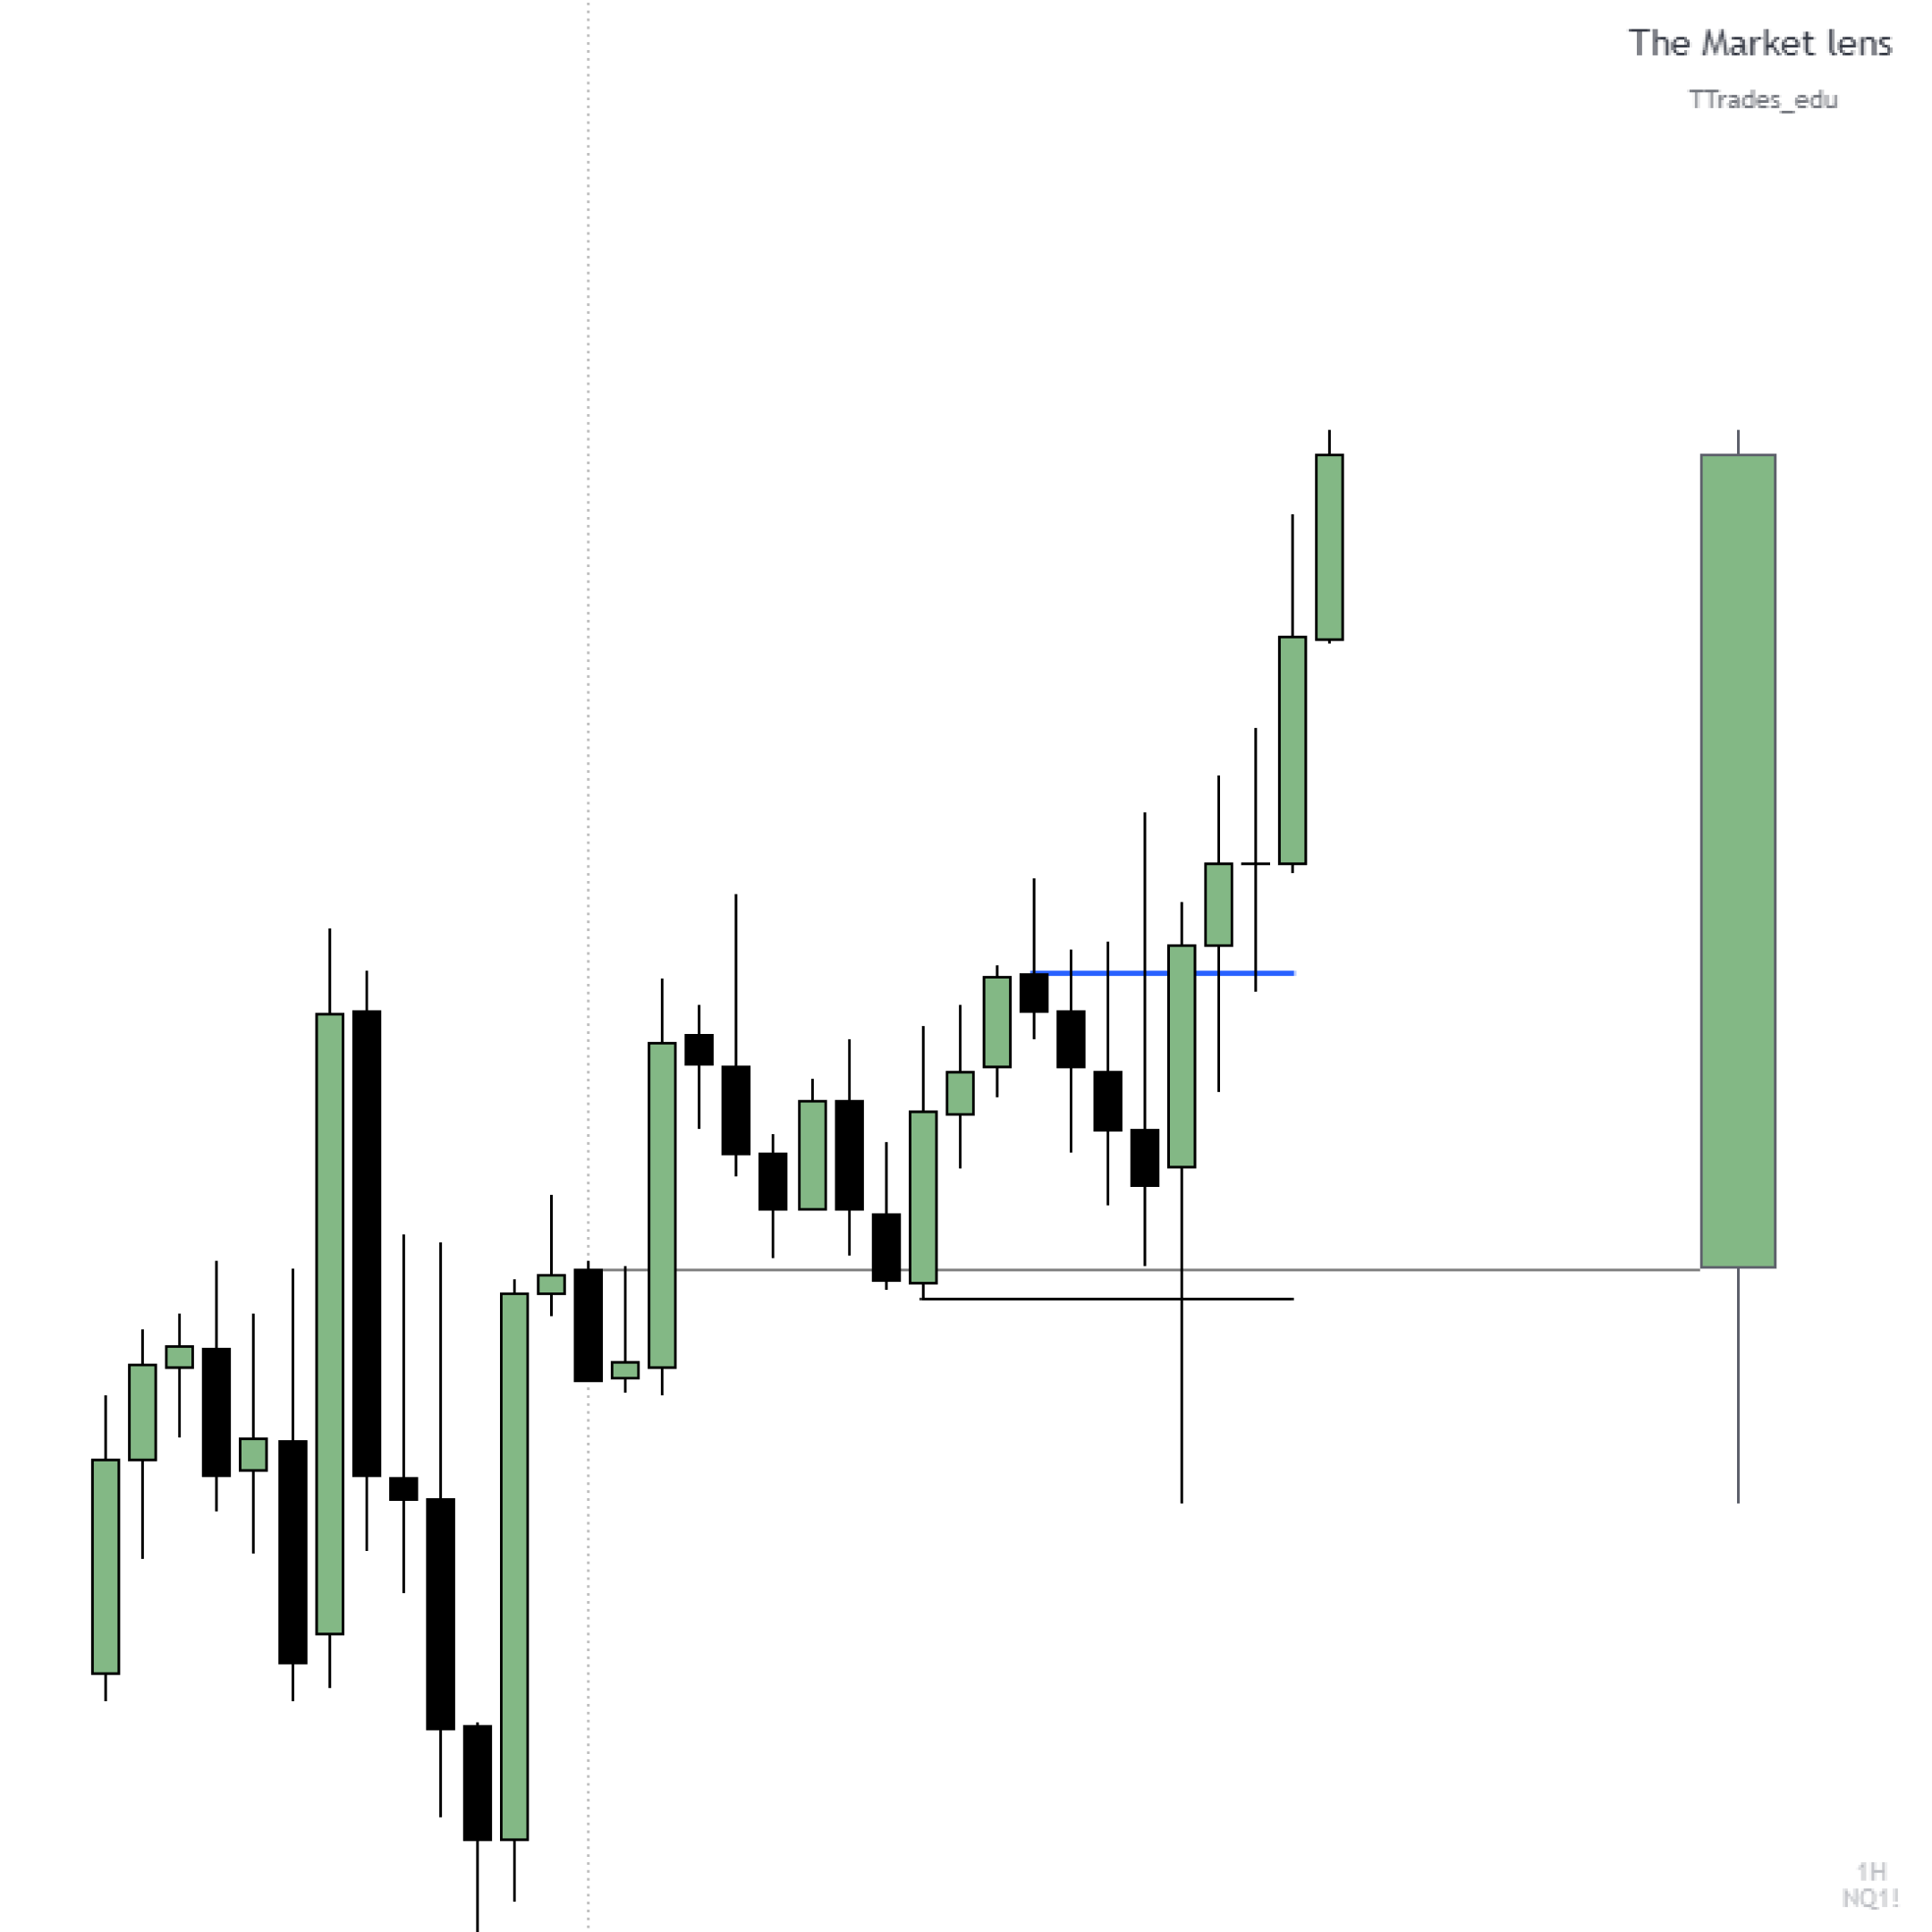
Price closes above a series of down-close candles, confirming a shift in delivery.
Entry framed at the order block or FVG, stop below the low.
Target: Previous Day’s High (PDH).
Result: Price expands higher, completing the Power of Three.
💡 Pro Tip: When 8:30am EST forms the manipulation, look for 9:30am EST or 10am EST to drive price in its intended direction.
Example: Bearish New York Manipulation
London sets no significant high or low.
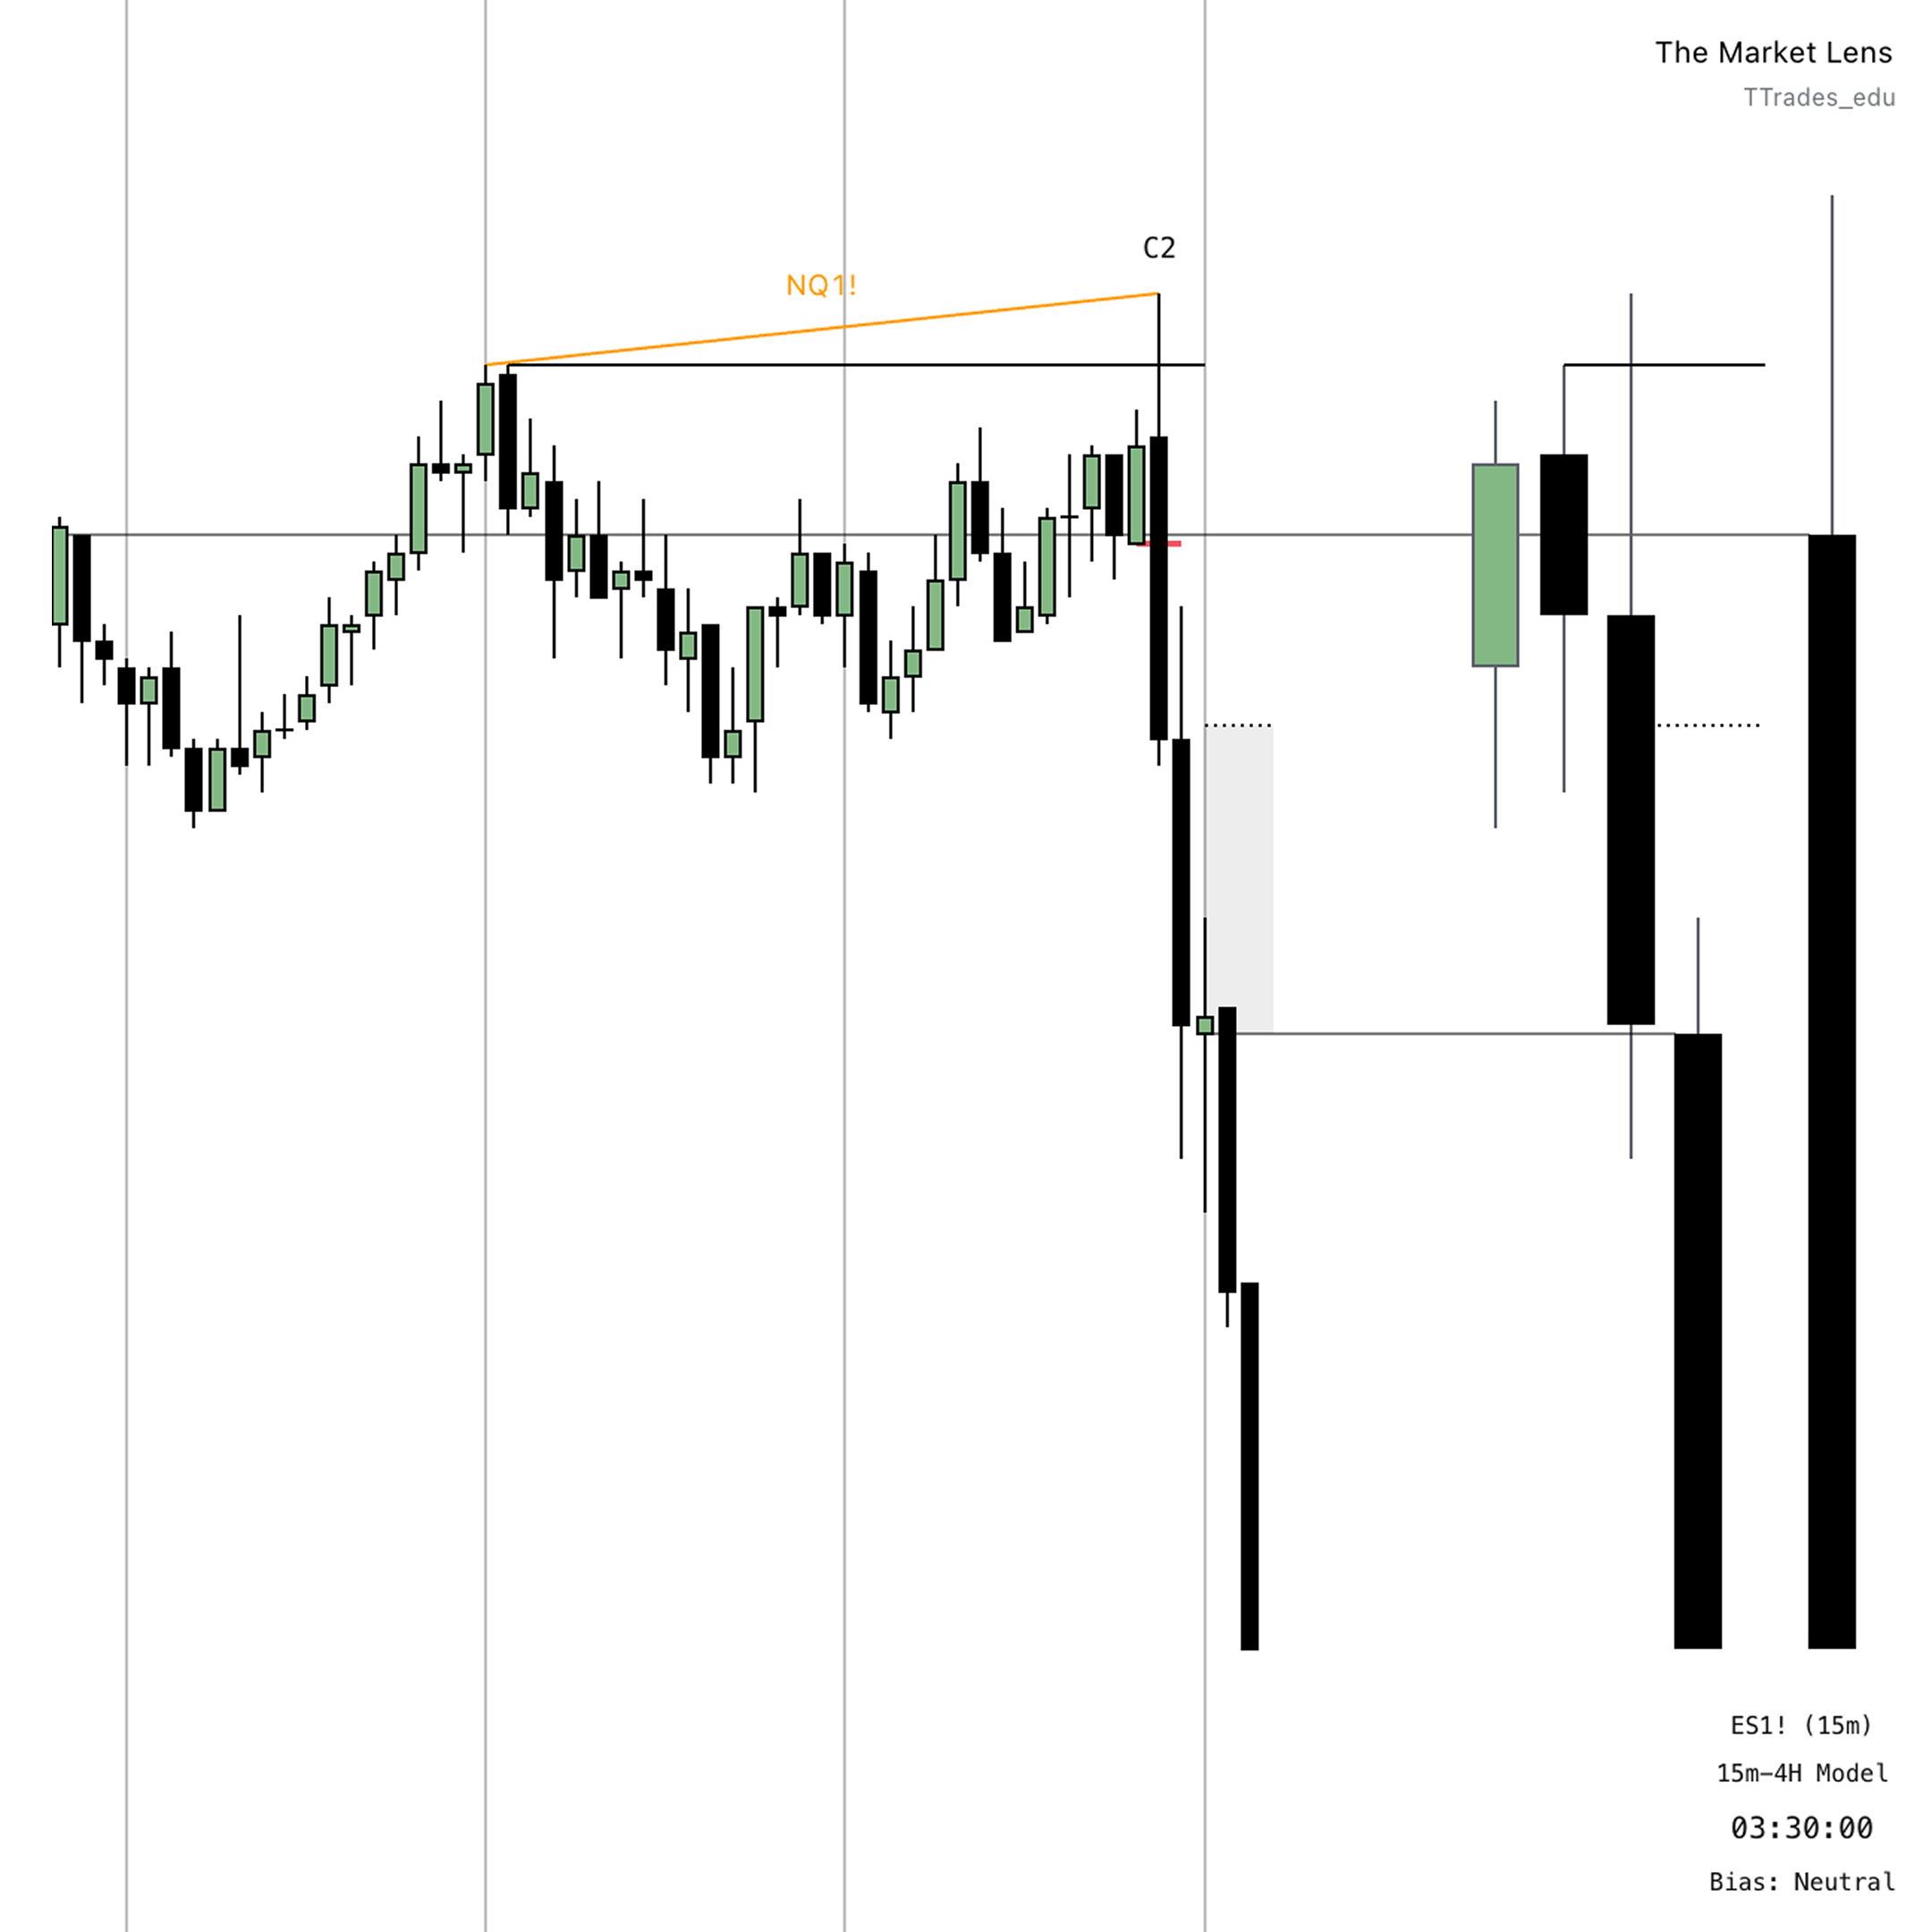
At 9:30, New York sweeps liquidity above London’s high.
Price then closes below a series of up-close candles, confirming the bearish shift.
Extra confluence from the SMT
Result: Price delivers downward expansion as shown using the 4H – 15M fractal model indicator.
Adding Confluences
Traders can add extra confirmation tools, such as:
Standard Deviation Projections: Helps identify expansion targets (e.g., 2.0–2.5 lines up with PDH/PDL, 4.0–4.5 marks maximum expansion).
4H Power of Three: if 9:30am forms the manipulation, look for the 10am 4H PO3.
Key Takeaways
New York manipulation often occurs when London session forms a consolidation.
Watch 8:30 and 9:30 EST for liquidity sweeps and false moves.
The setup relies on confirming a change in the state of delivery before entering.
Targets often align with previous day’s high/low or liquidity pools.