
Introduction
In this guide, we’ll explore how I use equilibrium in price continuations, flipping the common ICT approach to discount and premium. If you’ve watched my discount and premium video, you know ICT teaches discount as a buy zone and premium as a sell zone. I take a different path, adapting the concept to better my expansion phase trading model – The Fractal Model.
Why I Use Equilibrium Differently
The main reason I use equilibrium opposite to the traditional method comes down to the phases of price. When the market is in an expansion phase, the phase I prefer to trade, it rarely retraces deep enough to reach a traditional discount or premium zone or equilibrium of the range.
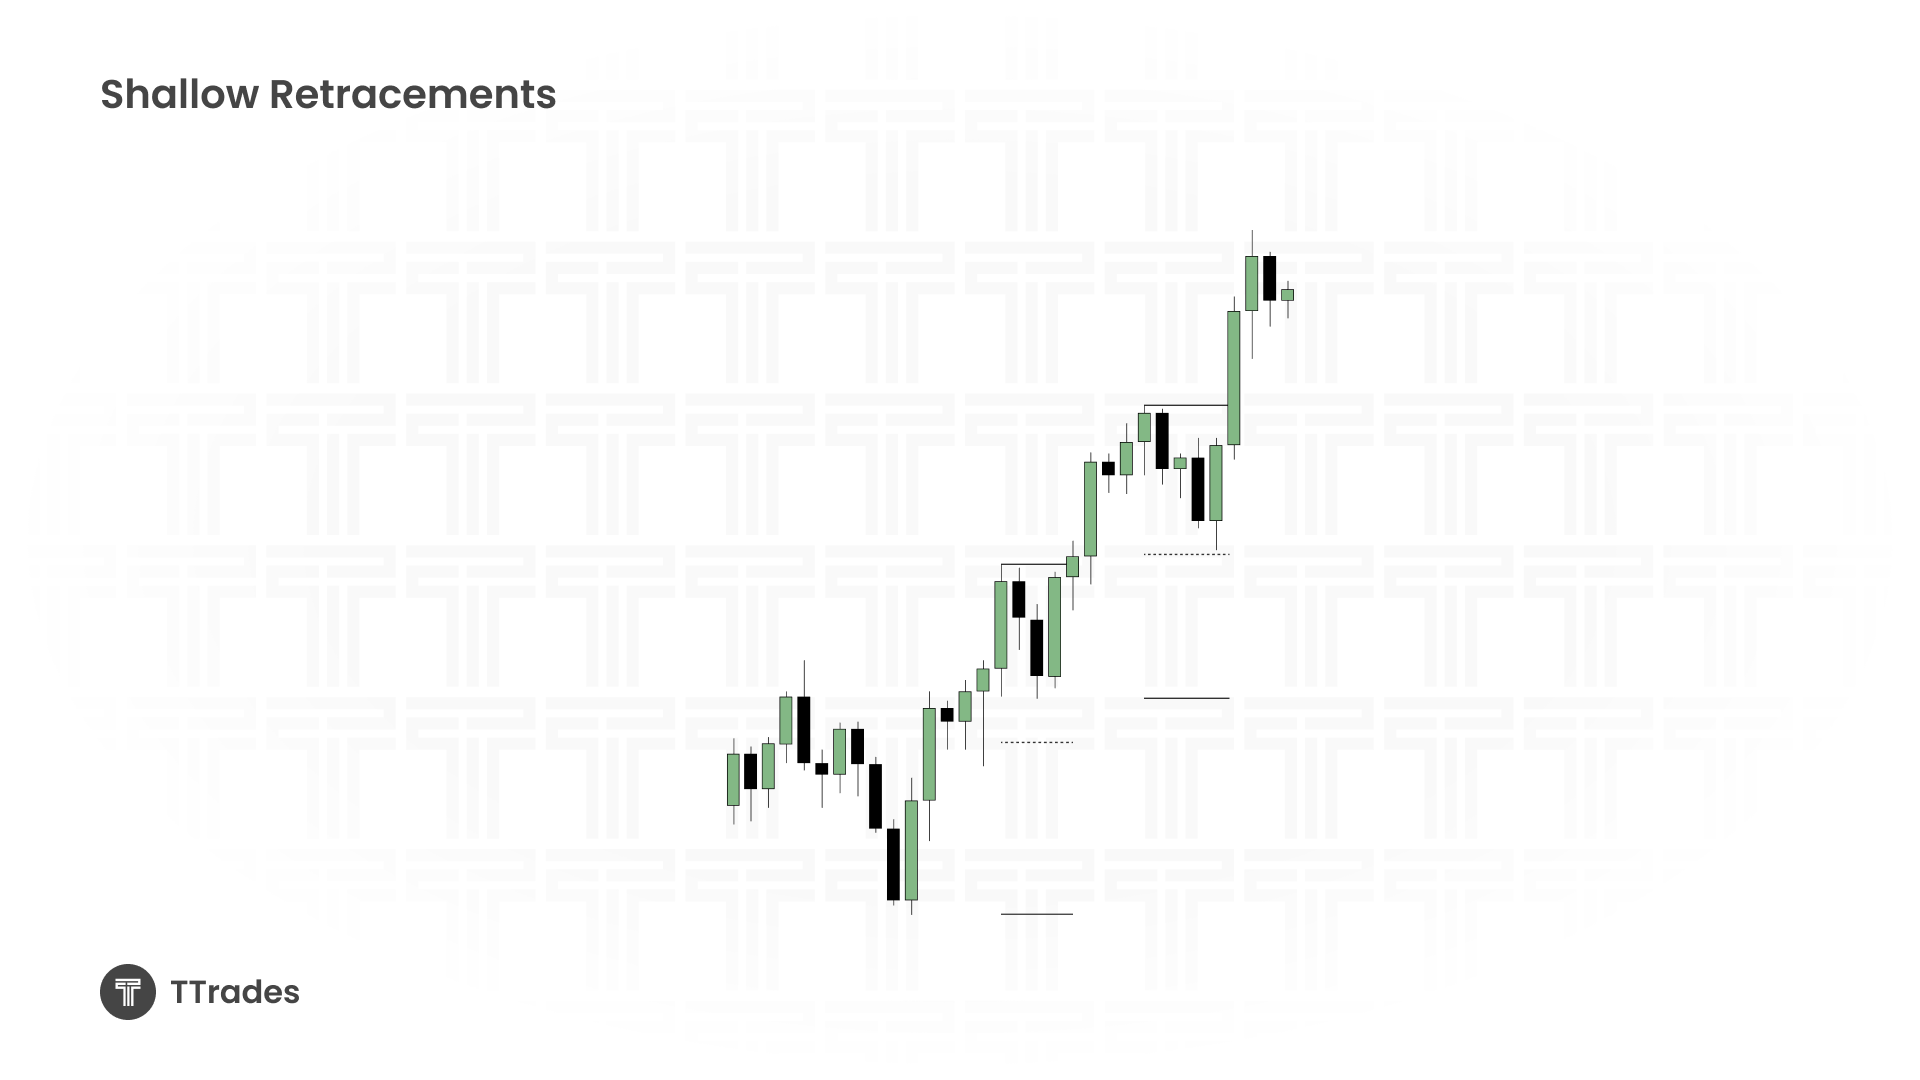
Instead, I use equilibrium as a dividing line within the current range:
- Upper half respected – bias to trade higher
- Lower half respected – bias to trade lower
If these zones fail to hold, I can choose to flip my bias and anticipate the opposite side of the range being taken.
Fibonacci Setup
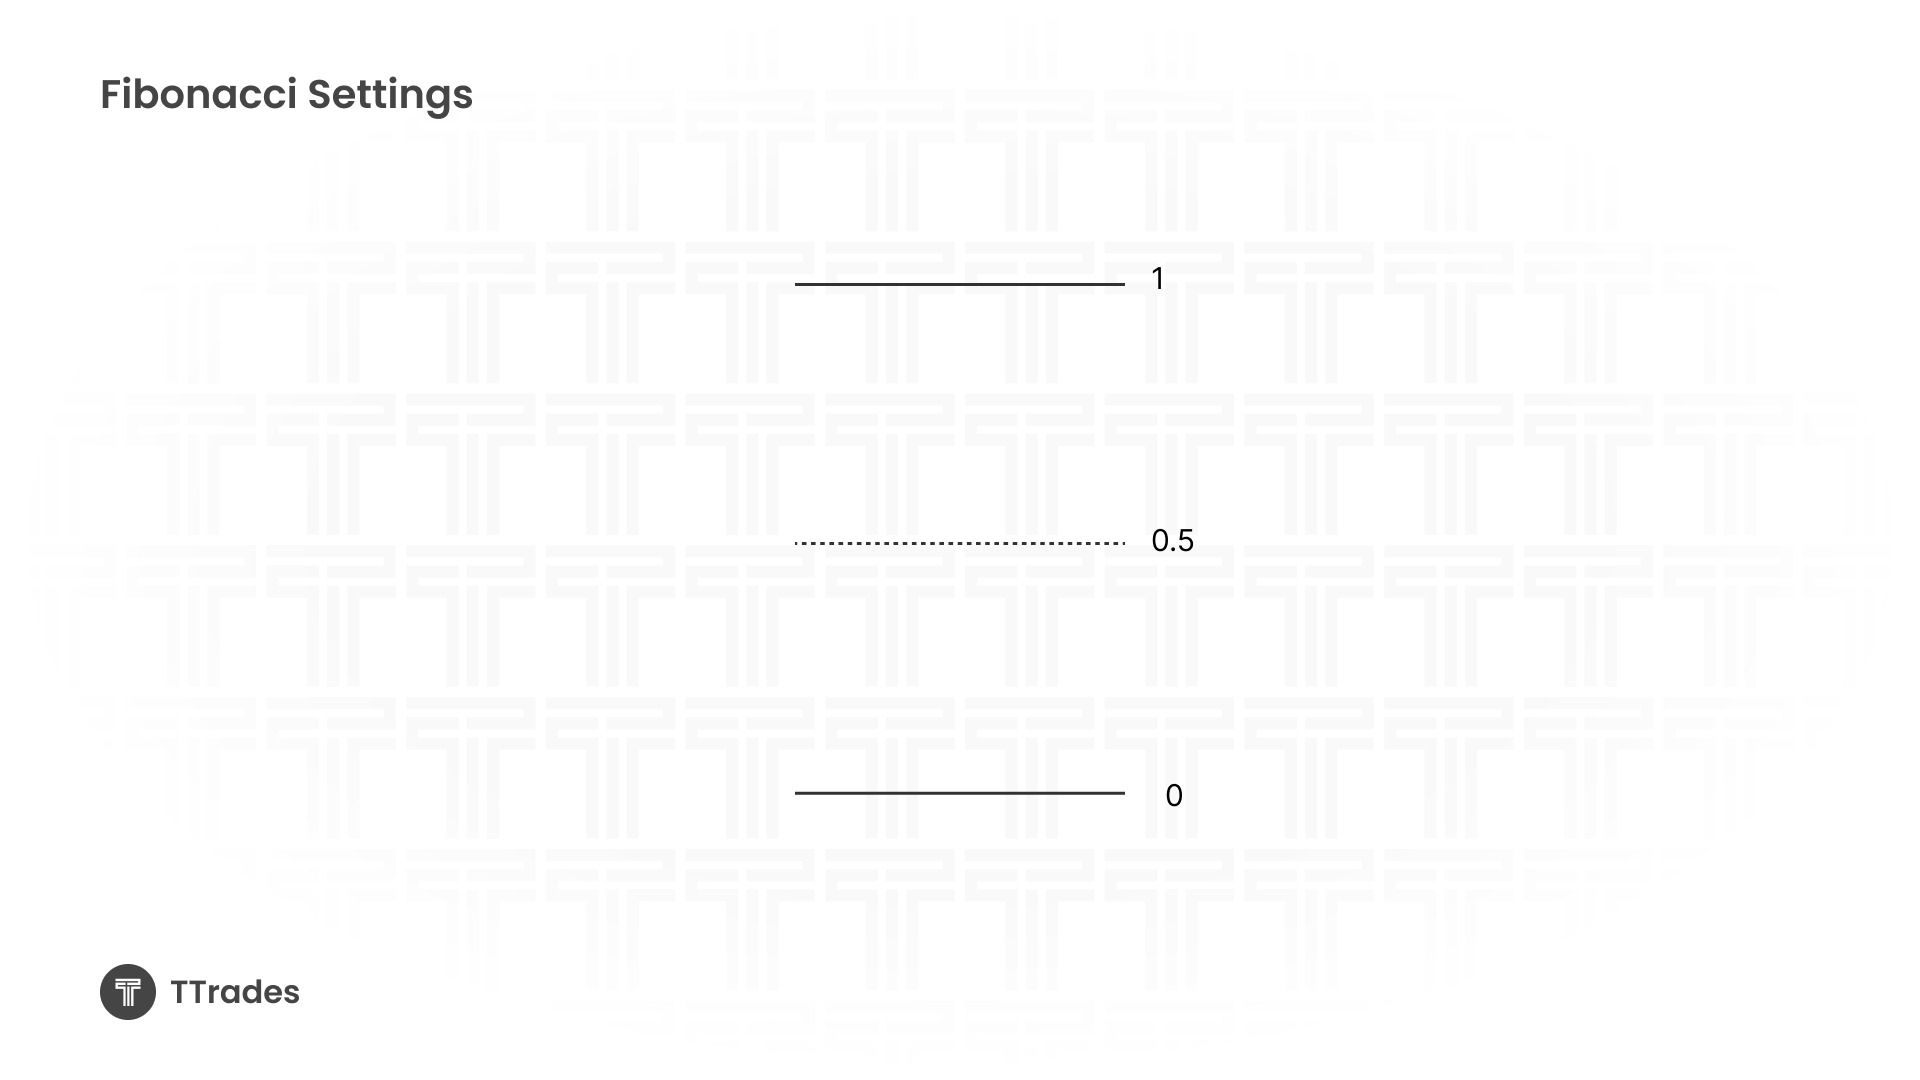
I keep my Fibonacci simple:
- Levels: 0, 0.5 and 1 (often removing 0 and 1 to focus only on the midpoint).
- Always measure Wick High to Wick Low.
- Ignore candle bodies (unlike when measuring for Change in State of Delivery or order blocks).
This method ensures equilibrium reflects the true price extremes for that candle or range.
Applying Equilibrium in Expansions
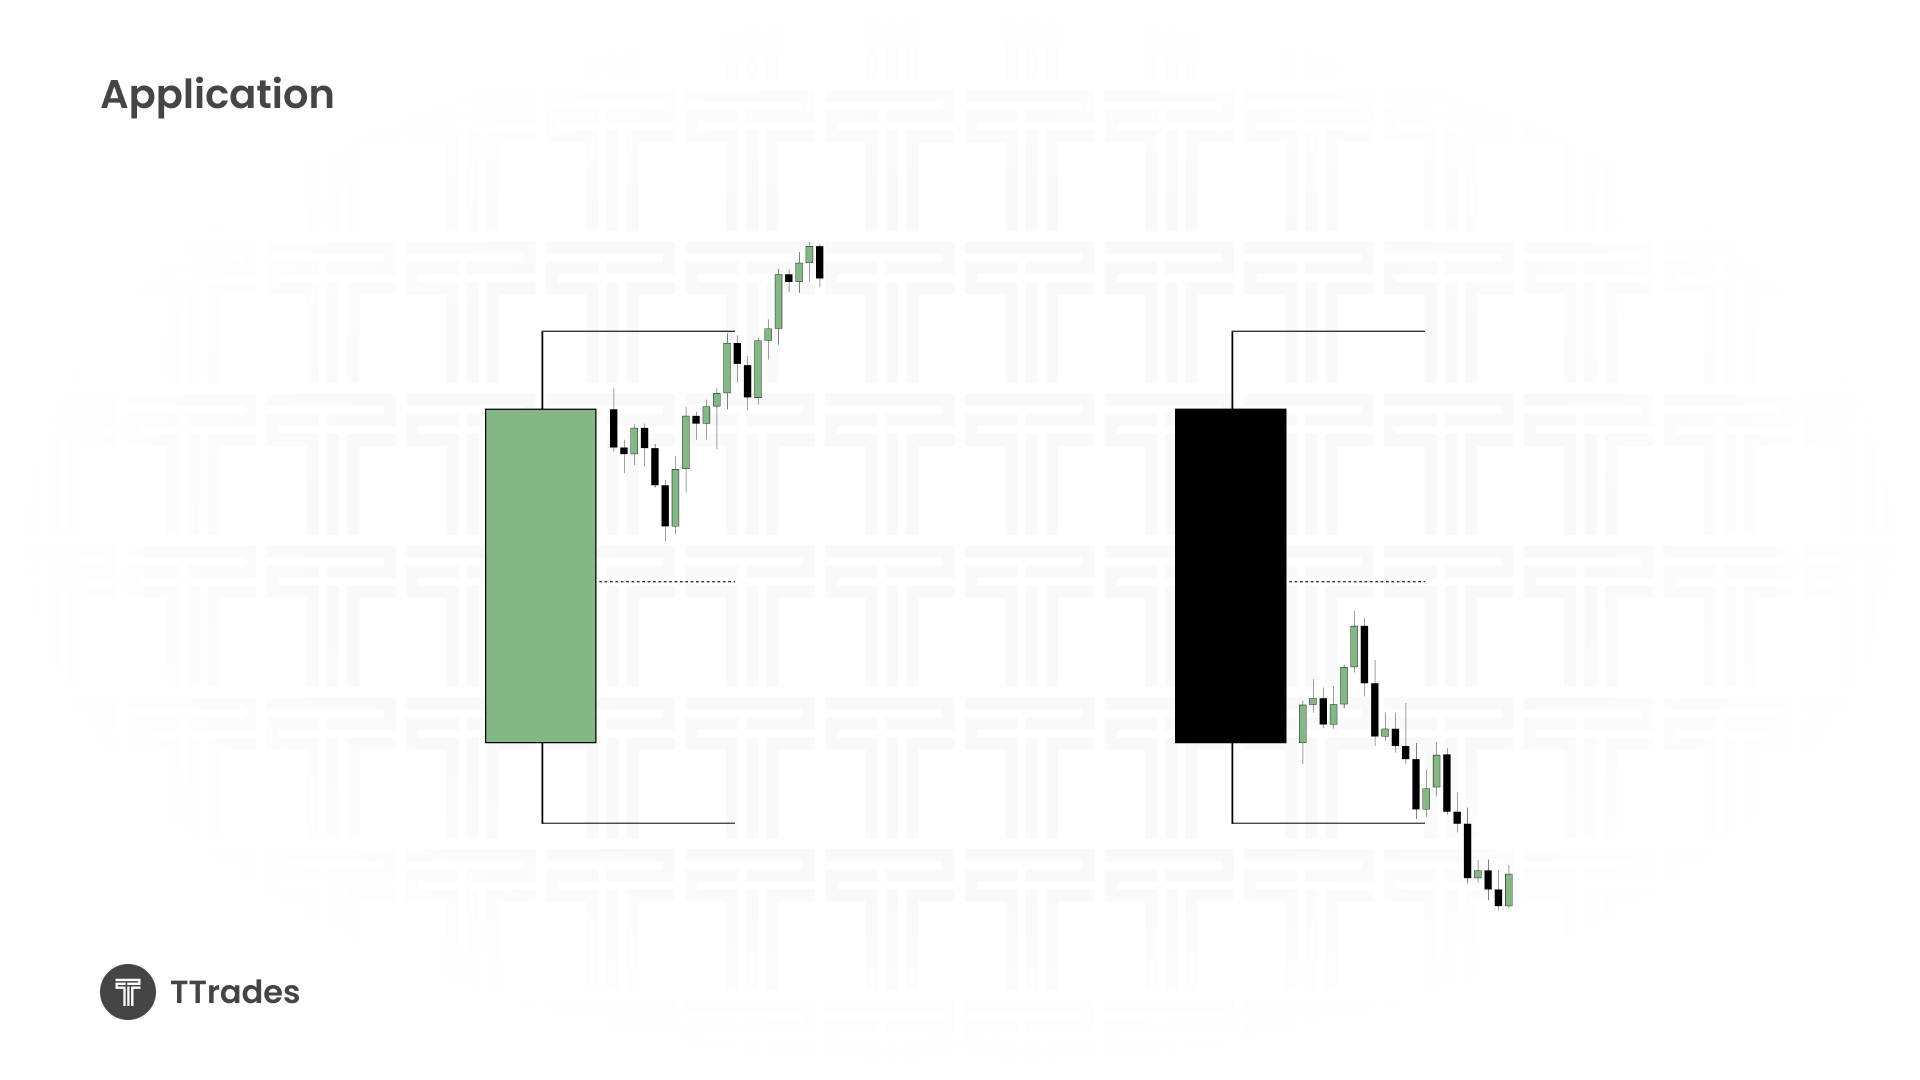
When price is expanding:
- I expect the upper half of a bullish candle’s range to act as support for continuation higher.
- I expect the lower half of a bearish candle’s range to act as resistance for continuation lower.
If these levels don’t respect, I reassess bias.
Step-by-Step: Using Equilibrium in Continuations
Identify the Range or Candle
Use previous day’s range or a significant higher-timeframe candle.
Mark 0.5 (Equilibrium)
Wick high to wick low.
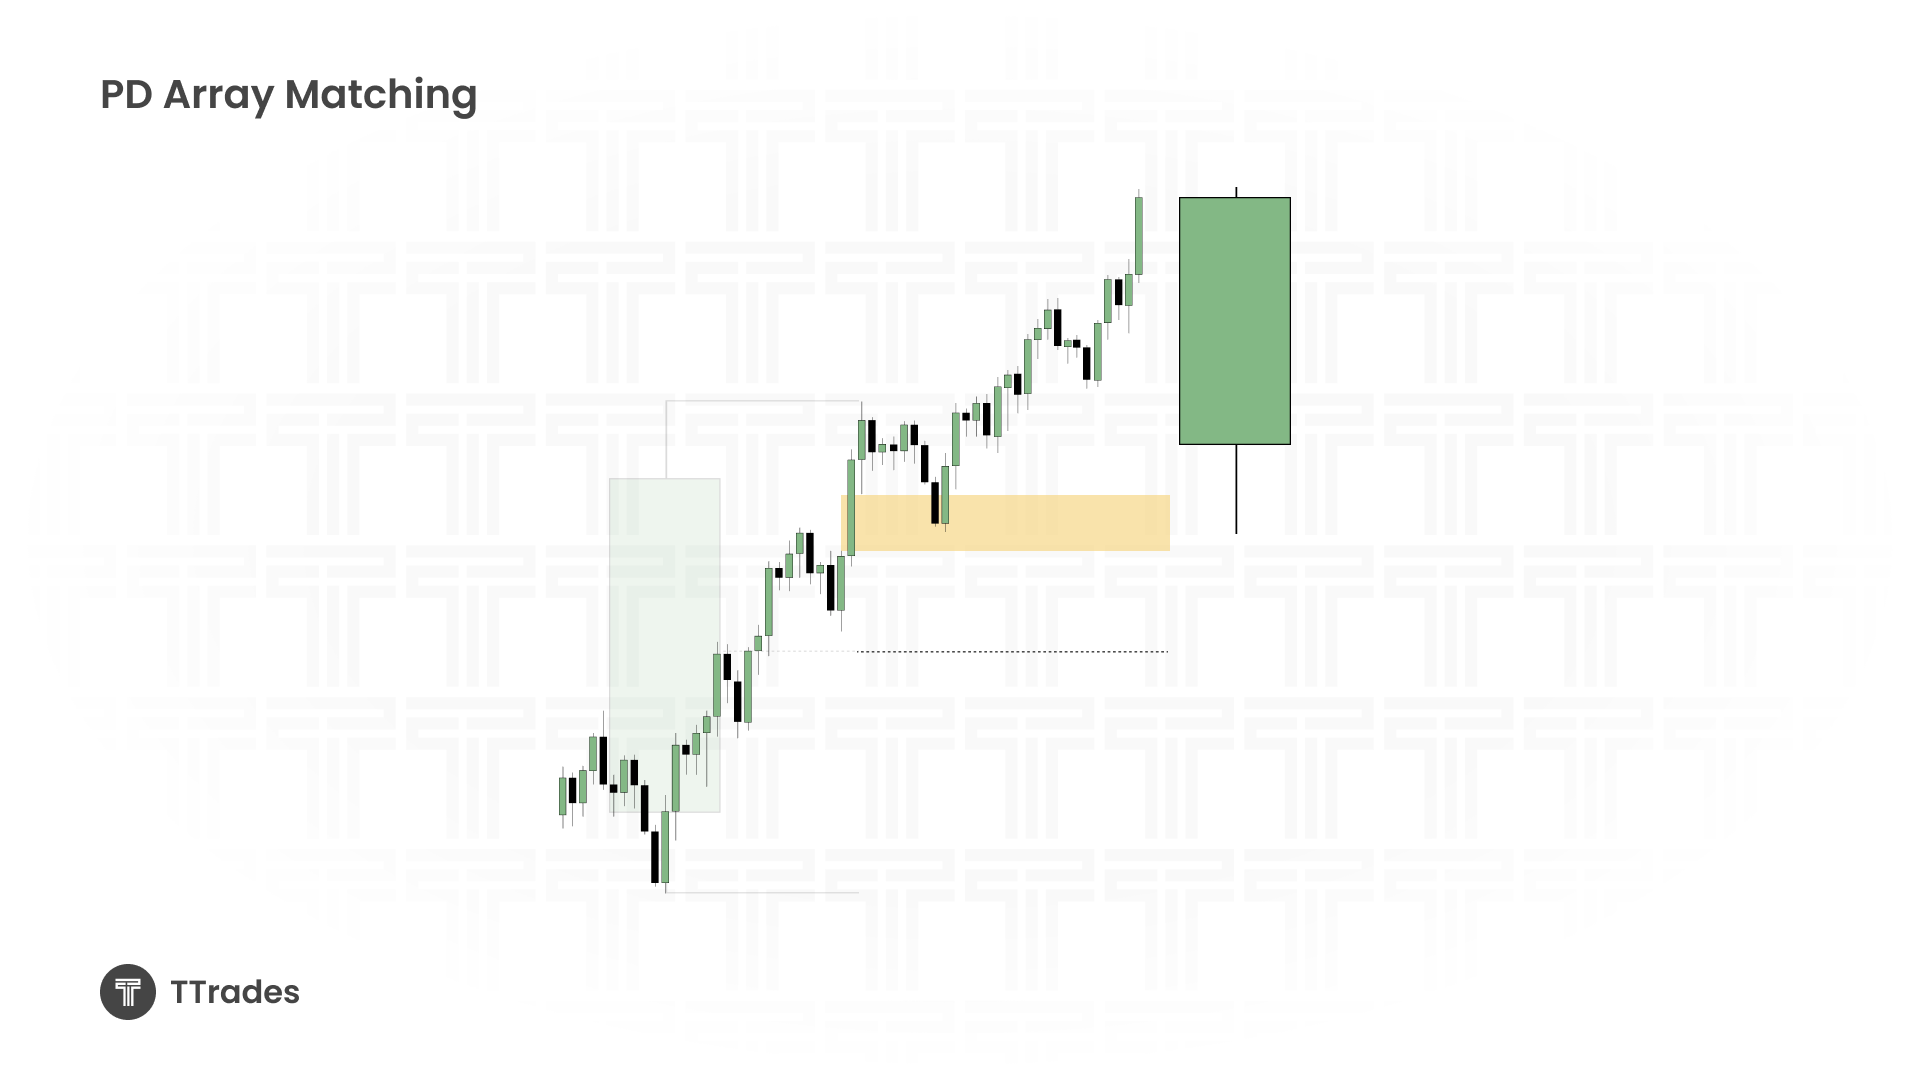
Match PD Arrays Within the Respected Half
Look for supporting elements like fair value gaps, order blocks, or protected highs/lows.
Wait for Confirmation
Look for a reaction in the given point of interest. Use a candle closure paired with a change in the state of delivery (CISD).
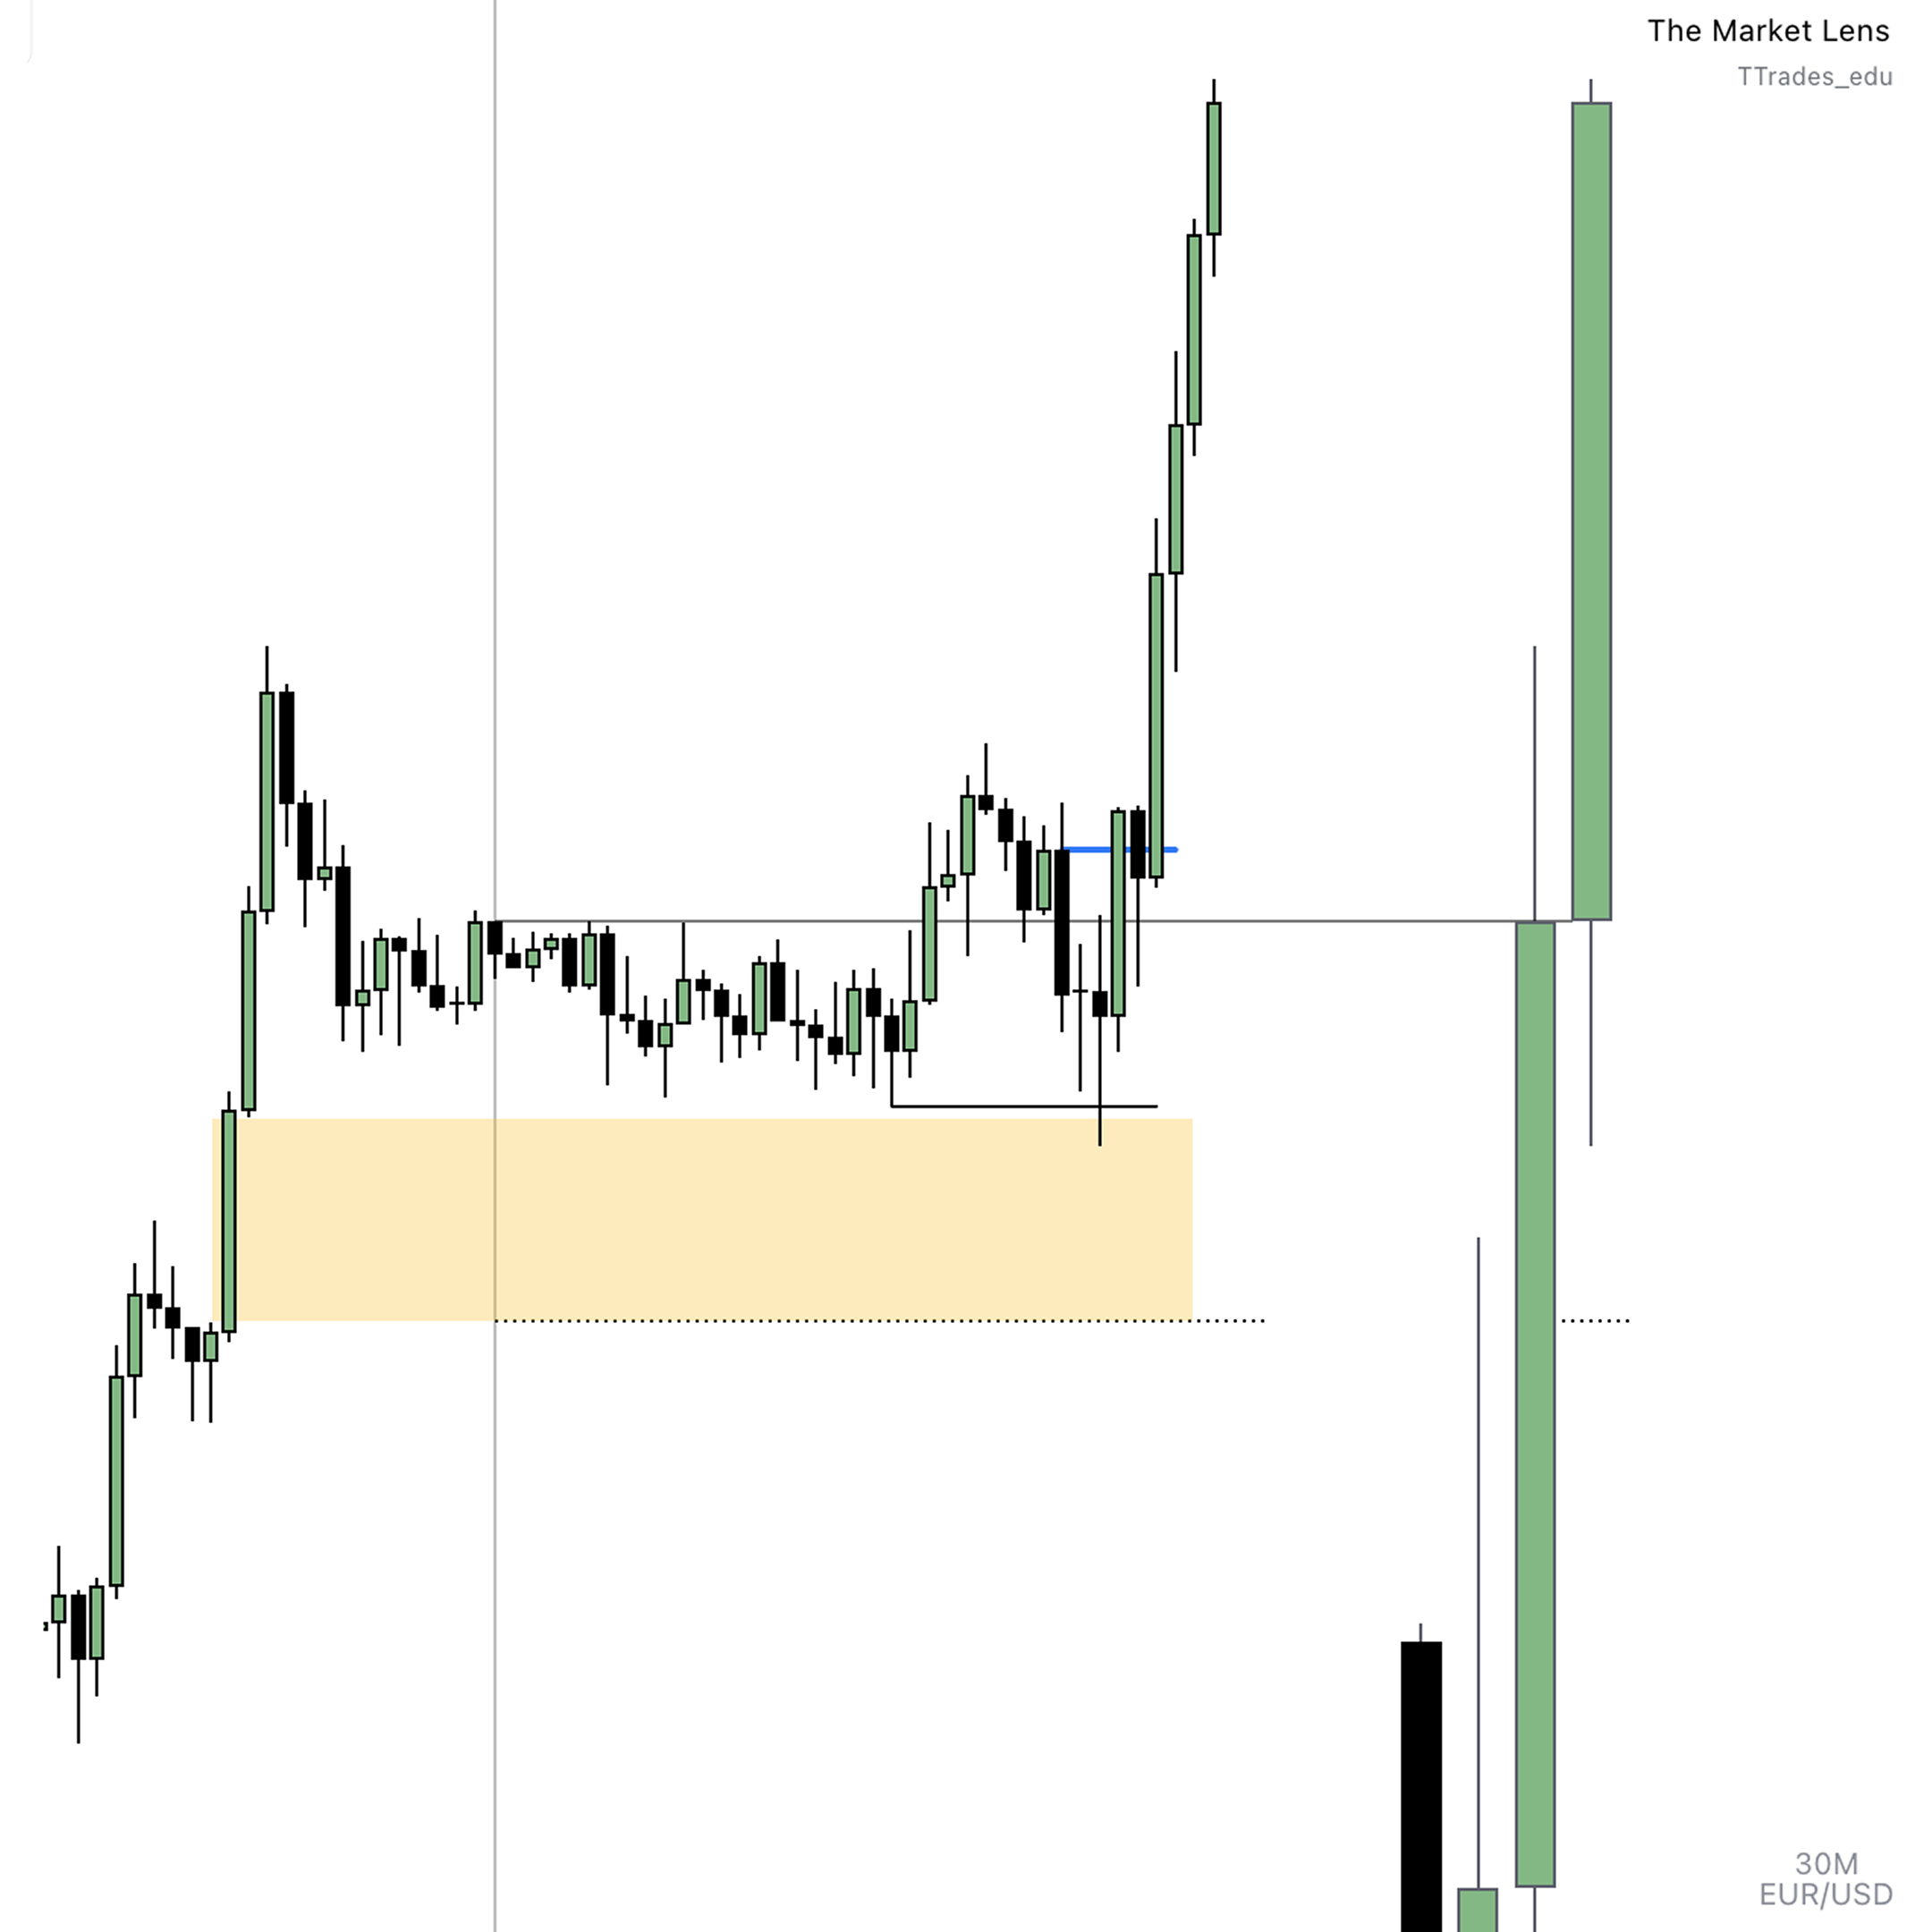
Example – Bullish Continuation
- Previous day shows bullish expansion.
- Mark 0.5 of the daily range.
- In the upper half, find a fair value gap above a protected low.
- Price opens, dips into the fair value gap while sweeping out consolidation lows, has a bullish candle closure, forms a protected swing, then expands higher.
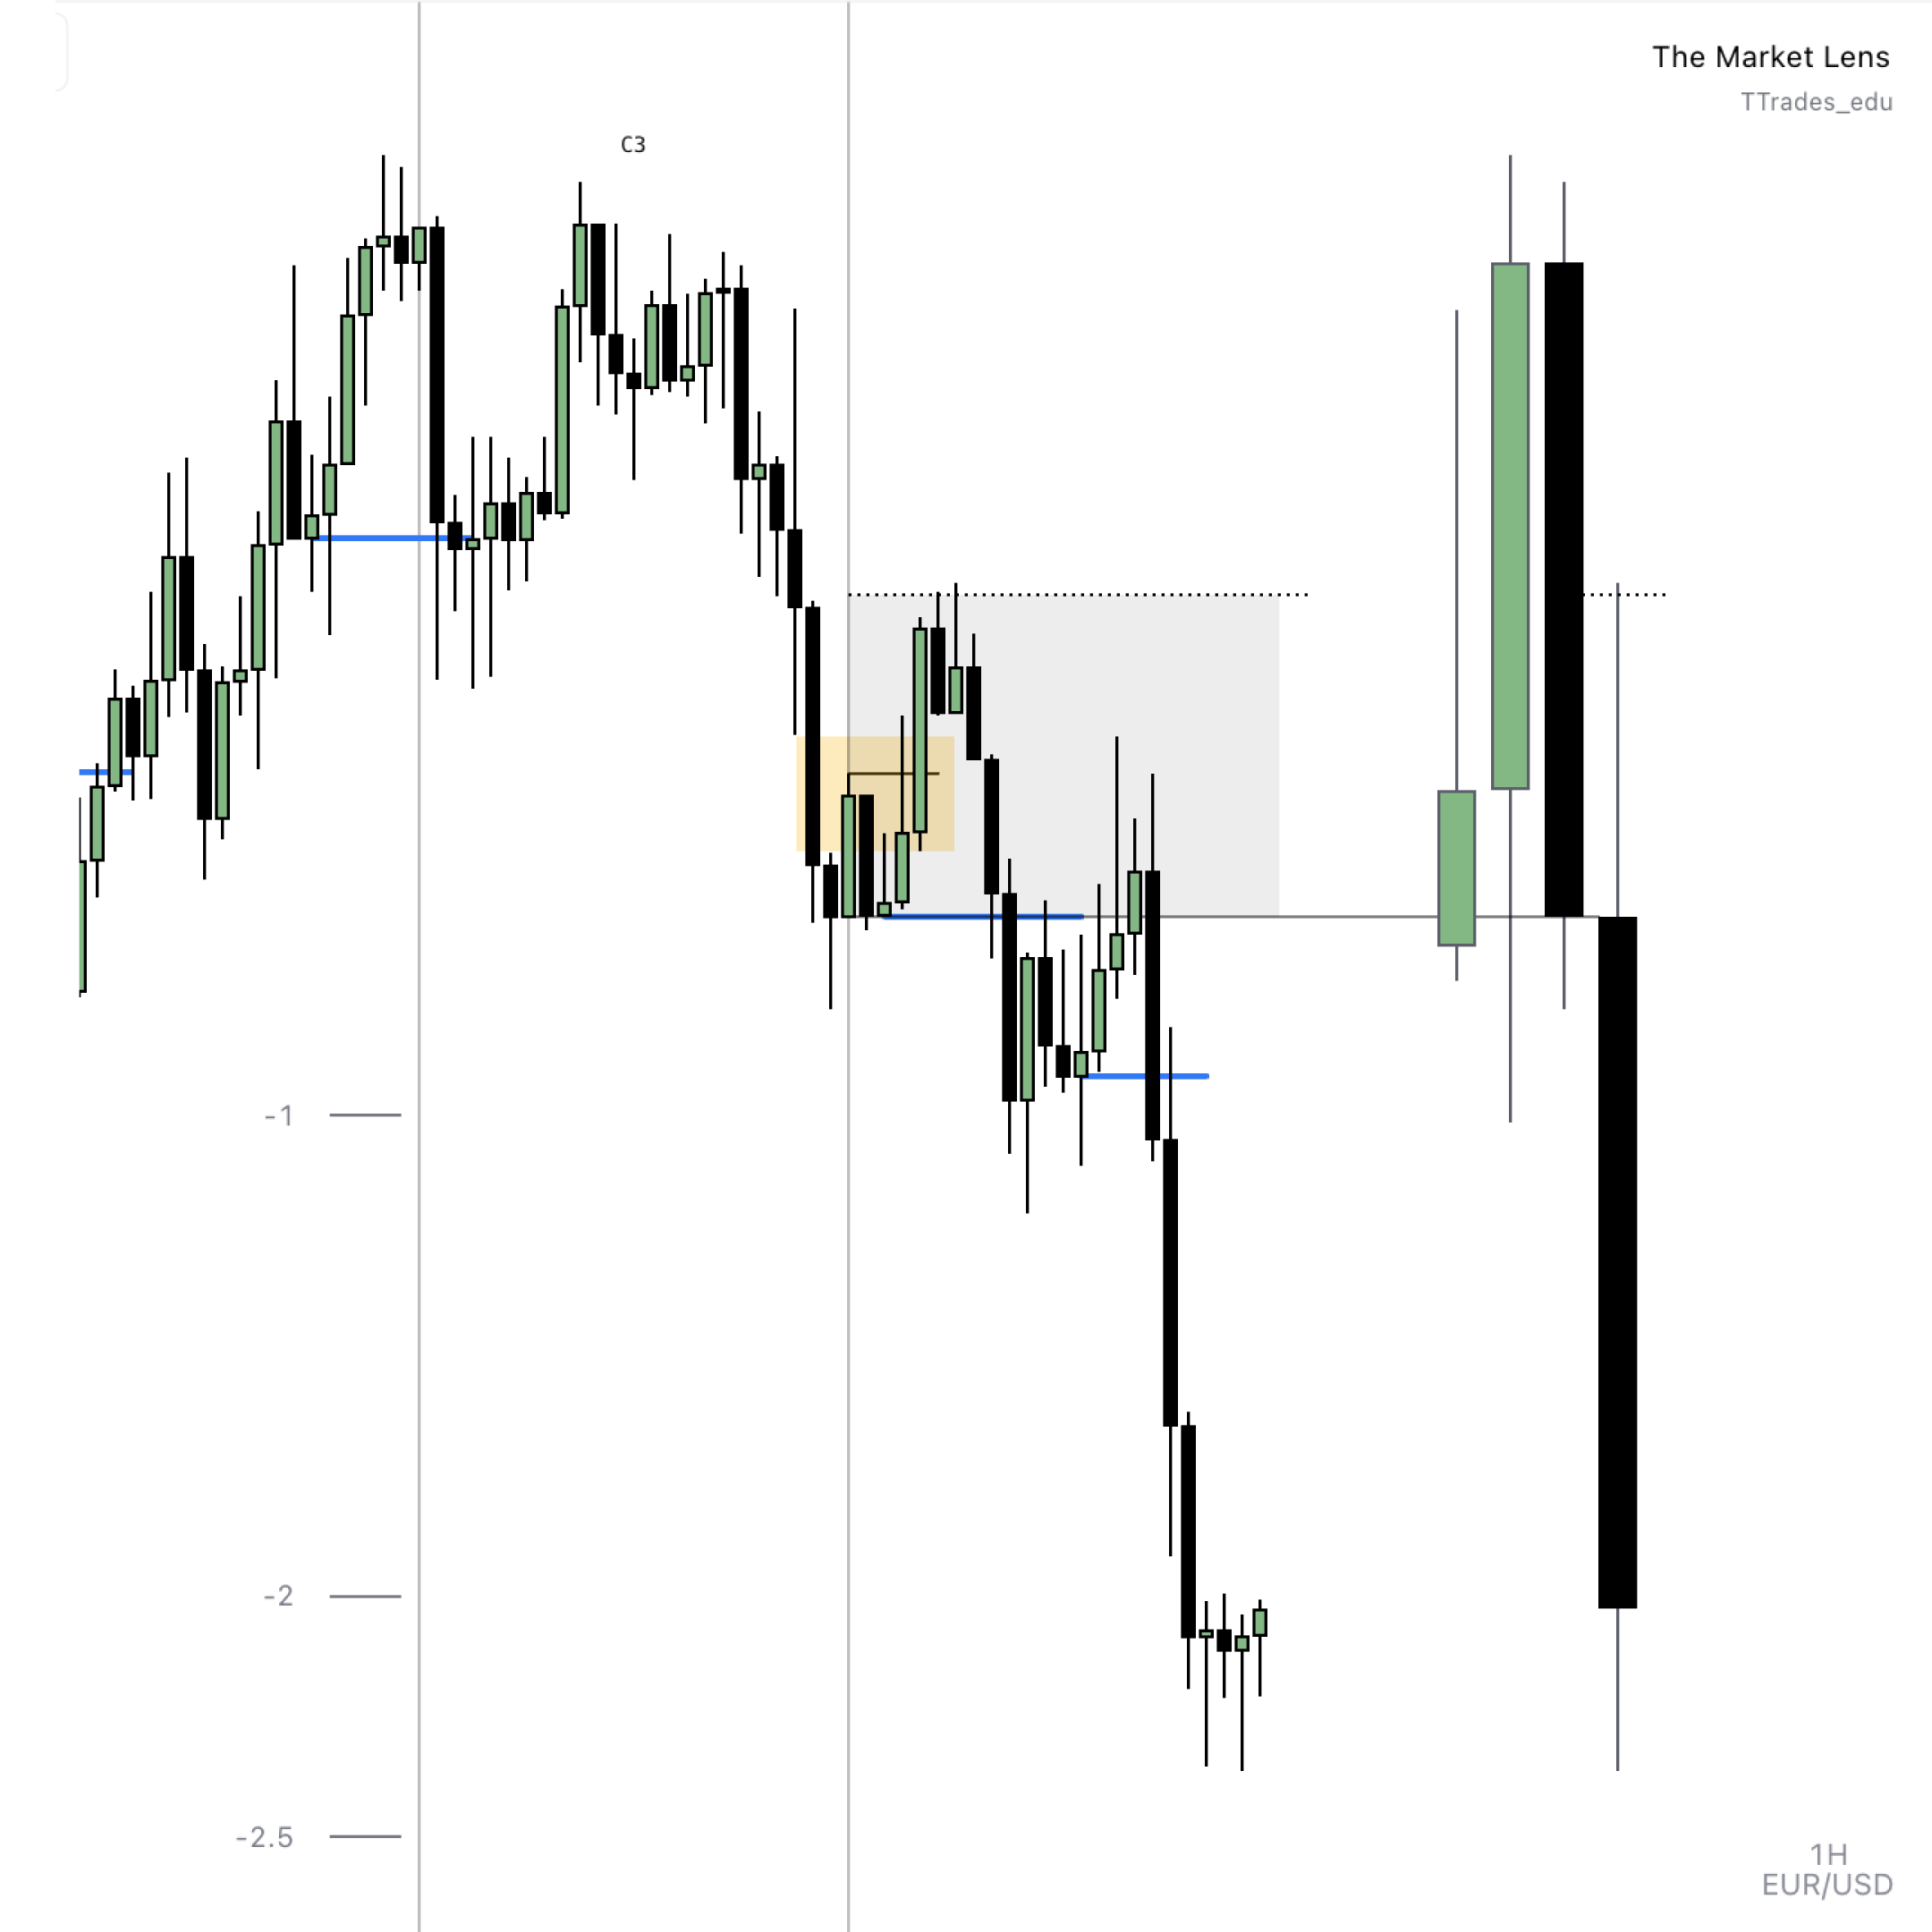
Example – Bearish Continuation
- Previous day closes bearish, forming a C3 closure.
- Mark 0.5 of the daily range.
- In the lower half, identify an POI, in this case a fair value gap.
- Price retests and rejects, continuing lower.
💡 Pro Tip: If you miss the reversal, track the protected swings for a continuation, or drop to a lower timeframe for a refined entry using top down analysis.
💡 Pro Tip: If price doesn’t respect the fvg in the EQ area, use the newly created liquidity as a POI.
💡 Pro Tip: Pair with standard deviation projections as a target.
Intraday Context
While my main bias comes from daily or 4H candles, I refine entries on the hourly and 15-minute charts:
- Look for EQ respect during the New York session.
- Pair with PD arrays for high-probability setups.
- Watch for sweeps, SMT divergences, and CISD to trigger entries.
Fractal Nature of the Concept
This equilibrium principle works on any timeframe. I will use a EQ level from a higher timeframe and then monitor how price reacts on a lower timeframe. I use the timeframes discussed throughout my timeframe alignment video:
- Daily EQ → hourly timeframe
- 4 Hour EQ → 15 minute timeframe
- 1 Hour EQ → 5 minute timeframe
- 15 Minute EQ → 1 minute timeframe
The logic is the same, look for price to respect the 0.5 in an expansion phase, align with PD arrays, and trade in the direction of the trend.
Key Takeaways
- Flip the traditional ICT use of discount/premium when trading expansions.
- Always measure wick to wick.
- Use equilibrium as a bias divider: upper half for longs, lower half for shorts.
- Confirm with candle closures and CISD.
- The concept is fully fractal across timeframes.